

Trends & Insights
The First Payment Is Just the Beginning: What Subscription Lifecycle Analytics Actually Measures
2026
.
3
.
18
By
Team Airbridge

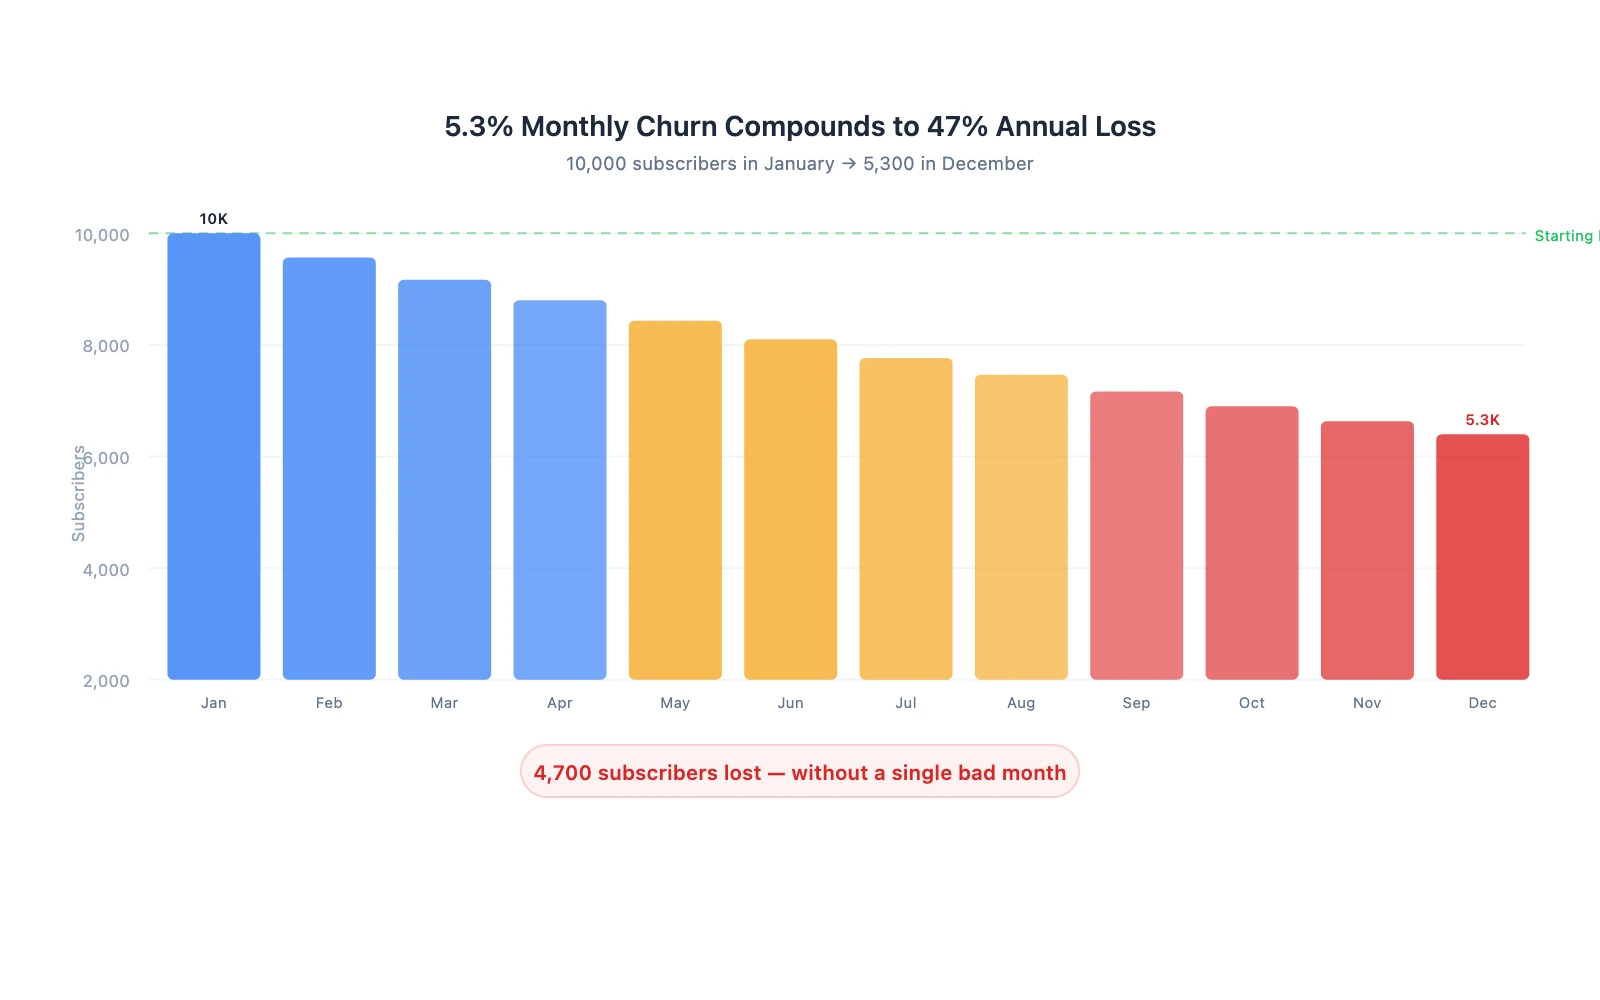
A 5.3% monthly churn rate sounds manageable. Lose 53 subscribers out of 1,000 each month — you can replace them.
But churn compounds. That 5.3% monthly rate means losing 47% of your subscriber base over a year. A fitness app with 10,000 subscribers in January will have 5,300 by December — even if nothing else changes. And most teams do not see this happening because they stop measuring at the first payment.
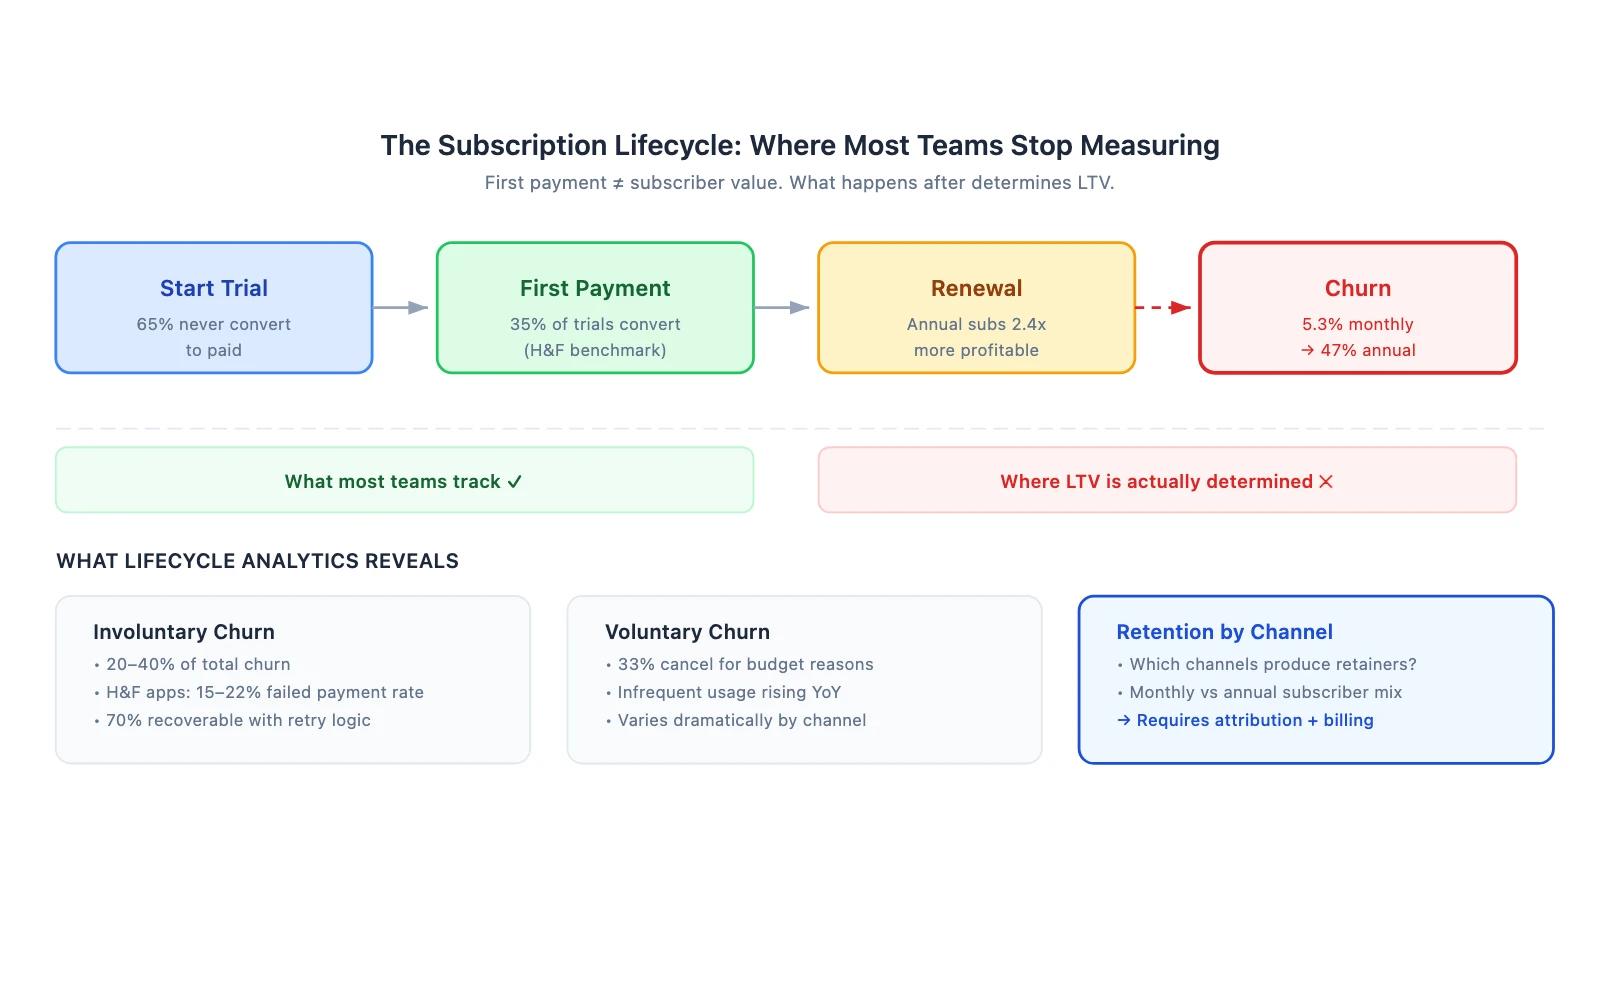
The install got tracked. The trial got tracked. The first subscription got tracked. What happens after — whether that subscriber renews, churns, or fails a payment — is where most measurement systems go dark.
This is the gap that subscription lifecycle analytics fills. It is not a single metric. It is the practice of tracking every revenue-relevant event from trial to renewal to churn — and connecting each event back to the channel that acquired the user.
Key Takeaways
The typical subscription app measurement stack covers three events:
These three events tell you how much it costs to acquire a subscriber. They tell you nothing about what that subscriber is worth. A subscriber who cancels after one month has a completely different LTV than one who renews for a year — but at the point of first payment, they look identical.
Subscription lifecycle analytics extends measurement beyond the first payment to capture the events that actually determine LTV:
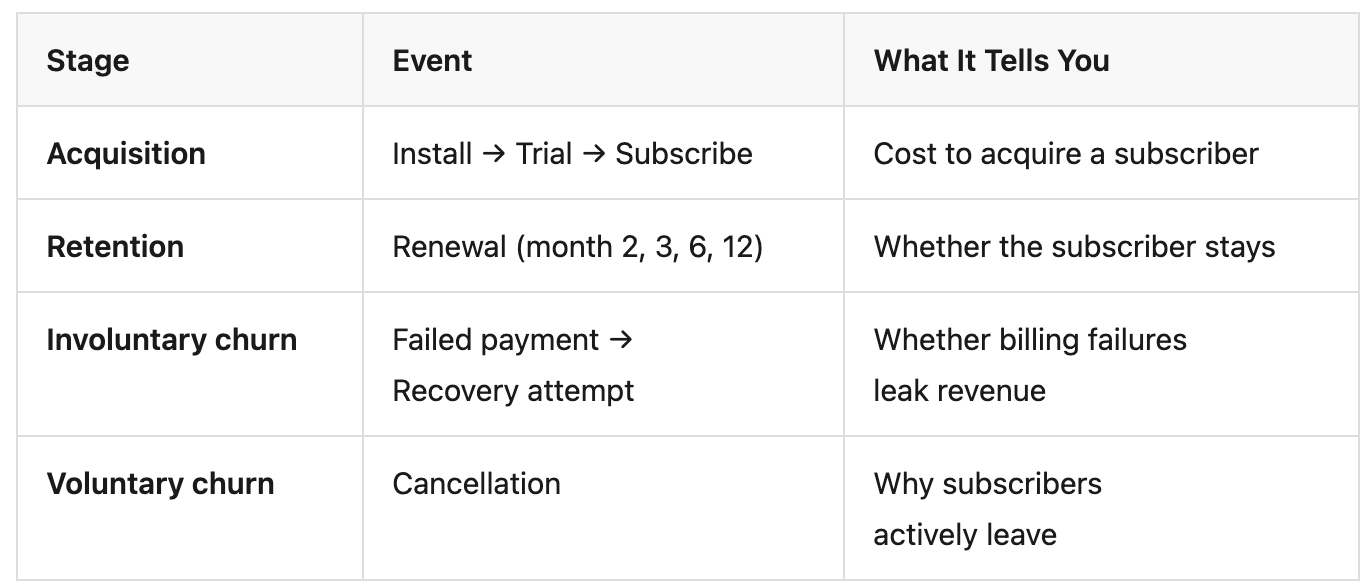
The first row is where most teams stop. The last three rows are where LTV is determined.
This is the most visible conversion in the subscription funnel. Health & Fitness apps convert trials to paid at 35% — meaning 65% of trials never generate revenue.
What to track: Trial-to-paid conversion rate by channel. If Meta trials convert at 20% and Google trials convert at 45%, the cost per subscriber is radically different even at similar CPI. This stage is well-covered in our CPI vs CPS analysis.
The first payment proves willingness to pay. The second payment proves willingness to stay. Month-1-to-month-2 renewal is the single strongest predictor of long-term LTV — and most teams do not track it by channel.
Why this matters: annual subscribers are 2.4x more profitable than monthly subscribers and churn 51% less. But if you do not track which channels produce annual vs monthly subscribers, you cannot optimize for retention quality.
What to track: Month-2 renewal rate by acquisition channel. A channel with high first-payment conversion but low renewal produces churners, not subscribers.
Not every subscriber who leaves chose to leave. Failed payments account for 20–40% of total churn, and Health & Fitness apps experience 15–22% failed payment rates.
These are subscribers who intended to keep paying — but their card expired, the bank declined the charge, or the payment method had insufficient funds. They did not cancel. The billing system lost them.
Churnkey's 2025 data shows that 70% of involuntary churn can be recovered through retry logic and recovery campaigns. But most teams do not even know how much revenue they are losing to failed payments — let alone which acquisition channels produce subscribers with higher payment failure rates.
What to track: Failed payment rate and recovery rate by cohort. If a specific acquisition channel consistently produces subscribers with higher involuntary churn, the true CPS of that channel is higher than it appears.
Voluntary churn accounts for the majority of subscription losses. Budget limitations drive 33% of cancellations, followed by infrequent usage.
The ratio varies by app category, price point, and user profile — meaning the dominant reason your subscribers leave may look different across users acquired from different channels.
What to track: Cancellation rate and cancellation reason by acquisition channel. If subscribers from TikTok cancel for "infrequent usage" at 2x the rate of subscribers from Google, TikTok is delivering lower-intent users — regardless of CPI.
Without tracking beyond the first payment, budget decisions rely on acquisition metrics alone. Here is what that misses:
Channel A looks 20% cheaper on CPS. But that 10-point renewal gap compounds every month. By month 6, Channel B retains more subscribers in absolute terms than Channel A — despite starting with 20% fewer. If each subscriber generates $15/month, Channel B produces significantly more cumulative revenue per cohort despite higher acquisition cost.
This calculation is impossible without renewal tracking by channel. And renewal tracking by channel requires connecting billing events (RevenueCat, Adapty) to acquisition source — which is exactly what lifecycle analytics provides.
Tracking the full lifecycle does not require custom data pipelines. It requires connecting three systems that most teams already use:
Without an attribution system that integrates with your billing platform, these metrics exist in isolation — the billing platform sees the churn, but not the channel. The ad platform sees the install, but not the churn.
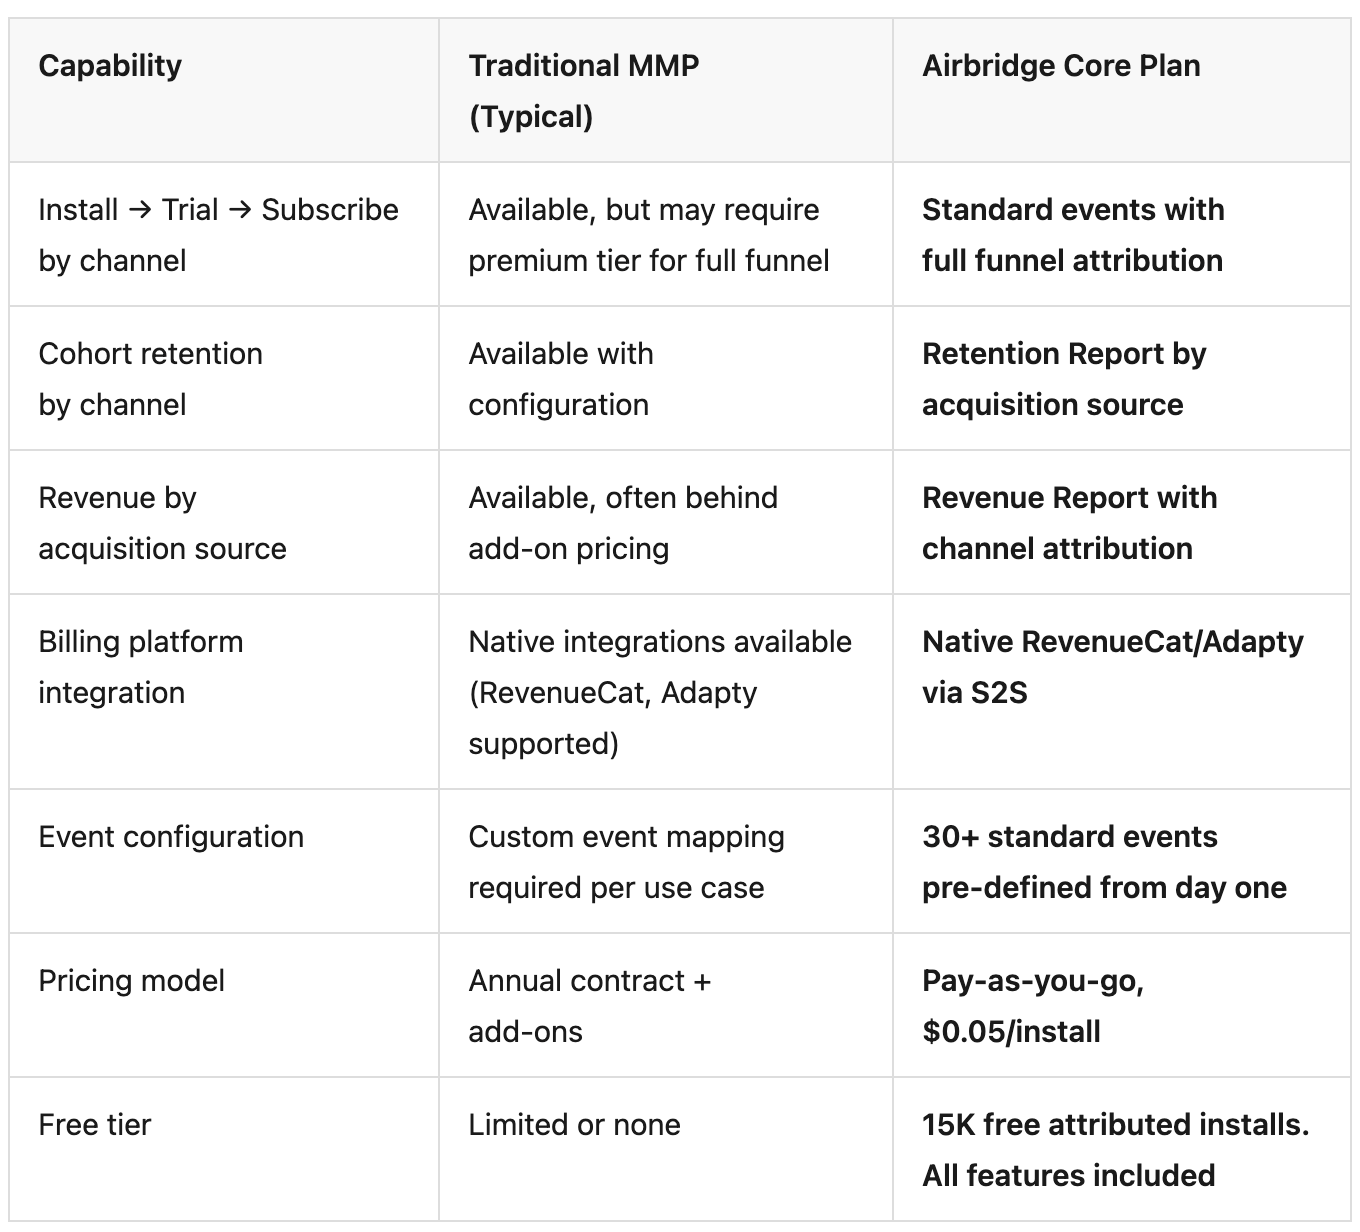
See which channels produce subscribers who stay — and which produce subscribers who leave. Funnel, Retention, and Revenue reports by channel. Start with 15K free attributed installs.
Core Plan tracks Install, Start Trial, Subscribe, and Unsubscribe as standard events with attribution across Meta, Google, Apple Search Ads, and TikTok. With native RevenueCat and Adapty integration via S2S, subscription lifecycle events flow into attribution automatically.
Three reports map directly to lifecycle stages:
The first subscription tells you one thing: the user paid. Everything that determines whether that payment was worth acquiring — renewal, retention, churn — happens after.
Subscription lifecycle analytics is not a new category of tool. It is the practice of connecting billing events to acquisition source — so budget decisions reflect the full value of a subscriber, not just the cost of acquiring one.
See which channels produce subscribers who stay. Funnel, Retention, and Revenue reports by channel. Start with 15K free attributed installs on Airbridge Core Plan.


.webp)