Marketing Analytics
6 reports that answer your biggest growth questions
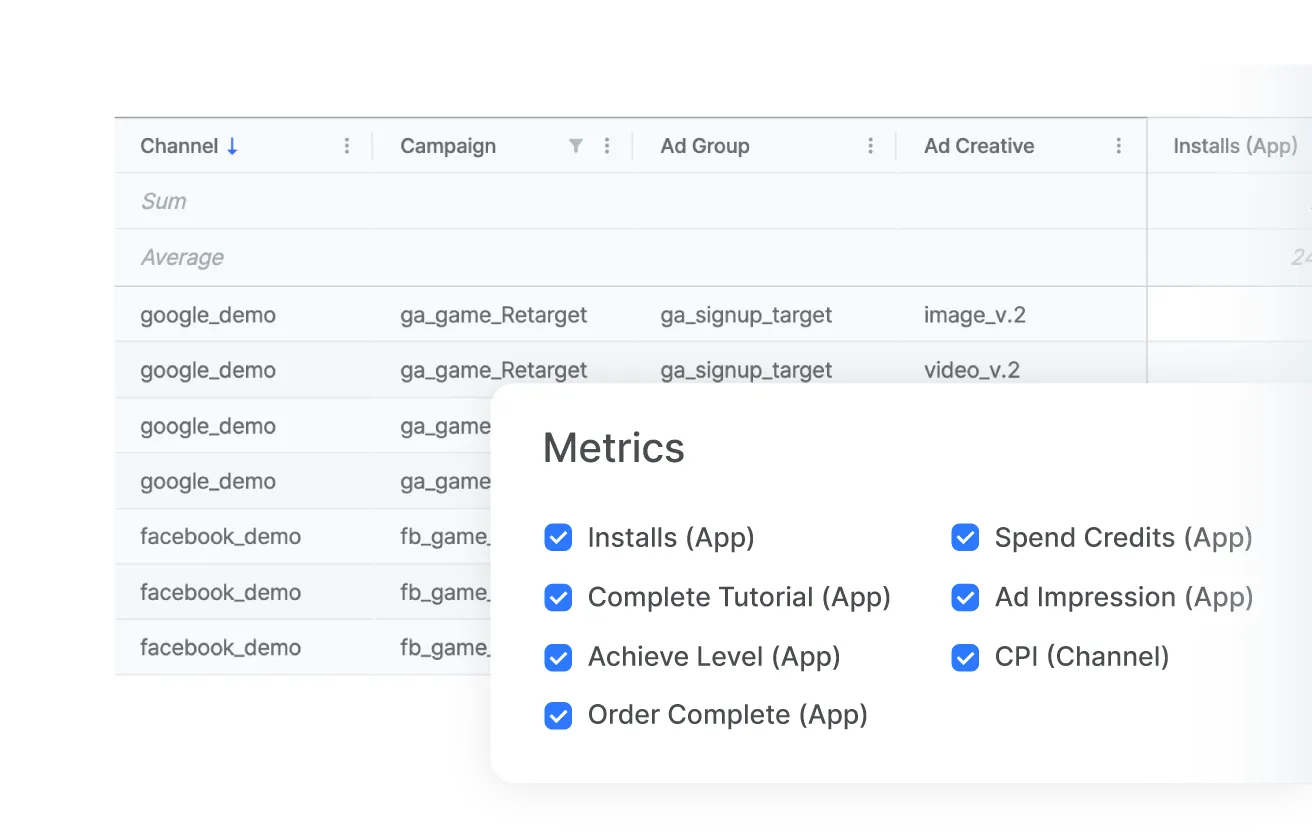
Analyze campaign performance with Actuals and hourly-refreshed funnel, revenue, and retention reports. Use pLTV for eligible install cohorts as a planning reference.
Stop guessing, start knowing
Which campaigns drive paying subscribers
— not just installs?
Monitor collected campaign events in the Actuals Report with near real-time updates; user-count metrics refresh hourly. Funnel, revenue, and retention reports refresh hourly. Channel data availability and delivery can vary.
Where do free trial users drop off?
Configure funnel steps to analyze converted users, conversion rates, drop-offs, and average conversion time. Break results down by supported acquisition dimensions. Funnel Report data refreshes hourly.
Which channels bring users who stick around?
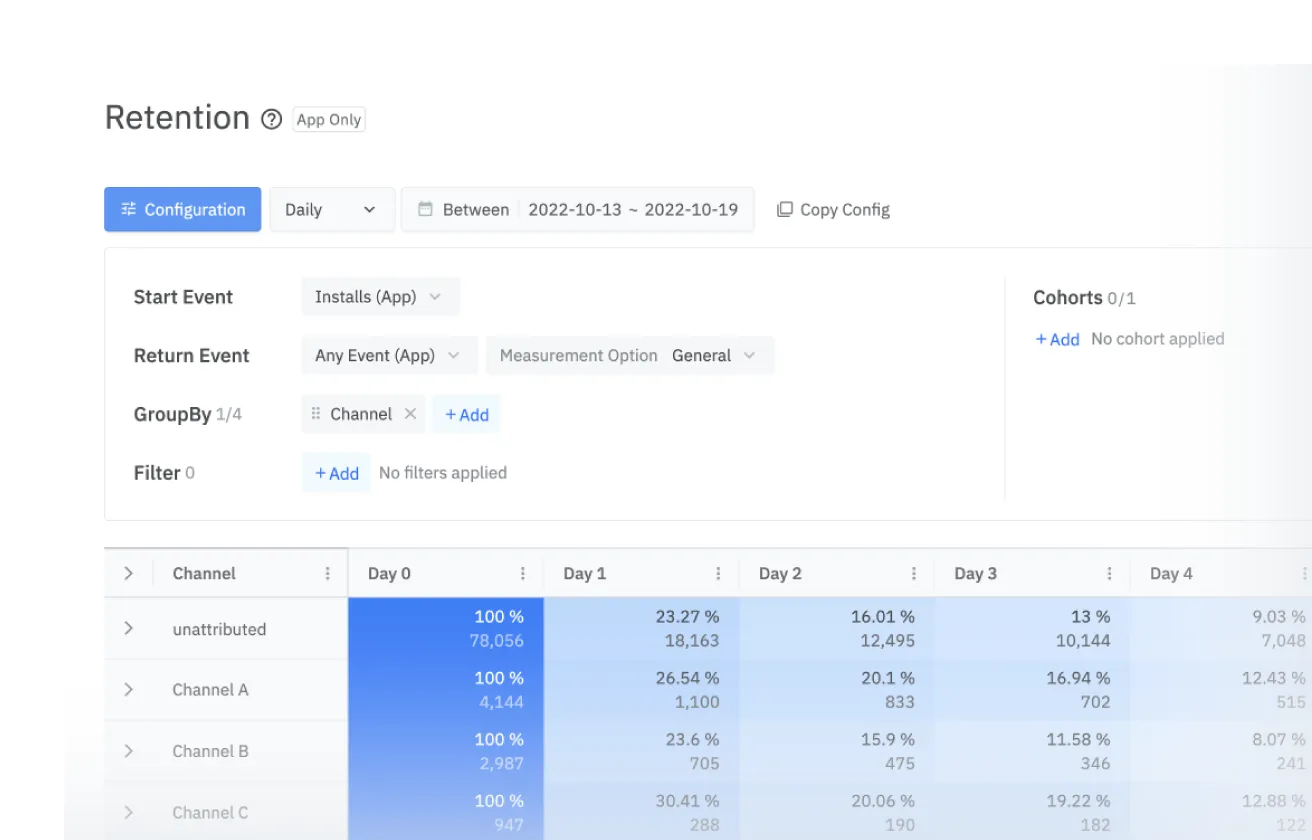
The Retention Report shows Day 1, 7, and 30 retention by campaign source. Stop spending on channels that bring users who churn in 48 hours.
Everything a subscription app needs
Analyze campaign performance with Actuals and hourly-refreshed funnel, revenue, and retention reports. Use pLTV for eligible install cohorts as a planning reference.
Actuals Report
Monitor collected campaign events in the Actuals Report with near real-time updates; user-count metrics refresh hourly. Funnel, revenue, and retention reports refresh hourly. Channel data availability and delivery can vary.
Funnel Report
Configure funnel steps to analyze converted users, conversion rates, drop-offs, and average conversion time. Break results down by supported acquisition dimensions. Funnel Report data refreshes hourly.
Retention Report
Compare cohort retention by supported channel, campaign, and country dimensions. Predictive Lifetime (pLT) estimates the average number of days users in an eligible cohort are expected to return during the selected calculation period.
Revenue Report
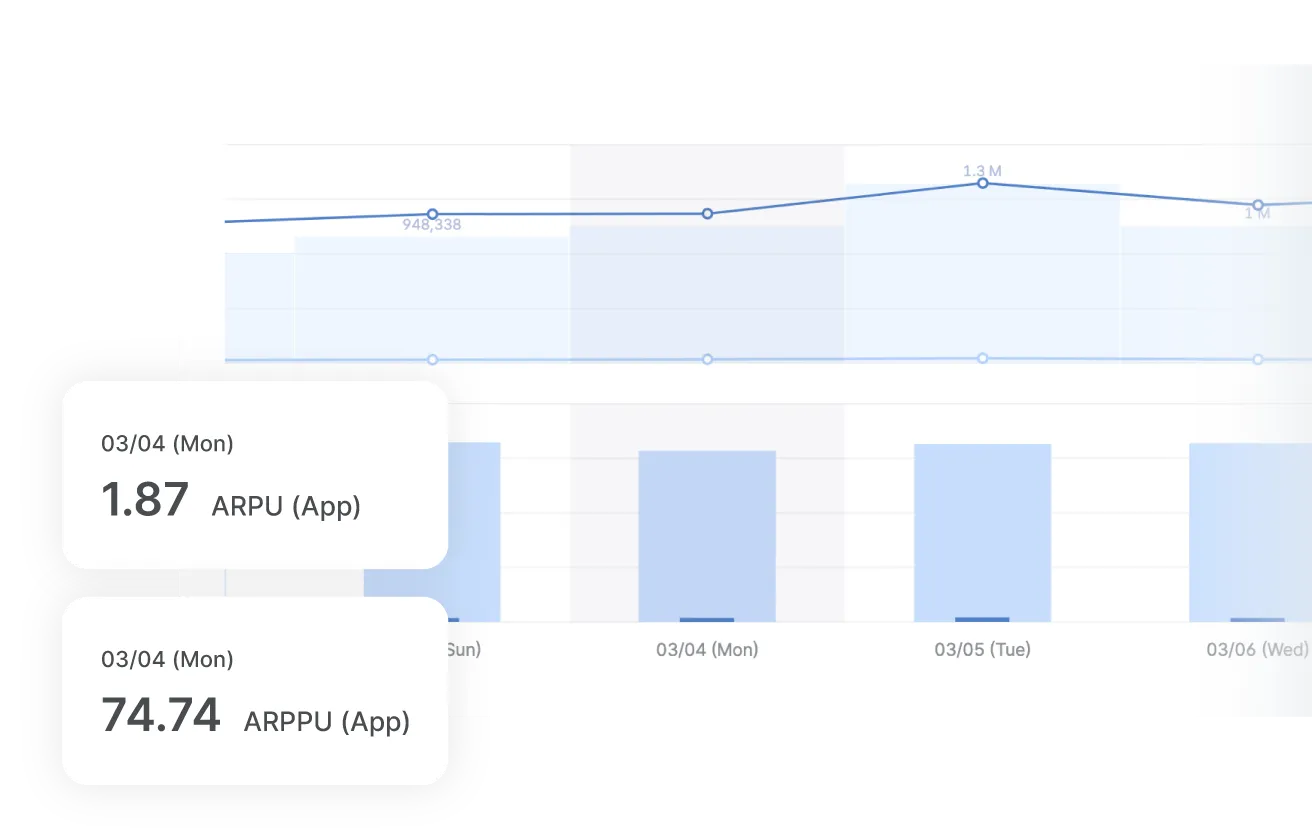
Use the Revenue Report to compare cohort revenue, ROAS, ARPU, and ARPPU by supported acquisition dimensions and calculation periods. Revenue and retention reports refresh hourly; available dimensions depend on collected data and channel permissions.
Trend Report
Spot when campaign efficiency changes before it becomes a problem. Daily trends for installs, trials, conversions, and ROAS.
Active Users Report
Monitor DAU and MAU trends across acquisition channels. See whether your paid users are actually engaging with your app.
What Our Customers Say
Strongly recommend Airbridge for any gaming apps seeking to enhance their marketing efficiency, appreciating its timely customer support and cost-effectiveness. As we continue to break new ground in the industry, Arcadian Lab remains an exemplar of how innovative approaches and data-driven insights lead to unwavering success and growth.
Other MMPs lock insights behind paywalls or make you jump through hoops to get the data you need. Airbridge doesn't. It's the only MMP where marketers can track web-to-app conversions, optimize CPI, and analyze raw data — all without paying extra. The UI is intuitive, the insights are real-time, and the resources provided actually help you grow without depending on data analysts.
Unlike other MMPs requiring purchase of add-ons to use advanced functions, Airbridge provides all functions in an all-in-one package at no additional costs. We think and feel that the solution provided by Airbridge has high merit for us since we require advanced data export functions.
Explore 6 reports
— 30-day free trial, then $40+/mo
Configure event collection, connect supported ad accounts, and validate your reports before using them for campaign decisions. Start with a 30-day free trial, then $40+/mo, with no annual contract.