

Trends & Insights
Creative Testing for Fitness Apps: Why the Winner by Installs Loses by Revenue
2026
.
3
.
16
By
Team Airbridge

You tested five creatives last week. One of them crushed it — $2.10 CPI, double the installs of the next best performer. You scaled it. You killed the $4.80 CPI creative that barely hit your install threshold.
The $2.10 creative had a 1.5% trial-to-paid conversion rate. The $4.80 creative had 9%. You just killed your best revenue driver and scaled your worst.
This is not a hypothetical. It is the default outcome when fitness app teams rank creative attribution winners by installs — which is what most teams do, because it is the only creative-level metric their tools show them.
Key Takeaways
Creative testing is the core of paid UA for fitness apps. Teams test 5-20 creatives per week across Meta, Google, and TikTok — and the winner gets the budget. The problem is how the winner is chosen.
Most teams judge creative performance by CPI because it is the fastest metric available. Within 24-48 hours, you can see which creative drives the cheapest installs. But CPI measures the cost of getting someone to download your app — not the cost of getting someone to subscribe.
Consider two fitness app creatives running on Meta:
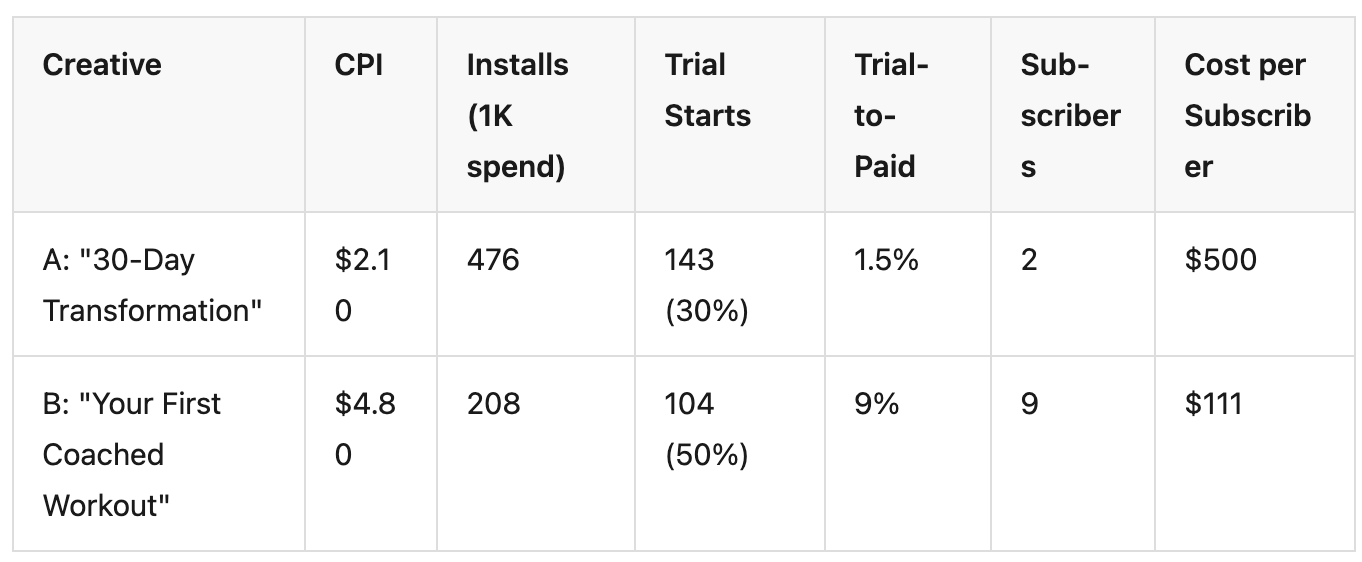
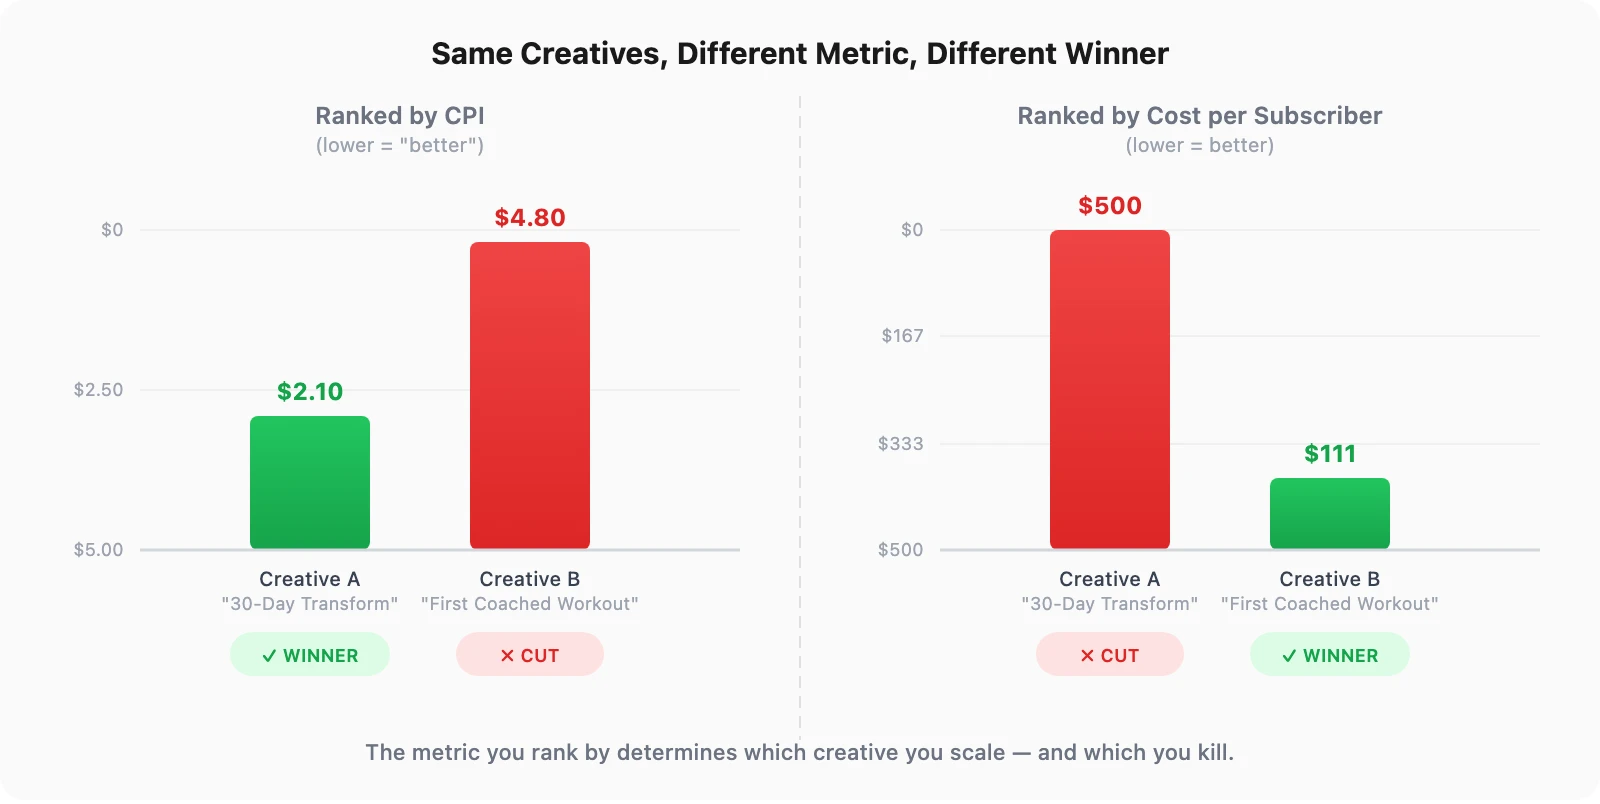
Creative A wins by CPI. Creative B wins by revenue — by a factor of 4.5x. If you kill Creative B at the 48-hour CPI check, you never see its subscription performance. The data that matters most arrives after the decision has already been made.
The gap between install intent and subscription intent is category-dependent. For a utility app, a user who installs is likely to use it. For a fitness app, a user who installs is often someone who was curious — not someone ready to commit to a $14.99/month workout plan.
RevenueCat's State of Subscription Apps report shows Health & Fitness apps have a median trial-to-paid conversion of 39.9% — but this is the median across all users. The variance by creative is where the real story lives. A transformation before/after creative attracts aspirational browsers. A structured workout preview attracts people who already exercise. Both install the app. Only one type subscribes.
Fitness app creatives that perform best by CPI tend to target the widest emotional trigger — which also attracts the least committed users. This is the CPI trap: optimizing for volume instead of value.
The creative-to-subscriber gap is not a knowledge problem — most growth marketers know CPI is incomplete. It is a tooling problem. No single tool in the typical fitness app stack connects creative IDs to subscription outcomes.
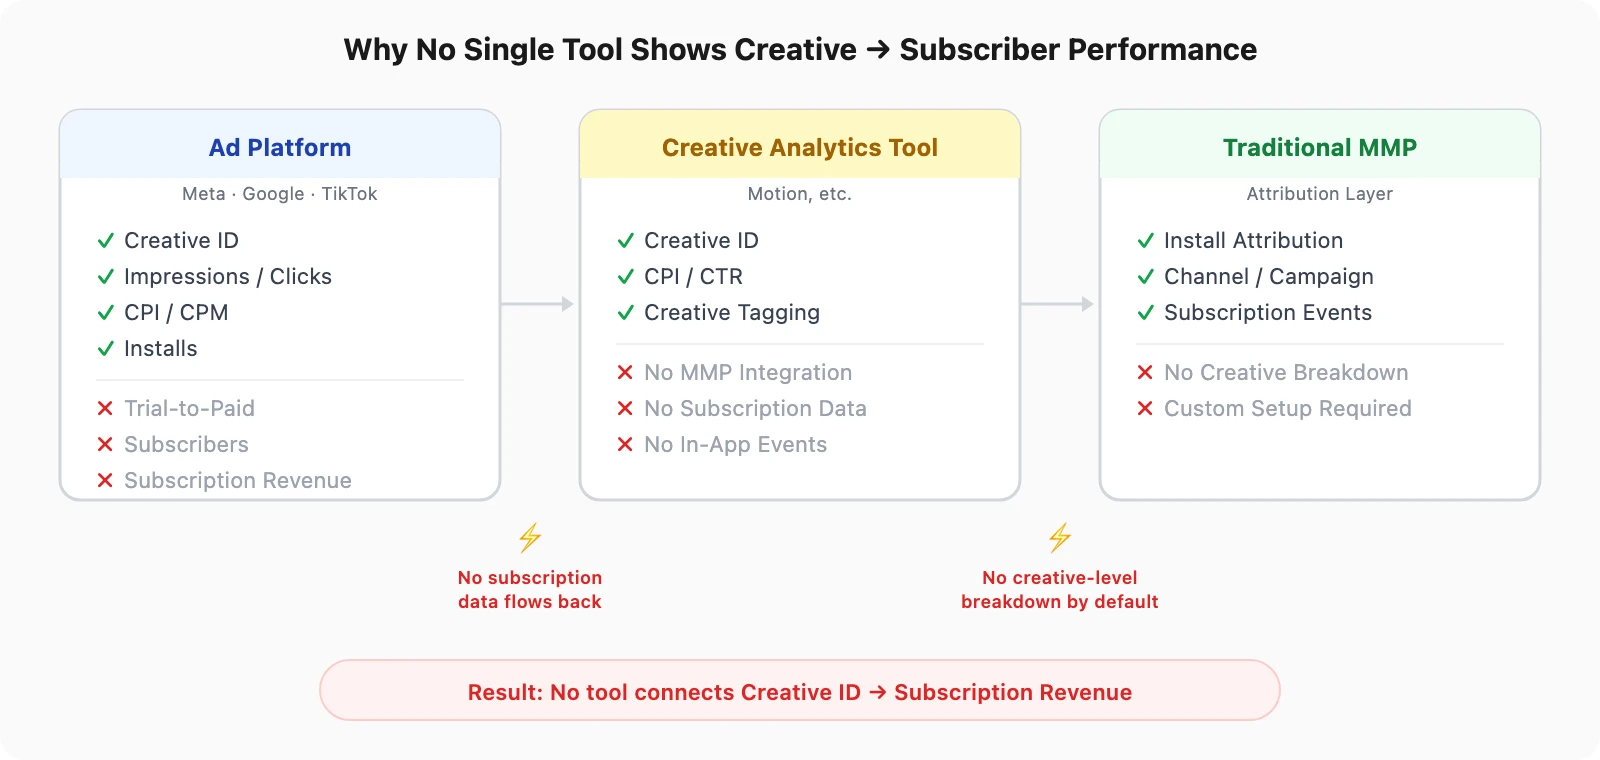
Meta, Google, and TikTok show creative-level performance — but only for metrics the platform can measure. Installs, clicks, impressions, CPM, CPI — all visible by creative. Subscription revenue, trial-to-paid conversion, renewal rates — none of these exist in the ad platform dashboard.
The ad platform knows which creative the user saw. It does not know whether that user subscribed, renewed, or churned. That data lives in RevenueCat or Adapty — a system the ad platform has no connection to.
Tools like Motion have built a category around creative analytics — testing frameworks, performance tagging, creative scoring. But Motion and similar creative analytics tools were designed primarily for e-commerce workflows. They do not integrate with MMPs — which means they cannot access in-app event data beyond what the ad platform reports.
For a fitness app, this means these tools can tell you which creative has the best CPI and CTR — the same metrics you already see in Meta Ads Manager. They cannot tell you which creative drives the most subscribers, because that data never reaches them.
Your MMP sits between the ad platform and your billing platform. It attributes installs to channels, tracks subscription events, and connects acquisition to revenue. In theory, it has everything needed to show creative-level subscription performance.
In practice, most MMP setups do not break this down by creative. Traditional MMPs require custom event schemas and manual creative ID mapping — configuration work that small fitness app teams never prioritize. The data exists somewhere in traditional MMP setups, but it is not surfaced in a way that feeds creative decisions.
Which creative is actually driving your subscribers? See creative-level subscription data — free for your first 15K attributed installs.
Fixing the creative testing loop does not require a new tool or a larger team. It requires changing the metric you rank creatives by — and connecting two systems that currently do not talk to each other.
RevenueCat's creative testing framework recommends evaluating creatives with a minimum of 10,000 impressions before making scaling decisions. But even with enough impressions, the wrong metric produces the wrong winner.
Replace CPI with Cost per Subscriber (CPS) as your primary creative ranking metric:
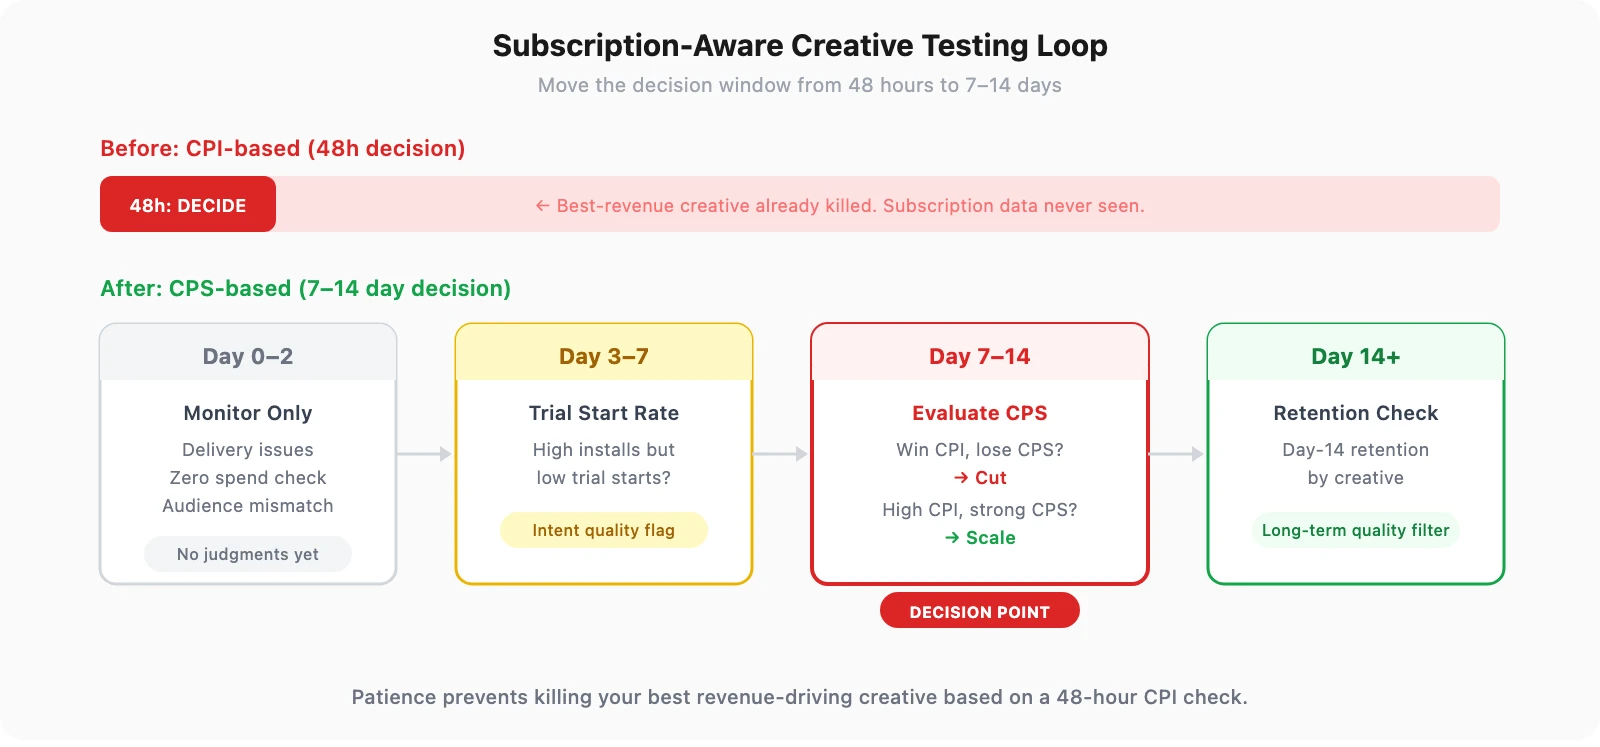
A subscription-aware creative testing loop looks different from a CPI-based one:
The key shift: the decision window moves from 48 hours to 7-14 days. This requires patience — but it prevents killing your best revenue-driving creative based on a metric that does not predict revenue.
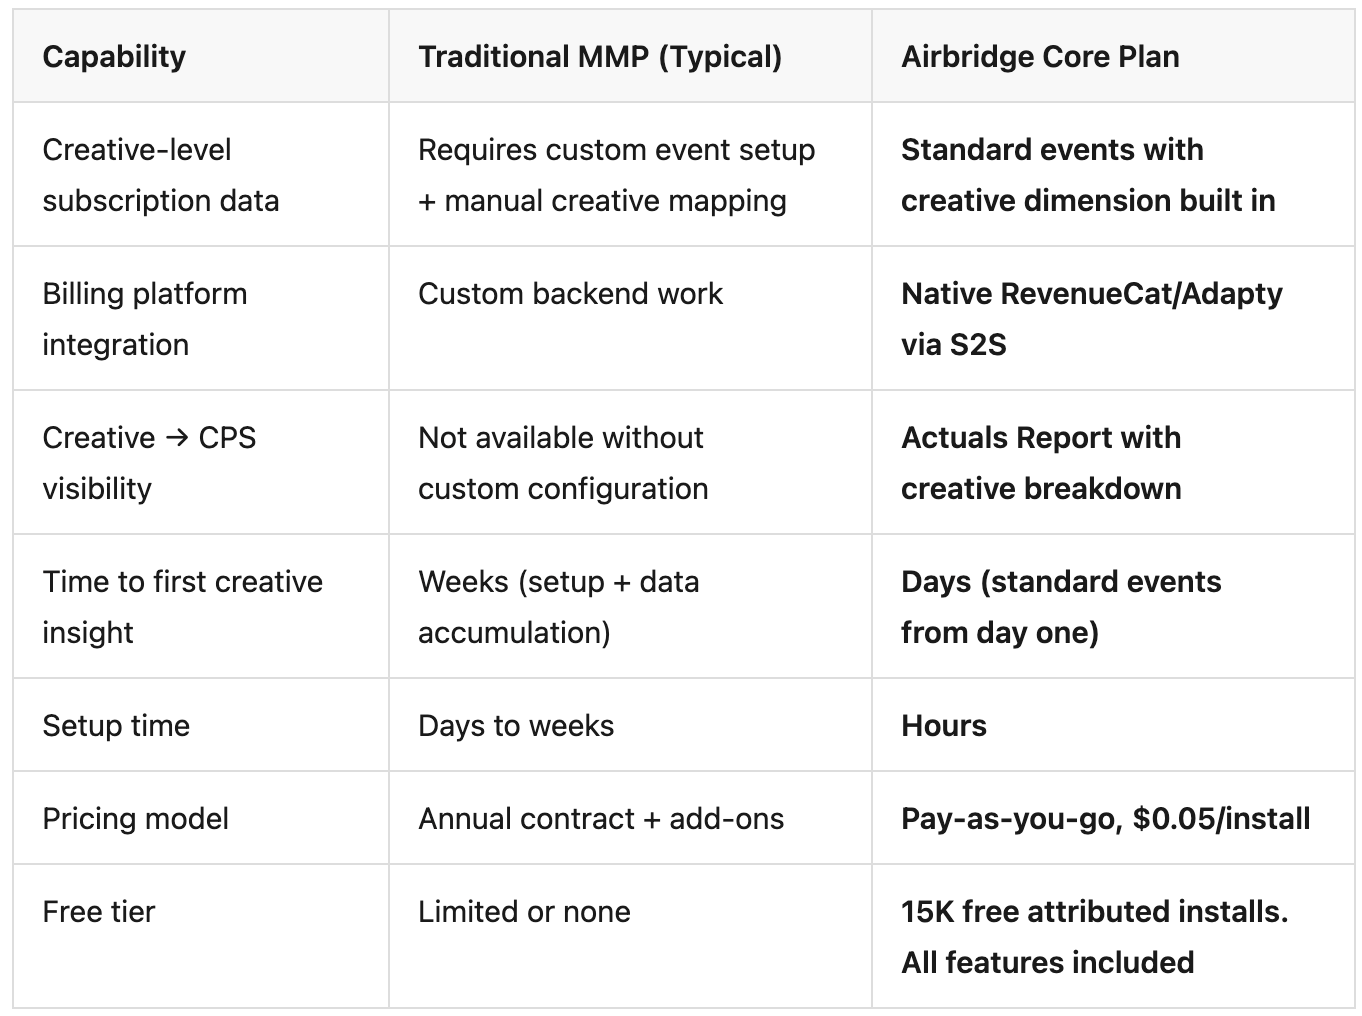
Airbridge Core Plan is an MMP built for subscription apps that connects ad platform creative IDs to subscription events — closing the gap between creative spend and subscriber value.
Core Plan provides pre-defined standard events — Start Trial, Subscribe, Unsubscribe, Order Complete, Order Cancel — with native RevenueCat and Adapty integration via server-to-server connection. The Actuals Report breaks down these subscription events by creative dimension — so you can see which creative drives trial starts, which drives subscriptions, and which drives cancellations.
The creative ID flows from the ad platform through attribution, and the subscription event flows from the billing platform through S2S — both meet in the same report.
For fitness apps, the creative that wins by installs and the creative that wins by subscriptions are rarely the same. If your creative testing loop ranks winners by CPI, you are systematically scaling the wrong creatives and killing the right ones — every single week.
The fix is not more creatives or a bigger budget. It is connecting creative performance to the metric that actually matters: subscription revenue.
Stop ranking creatives by installs. See which creative drives subscribers — start with 15K free attributed installs on Airbridge Core Plan.


.webp)
