
Lyfta Revenue & Ads
A gym workout log for lifters who track sets, reps, volume and personal records against a large exercise library.
 Hyunjong Choi
Published Oct 19, 2026Updated Oct 19, 202611 min readPricing play
Est. monthly revenue
$515K
↑ 53.3% vs prev. period
Downloads / month
412K
↑ 23.3% vs prev. period
Rating
4.8
7.0K ratings · #2 in Norway
Meta ads running
154
285 found · median 28
Lyfta revenue and downloads trend
Est. monthly revenue
$518K ↑ 70.9% in 90 days
Nov 22, 2025: $198KOct 18, 2026
Monthly downloads
414K ↑ 36.7% in 90 days
Nov 22, 2025: 198KOct 18, 2026
Daily third-party estimates, 328 days ending Oct 18, 2026. Revenue changed +162% and downloads +109% over the period. Meta ads live went from 266 to 162 between Sep 4, 2026 and Oct 18, 2026.
Lyfta Meta ads: 154 active, longest running 365 days
Top 13 by days live out of 285 found (13 video and 0 image creatives). Tap any one to open the original in the Meta Ad Library.
 #1365 days liveApp StoreAd copy“What a life saver! Try this free gym app #gym #weightlifting #lyfta #hevy #strong”Why it worksReads like a user review, What a life saver, and promises a free gym app; 365 days live.
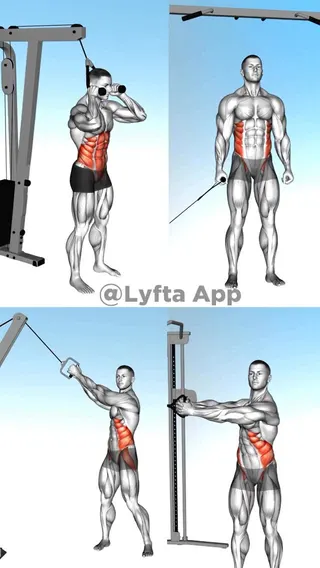
 #2357 days liveApp StoreAd copy“and it’s free”Why it worksThree words, and it's free, let the video sell; 357 days live, App Store link.
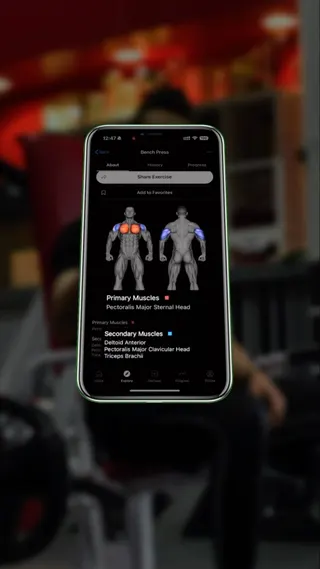 #3352 days liveGoogle PlayAd copy“Lyfta”Why it worksBrand name only, Lyfta, pointed at Google Play; 352 days live means the clip alone converts.








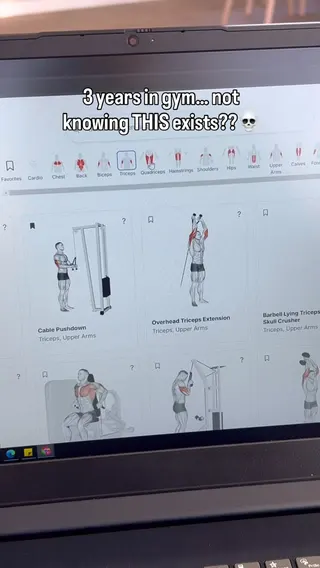
10 more Meta ads are locked
Unlock freeAds from the Meta Ad Library as of Oct 16, 2026. Store data from the App Store.
Eight Prices for One Premium Tier, Free in the Top Ads
Lyfta is a gym workout log from Lindberg Development AS, built for lifters who track sets, reps, volume and personal records against a large exercise library and ready-made programs. As of Oct 2026 it makes an estimated $515K a month on 412K downloads, 8.6x the Health & Fitness median of $60K. 10 in-app purchases map to just 2 product names, Premium Monthly and Premium Annual, spread across 8 distinct prices, with the cheapest annual at 25% of 12 months at the cheapest monthly rate.
Key takeaways
- 154 active Meta ads, 5.5x the category median of 28, and all 13 top creatives are video. The longest has run 365 days.
- 10 in-app purchases spread across 8 distinct prices, from $5.99 a month to $79.99 a year. The cheapest annual plan ($17.99) costs 25% of 12 months at the cheapest monthly rate.
- Estimated revenue rose 161.5% over 328 days, from $198K to $518K a month, while downloads rose 109.1% from 198K to 414K.
- Top chart positions sit in smaller European and Commonwealth markets: #2 in Norway, #4 Austria, #6 Sweden, #7 Canada and #10 Australia, while 22.6% of lifetime Meta spend went to the United States.
- Meta spend skews male (66.0%) and 25 to 34 (46.4%), with 18 to 24 the second group at 29.1%. Meta Ad Library spend estimates put lifetime spend at $136K, reaching 12.7M people.
Full teardown
Unlock 10 more Meta ads
Unlocked. Everything on this page is open now.
Where Lyfta spends on Meta
Audience and spend estimates built on Meta Ad Library data (reported for ads shown in the EU, with other countries modeled), lifetime of the ads found. The biggest audience is 25-34, taking 46.4% of spend.
Est. spend
$136K
Reach
12.7M
Avg. CPM
$10.71
Ads delivered
300
Spend by age
Spend by gender
Top countries by reach
| Country | Reach | Spend | Share |
|---|---|---|---|
| United States est. | 2.9M | $60,837 | 44.8% |
| France | 1.4M | $13,212 | 9.73% |
| Romania | 1.0M | $4,008 | 2.95% |
| Poland | 1.0M | $5,174 | 3.81% |
| Germany | 872.1K | $9,366 | 6.90% |
Rows marked est. are modeled from Ad Library coverage, not reported by Meta.
What Lyfta does differently
Two products, eight price tags
8 prices
across 10 in-app purchases, 2 product names
Video only, copy barely matters
13 of 13
top ads are video, 0 images
Top rank Norway, top spend US
#2 Norway
top chart rank, yet US gets 22.6% of spend
The measurement gap
154 ads
live at once, 8 price points behind them
1. Two products, eight price tags
Lyfta sells one thing, Premium, as a monthly or an annual plan, yet the US App Store lists 10 in-app purchases at 8 distinct prices. Monthly runs $5.99, $11.49 and $12.99. Annual runs $17.99, $29.99, $49.99, $59.99 and $79.99, a 4.4x spread between the cheapest and the most expensive yearly plan. At $17.99, the cheapest annual works out to 25% of 12 months at the lowest monthly price, a strong push toward the yearly commitment. A spread this wide suggests the app tests prices by region or cohort, or shows discounted offers to users who hesitate at the paywall. Lyfta keeps one product name across many prices, so the annual discount reads as a plain fraction of the monthly price.
2. Video only, copy barely matters
Every one of Lyfta's 13 top Meta ads is a video; the image count is 0. Copy does little work. 4 of the 13 carry nothing but the brand name, Lyfta or LYFTA, and all 4 of those point to Google Play. Only 2 mention the word free, and 3 use hashtags. Three variants of one review-style line, life saver, sit at ranks 1, 11 and 13, and the rank 1 version has run 365 days. This pattern says the video carries the message while the caption is a label, which fits a gym audience that scrolls short clips of exercises. For a smaller app, the lesson is to spend production time on the clip and keep the caption short. With 154 active ads and 285 found, Lyfta keeps many variants live at once instead of hunting one winner.
3. Top rank Norway, top spend US
Norway #2, Sweden #6, Austria #4, Canada #7, Australia #10: those are Lyfta's best store ranks. Meta spend tells a different story. Of an estimated $136K in lifetime Meta spend, 22.6% went to the United States, 10.7% to France, 8.13% to Romania and 7.96% to Poland. The markets where the app ranks highest do not appear in the top spend list at all, which suggests organic demand carries the top-ranked countries while paid budget hunts growth in bigger English and French speaking markets. Reach was 12.7M. Such a split is worth copying: let a high category rank in one country prove the product, then buy reach where the market is large.
4. The measurement gap
Lyfta runs 154 Meta ads at once and sells Premium at 8 different prices, so an install tells you very little. The question that matters is which creative, which store destination (9 of the top 13 link to the App Store, 4 to Google Play) and which price point produce subscribers who keep paying after the first month, not just downloads at 412K a month.
How much does Lyfta cost?
10 in-app purchases, 8 distinct prices, annual plans from $17.99 to $79.99. Prices as listed on the US App Store, Oct 16, 2026.
| Monthly | $5.99 · $11.49 · $12.99 |
|---|---|
| Annual | $17.99 · $29.99 · $49.99 · $59.99 · $79.99 |
Lyfta vs the Health & Fitness median
| Lyfta | Median | |
|---|---|---|
| Est. monthly revenue | $515K | $60K |
| Downloads / month | 412K | 20K |
| Meta ads running | 154 | 28 |
| Rating | 4.8 | 4.7 |
| Lowest annual price | $17.99 | $49.99 |
Median of 147 Health & Fitness apps with active Meta ads in our set. See the Health & Fitness hub ›
What Lyfta users say about paying
Latest 200 US reviews, Jan 23, 2025 to Oct 16, 2026
Mention price, trial or subscription
12%25 of 200 reviews, 7 of them 1 or 2 stars
This is the best free fitness app I have ever tried. I am a beginner and this app has changed the game for me. When I first started going to the gym (about 2 mo…
This app is great I’ve lost 85 lbs using it it’s just perfect no ads basic features are free for people that just want to use it to track their workouts. I’ll b…
How to measure a playbook like Lyfta's
With 154 live Meta ads, 4 of the top 13 pointing to Google Play and 8 price points, Lyfta's playbook only pays off if each ad can be tied to a paying subscriber, not an install.
- 01
Connect RevenueCat to see revenue by channel
Every purchase and renewal joins the install it came from, so each channel shows real revenue, not only installs.
- 02
Compare markets, not only campaigns
With several price points, the same campaign earns different revenue per country. Break revenue down by country and channel together.
- 03
An annual buyer and a monthly buyer look the same at install. Retention by channel shows which source keeps paying.
Measure this on your own app with Airbridge Core
From $40+/mo · 30 days free · no sales call
How we built this teardown
- Revenue and downloads are third-party app intelligence estimates as of Oct 16, 2026. Store intelligence estimates for a single app can be off by 30% or more. Treat them as a range, not a figure from the developer. Daily revenue and download series cover 328 days ending Oct 18, 2026.
- Ads come from the public Meta Ad Library. "Days live" counts days since an ad first appeared. Spend and audience breakdowns start from Meta's EU transparency figures; country splits outside the EU are modeled.
- Prices, ratings and ranks come from the App Store (US storefront) on the same date. Prices differ by country and by paywall offer. Review stats use the latest 200 US reviews from Apple's public review feed.
- Category medians are computed across 147 Health & Fitness apps with active Meta ads in our set of 860 subscription apps.
- Written by Hyunjong Choi. Ads, prices and estimates are refreshed every 30 to 90 days. Updated Oct 19, 2026.
Top Health & Fitness apps by estimated revenue
All 77 ›| # | App | Est. revenue / mo | Ads live |
|---|---|---|---|
| 1 |  StravaStrava Inc. | $15M | 330 |
| 2 |  AllTrailsAllTrails, Inc. | $6M | 166 |
| 3 |  RunnaStrava Inc. | $4M | 1,100 |
| 4 |  CalmCalm.com, Inc. | $3M | 659 |
| 5 |  Cal AIViral Development LLC | $2M | 823 |
| 29 | LyftaLindberg Development AS | $515K | 154 |
Similar apps
 TrainingPeaks
 ChillFit
 Motivation
 Gymverse
Frequently asked questions about Lyfta
How much does Lyfta make?
An estimated $515K a month as of Oct 2026, up 53.3% versus the previous period and 8.6x the Health & Fitness median of $60K. These are third-party estimates, not figures reported by Lindberg Development AS.
How much does Lyfta cost?
Lyfta Premium is sold as a subscription with 10 in-app purchases at 8 distinct prices. Monthly plans run $5.99 to $12.99 and annual plans $17.99 to $79.99 on the US App Store.
How many ads does Lyfta run?
154 active Meta ads as of Oct 2026, out of 285 found, plus 7 Apple Search Ads creatives. All 13 top ads are video and the longest has run 365 days.
How fast is Lyfta growing?
Estimated monthly revenue rose 161.5% between Nov 2025 and Oct 2026, from $198K to $518K, and downloads rose 109.1% from 198K to 414K. Over the latest 30 days revenue grew 72.3%.
Where is Lyfta most popular?
Lyfta's highest category ranks are #2 in Norway, #4 in Austria, #6 in Sweden, #7 in Canada and #10 in Australia. Its Meta spend, by contrast, goes mostly to the United States (22.6%) and France (10.7%).
Who does Lyfta advertise to?
Meta Ad Library spend estimates show Lyfta's Meta audience is 66.0% male and 46.4% aged 25 to 34, with 18 to 24 next at 29.1%. Lifetime reported spend is $136K reaching 12.7M people.
Who makes Lyfta?
Lyfta is developed by Lindberg Development AS. The app launched on the App Store on Oct 10, 2022, is 48 months old and was last updated on Oct 11, 2026.
Try Airbridge Core free (no sales call)
The install is visible, the subscriber is not. Airbridge Core closes that gap: connect Meta, TikTok, Google and Apple Ads, add one tracking link per creator, plug in RevenueCat, Superwall or Adapty, and each campaign shows revenue instead of installs. The Core plan starts at $40 a month after 30 free days. Start your free trial.
Start Core free
Hyunjong Choi LinkedIn
Go-to-market, Airbridge Core
Works on go-to-market for Airbridge Core, the self-serve attribution plan for subscription apps. Writes these teardowns from public App Store data, the Meta Ad Library and third-party estimates.
About Airbridge
Airbridge is a mobile measurement partner for Meta, Google, TikTok and Apple Ads, with native RevenueCat, Superwall and Adapty integrations. Subscription teams like NOICE cut measurement setup time by 75% after switching.