
OWNU Revenue & Ads
An iOS strength training app for women with ready made gym programs, video instructions and weight tracking.
 Hyunjong Choi
Published Oct 19, 2026Updated Oct 19, 202613 min readPaid scale
Est. monthly revenue
$50K
↑ 66.7% vs prev. period
Downloads / month
2K
↓ 1.1% vs prev. period
Rating
4.8
3.3K ratings · Health & Fitness
Meta ads running
25
175 found · median 28
OWNU revenue and downloads trend
Est. monthly revenue
$50K ↑ 66.6% in 90 days
Dec 24, 2025: $30KOct 16, 2026
Monthly downloads
1.6K ↑ 3.2% in 90 days
Dec 24, 2025: 1.6KOct 16, 2026
Daily third-party estimates, 246 days ending Oct 16, 2026. Revenue changed +67% and downloads +4% over the period. Meta ads live went from 28 to 25 between Aug 26, 2026 and Oct 18, 2026.
OWNU Meta ads: 25 active, longest running 64 days
Top 13 by days live out of 175 found (7 video and 3 image creatives). Tap any one to open the original in the Meta Ad Library.
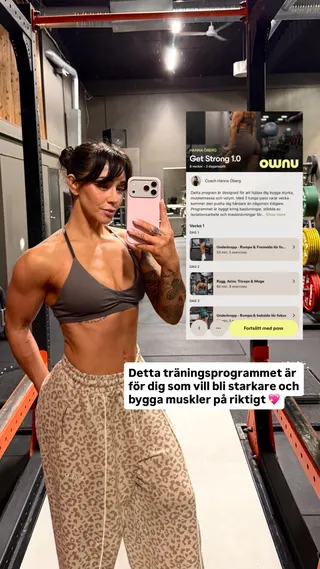 #164 days liveWeb linkAd copy“Kom igång med styrketräningen med Sveriges ledande träningsapp för kvinnor skapad av världskända PT:n Hanna Öberg - älskad av 150 000 kvinnor runt om i världen.”Why it worksStart strength training with Sweden's leading app for women, founder named; image, 64 days, web.
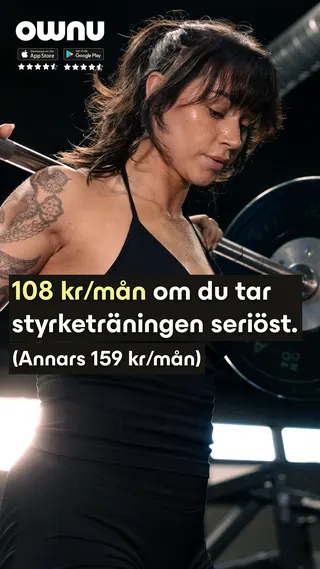
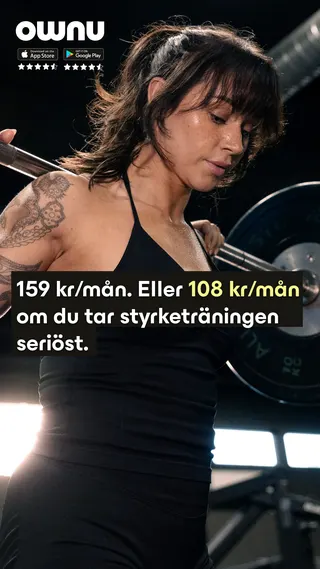
 #257 days liveWeb linkAd copy“Sveriges ledande styrketräningsapp för kvinnor från 108 kr/månaden. Välj mellan 30+ träningsprogram, lär dig övningarna med videoinstruktioner, följ din utveckling med vikt- och repsloggning och laga hälsosam mat med hjälp av 500+ recept. Testa 7 dagar gratis. Du kan använda ditt friskvårdsbidrag. OWNU finns bl.a. på Benifex, Epassi, Benefits och Edenred. 4.8 av 5 ⭐⭐⭐⭐⭐ på App Store.”Why it worksLeading strength app for women, 7 days free, wellness allowance accepted; video, 57 days, web.Text ad#355 days liveWeb linkAd copy“Sveriges ledande styrketräningsapp för kvinnor från 108 kr/månaden. Välj mellan 30+ träningsprogram, lär dig övningarna med videoinstruktioner, följ din utveckling med vikt- och repsloggning och laga hälsosam mat med hjälp av 500+ recept. Testa 7 dagar gratis. Du kan använda ditt friskvårdsbidrag. OWNU finns bl.a. på Benifex, Epassi, Benefits och Edenred. 4.8 av 5 ⭐⭐⭐⭐⭐ på App Store.”Why it worksSame wellness allowance and programs pitch as text, 55 days, web link.






10 more Meta ads are locked
Unlock freeAds from the Meta Ad Library as of Oct 16, 2026. Store data from the App Store.
Swedish Strength Training Paid For by Employer Wellness Budgets
OWNU is a strength training app for women from Oberg Fitness AB with structured gym programs, video instructions and rep and weight logs. As of Oct 2026 it makes an estimated $50K a month on only 2K downloads, or $25.0 per download. Its Swedish Meta ads tell women they can pay with the wellness allowance their employer gives them.
Key takeaways
- Revenue per download is $25.0, and revenue is up 66.7% versus the previous period while downloads are -1.1%.
- OWNU runs 25 active Meta ads, 0.9x the Health & Fitness median of 28, and all 13 top ads link to the web.
- The Swedish copy calls it Sweden's leading strength app for women, offers 7 days free, and lists employer benefit platforms that cover it.
- Prices are listed as in-app purchases: $17.99 a month, $45.99 a quarter, and $107.99 or $139.99 a year.
- Meta Ad Library spend estimates put 98.5% of spend on women, with Sweden at 64.5% and the United States at 34.9%.
Full teardown
Unlock 10 more Meta ads
Unlocked. Everything on this page is open now.
Where OWNU spends on Meta
Audience and spend estimates built on Meta Ad Library data (reported for ads shown in the EU, with other countries modeled), lifetime of the ads found. The biggest audience is 25-34, taking 42.8% of spend.
Est. spend
$2K
Reach
193.9K
Avg. CPM
$12.17
Ads delivered
175
Spend by age
Spend by gender
Top countries by reach
| Country | Reach | Spend | Share |
|---|---|---|---|
| Sweden | 153.9K | $1,522 | 64.5% |
| United States est. | 38.8K | $823.90 | 34.9% |
| Finland | 525 | $4.72 | 0.20% |
| United Kingdom | 393 | $5.21 | 0.22% |
| Denmark | 157 | $1.49 | 0.06% |
Rows marked est. are modeled from Ad Library coverage, not reported by Meta.
What OWNU does differently
Employer money as the hook
13 of 13
top Meta ads link to the web
Premium plans for a loyal base
50%
cheapest year versus 12 months at $17.99
Women in Sweden, then the US
98.5%
of estimated Meta spend aimed at women
The measurement gap
25.0
dollars of revenue per download
1. Employer money as the hook
OWNU's top Meta ads, mostly in Swedish, sell more than a workout app. The lead copy says Sweden's leading strength training app for women, choose from programs, learn with video, log weights and reps, try 7 days free, and use your wellness allowance. It then names benefit platforms such as Benifex, Epassi and Edenred where OWNU is available. Swedish employers give staff a tax free wellness budget, so the buyer is spending money that is not really her own. Other lines ask, do you train but see no results, it was the same for me. All 13 link to the web, where benefit payments can work. For OWNU, every benefit platform named in an ad is a second way to pay, and it makes a premium price feel smaller to the buyer.
2. Premium plans for a loyal base
Third-party data does not confirm a subscription, so read the 4 in-app purchases as listed: $17.99 a month, $45.99 a quarter, and $107.99 or $139.99 a year, a 1.3x spread. The cheapest year is 50% of twelve $17.99 months, and both years sit far above the $49.99 category median. A price that high works because the buyer is committed: the latest 200 reviews average 4.38, with 145 five-star, and only 22 mention price or subscription, 6 of them negative. Users describe years of use, starting postpartum, and call it the most complete trainer app they have tried. Revenue per download is $25.0. A smaller app with a trusted coach can price high if the program delivers visible strength gains.
3. Women in Sweden, then the US
Meta Ad Library spend estimates show $2K of lifetime spend reaching 193.9K people. Women get 98.5% of spend and men 0.82%. Modeled country rows give Sweden 64.5% of spend and the United States 34.9%. The 25 to 34 group takes 42.8% and 35 to 44 takes 33.3%. Sweden is the home market, where benefit payments and a well known founder do the most work, while the US budget tests a larger, pricier audience. Active Meta ads peaked at 37 on Sep 7, 2026 and sit at 25. So the US share reads as a test budget, while the Swedish base, where benefit payments work, still carries the business.
4. The measurement gap
OWNU earns $25.0 per download from women in Sweden and the United States, and many pay through employer benefit platforms on the web. A benefit payment never shows up as an App Store purchase. The question is which ad and which country bring a member who stays for a second year.
How much does OWNU cost?
4 in-app purchases, 4 distinct prices, annual plans from $107.99 to $139.99. Prices as listed on the US App Store, Oct 16, 2026.
| Monthly | $17.99 |
|---|---|
| Quarterly | $45.99 |
| Annual | $107.99 · $139.99 |
OWNU vs the Health & Fitness median
| OWNU | Median | |
|---|---|---|
| Est. monthly revenue | $50K | $60K |
| Downloads / month | 2K | 20K |
| Meta ads running | 25 | 28 |
| Rating | 4.8 | 4.7 |
| Lowest annual price | $107.99 | $49.99 |
Median of 147 Health & Fitness apps with active Meta ads in our set. See the Health & Fitness hub ›
What OWNU users say about paying
Of the latest 200 reviews, 22 (11.0%) mention price, trial or subscription and 6 of those are negative. Most praise the programs, and the sample averages 4.38.
Latest 200 US reviews, Jun 16, 2023 to Aug 31, 2026
Mention price, trial or subscription
11%22 of 200 reviews, 6 of them 1 or 2 stars
I love this app and Hanna and Joanna. I started using it 3 years ago when I was postpartum with my first baby. This platform has made me more focused and strong…
I have tried at least 5 different fitness influencer apps, and I think Own U is the most comprehensive and realistic. I have felt my strongest performing the ex…
How to measure a playbook like OWNU's
With 13 of 13 top Meta ads sending women to the web and payments through employer benefit platforms, OWNU has to connect each payment to the ad that earned it.
- 01
Connect Meta and see cost next to results
Spend, installs and in-app events land in one report by campaign, so channels get compared on the same numbers.
- 02
Send trial and purchase events back to Meta
Core sends mobile postbacks to Meta and three other channels, so the algorithm can optimize for payers instead of cheap installs. Growth adds more channels.
- 03
Connect RevenueCat for revenue by campaign
Subscription revenue joins the install data, so each campaign shows return on ad spend, not only cost per install.
Measure this on your own app with Airbridge Core
From $40+/mo · 30 days free · no sales call
How we built this teardown
- Revenue and downloads are third-party app intelligence estimates as of Oct 16, 2026. Store intelligence estimates for a single app can be off by 30% or more. Treat them as a range, not a figure from the developer. Daily revenue and download series cover 246 days ending Oct 16, 2026.
- Ads come from the public Meta Ad Library. "Days live" counts days since an ad first appeared. Spend and audience breakdowns start from Meta's EU transparency figures; country splits outside the EU are modeled.
- Prices, ratings and ranks come from the App Store (US storefront) on the same date. Prices differ by country and by paywall offer. Review stats use the latest 200 US reviews from Apple's public review feed.
- Category medians are computed across 147 Health & Fitness apps with active Meta ads in our set of 860 subscription apps.
- Written by Hyunjong Choi. Ads, prices and estimates are refreshed every 30 to 90 days. Updated Oct 19, 2026.
Top Health & Fitness apps by estimated revenue
All 77 ›| # | App | Est. revenue / mo | Ads live |
|---|---|---|---|
| 1 |  StravaStrava Inc. | $15M | 330 |
| 2 |  AllTrailsAllTrails, Inc. | $6M | 166 |
| 3 |  RunnaStrava Inc. | $4M | 1,100 |
| 4 |  CalmCalm.com, Inc. | $3M | 659 |
| 5 |  Cal AIViral Development LLC | $2M | 823 |
| 111 | OWNUOberg Fitness AB | $50K | 25 |
Similar apps
 Nutrition Coach
 SHREDDY
 StrengthLog
 WeGLOW
Frequently asked questions about OWNU
How much does OWNU make?
OWNU makes an estimated $50K a month as of Oct 2026, 0.8x the Health & Fitness median of $60K. These are third-party estimates, not figures reported by Oberg Fitness AB.
How much does OWNU cost?
OWNU lists in-app purchases on the US App Store at $17.99 a month, $45.99 a quarter, and $107.99 or $139.99 a year.
How many ads does OWNU run?
OWNU runs 25 active Meta ads, out of 175 found, which is 0.9x the category median of 28. It also has 10 Apple Search Ads creatives.
Who does OWNU advertise to?
Meta Ad Library spend estimates put 98.5% of spend on women, with 64.5% in Sweden and 34.9% in the United States.
How fast is OWNU growing?
Revenue is up 66.7% and downloads are -1.1% versus the previous period.
Who makes OWNU?
Oberg Fitness AB publishes OWNU. It launched on Oct 26, 2020 and holds a 4.8 rating from 3.3K reviews.
Try Airbridge Core free (no sales call)
The install is visible, the subscriber is not. Airbridge Core closes that gap: connect Meta, TikTok, Google and Apple Ads, add one tracking link per creator, plug in RevenueCat, Superwall or Adapty, and each campaign shows revenue instead of installs. The Core plan starts at $40 a month after 30 free days. Start your free trial.
Start Core free
Hyunjong Choi LinkedIn
Go-to-market, Airbridge Core
Works on go-to-market for Airbridge Core, the self-serve attribution plan for subscription apps. Writes these teardowns from public App Store data, the Meta Ad Library and third-party estimates.
About Airbridge
Airbridge is a mobile measurement partner for Meta, Google, TikTok and Apple Ads, with native RevenueCat, Superwall and Adapty integrations. Subscription teams like NOICE cut measurement setup time by 75% after switching.