Installs Up, MRR Flat: Two Questions That Find Where the Money Leaks

On this page
Why are installs up but revenue flat?
When installs go up but revenue stays flat, ask two questions before you change anything: where did the new installs come from, and where in the app do they stop? The first question points to your channel mix. The second points to onboarding, the paywall or the payment step. Most "installs up, MRR flat" weeks come down to one of those two, and the fixes are very different.
Tools that do this
-
Free: App Store Connect Sources and Play Console acquisition reports for where installs came from; your subscription platform for trials and revenue; your analytics tool for the steps in between.
-
One view by channel, through to paid: an MMP. Airbridge Core ties installs, trials and renewals from RevenueCat, Adapty or Superwall to each channel and campaign. Try it free for 30 days, then from $40 per month.
Founders ask this in public every week. A recent build-in-public update read "+169 installs, MRR flat", and the best reply asked exactly the first question: "Do you know where those installs came from? Store search vs a post that blew up can look identical in installs and be totally different in who actually upgrades." Another reply asked the second: "Is the gap at activation or at the paywall?"
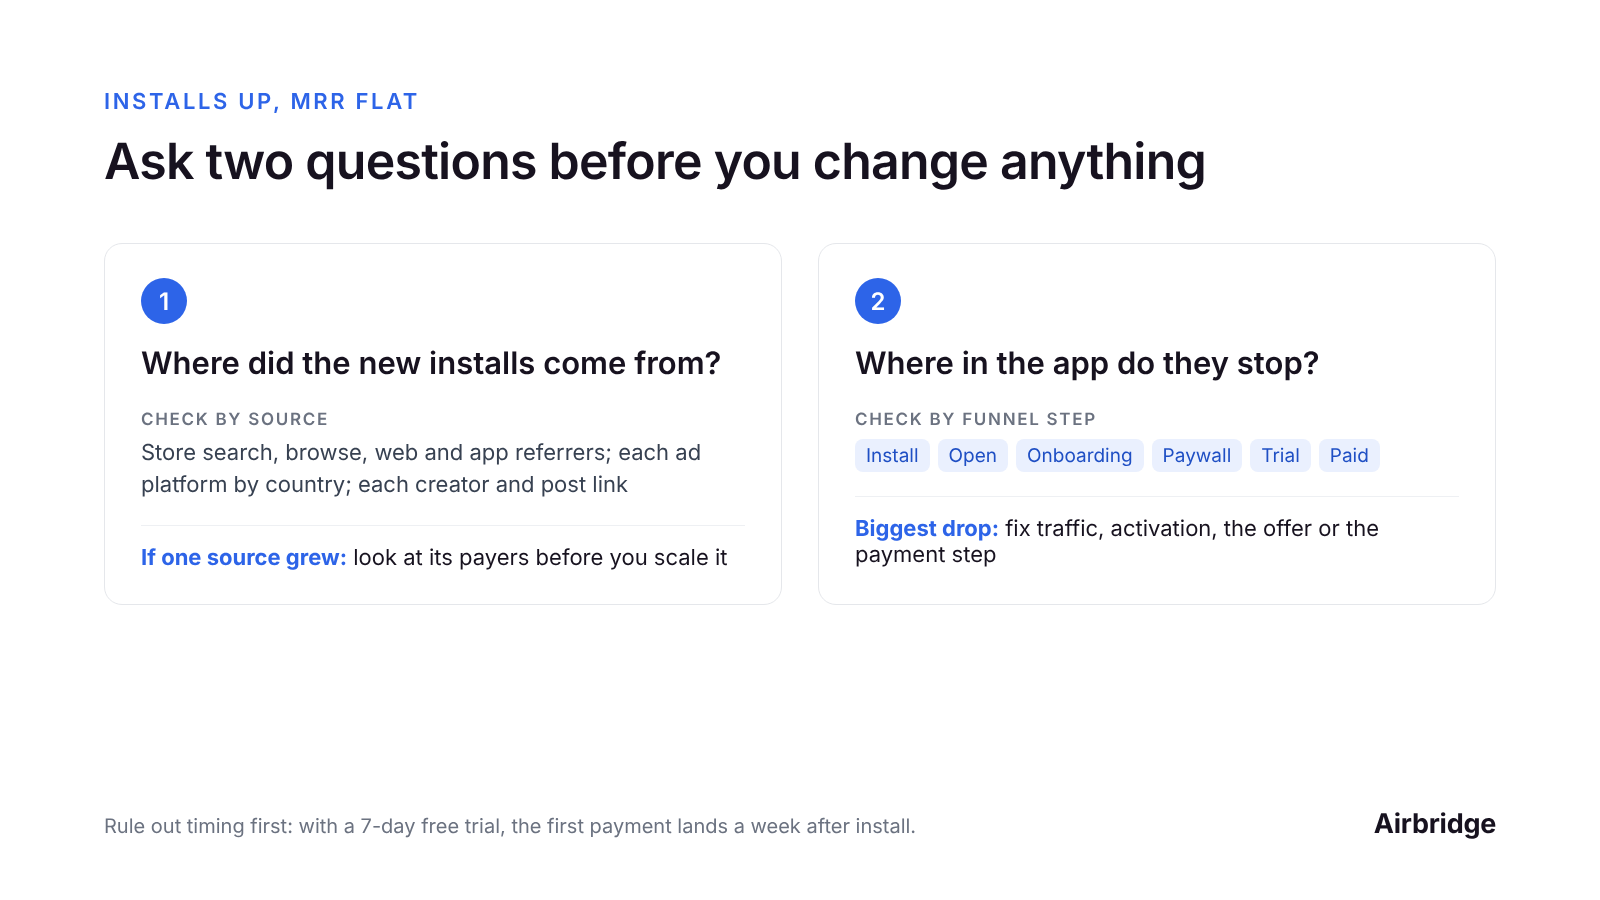
Answer the source question first, then the funnel question. Each one points to a different fix.
Before you start: is it really flat, or just late?
Rule out timing first. With a 7-day free trial, a new user's first payment lands a week after install, so a spike in installs shows up in revenue a week later at the earliest. An annual plan adds only one twelfth of its price to MRR. Compare installs from two weeks ago with trials and payments from those same users today, not this week's installs with this week's MRR.
Question 1: Where did the new installs come from?
A jump in installs is a change in who arrived. Find out which source grew.
-
App Store Connect, Sources. Compare App Store Search, App Store Browse, Web Referrer and App Referrer week over week. Apple attributes sales, usage and subscription data to the download source, and you can view monthly recurring revenue by source type, so you can see whether the source that grew also brings revenue. Note that taps from Chrome and other non-Safari browsers on iOS count as App Referrer.
-
Play Console, Store performance for the same view on Android: store listing acquisitions split by Google Play search, Google Play explore, and ads and referrals, with the UTM campaign of your Play links.
-
Your ad dashboards, by country and placement. One founder who ran install ads for nine days found that on the first day "~99% of clicks came from two countries" and that most of those installs never opened the app. Cheap installs from an audience you didn't mean to reach can lift the install line on their own.
-
Your campaign links. If each creator and post has its own link, you can see which one drove the spike. If they all point to the same store page, a viral post and a search spike look the same.
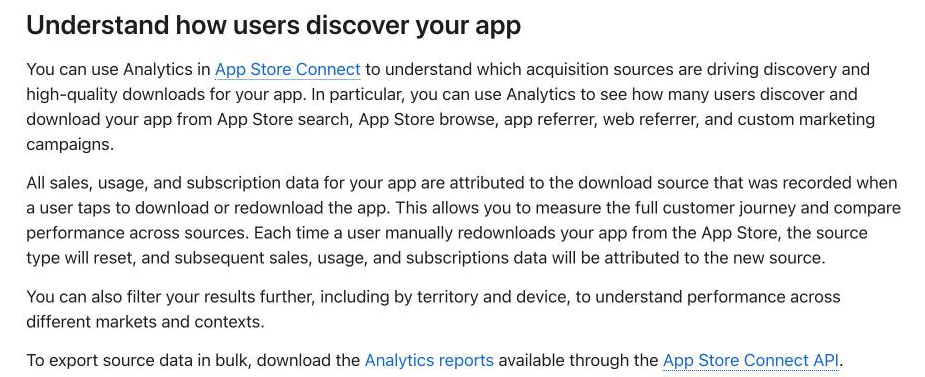
App Store Connect attributes sales, usage and subscription data to the source of each download: App Store search, App Store browse, app referrer, web referrer or a campaign. Source: App Store Connect Help
If one source grew and the others didn't, you have your suspect. Next, check whether that source's users behave differently inside the app.
Question 2: Is the gap at activation or at the paywall?
Lay out the funnel for the new users, step by step, and look for the biggest drop.
| Step | What a big drop here usually means |
|---|---|
| Install → first open | Traffic quality: wrong country, accidental taps, or a placement that sends curious clickers |
| First open → finished onboarding | Activation: the first minutes don't deliver what the ad or post promised |
| Onboarding → saw the paywall | Flow: users leave before the paywall ever shows |
| Saw paywall → started trial | Offer: price, plan layout or paywall type (hard vs soft paywalls) |
| Tapped buy → completed purchase | Payment: store or billing errors, declined cards, a plan that isn't available in that country |
| Trial → paid | Trial experience, or cancellations during the trial |
Here is a real funnel a founder shared publicly for an Android game with a Pro plan: 1,726 installs, about 40% opened the app, 449 saw the paywall, 6 tapped buy, and 0 completed a purchase. Two drops stand out. Most installs never opened the app, which is a traffic question. And six people tried to pay and none finished, which is a payment question worth checking in Play Console's order management (it lists each order and its status) before touching the paywall.
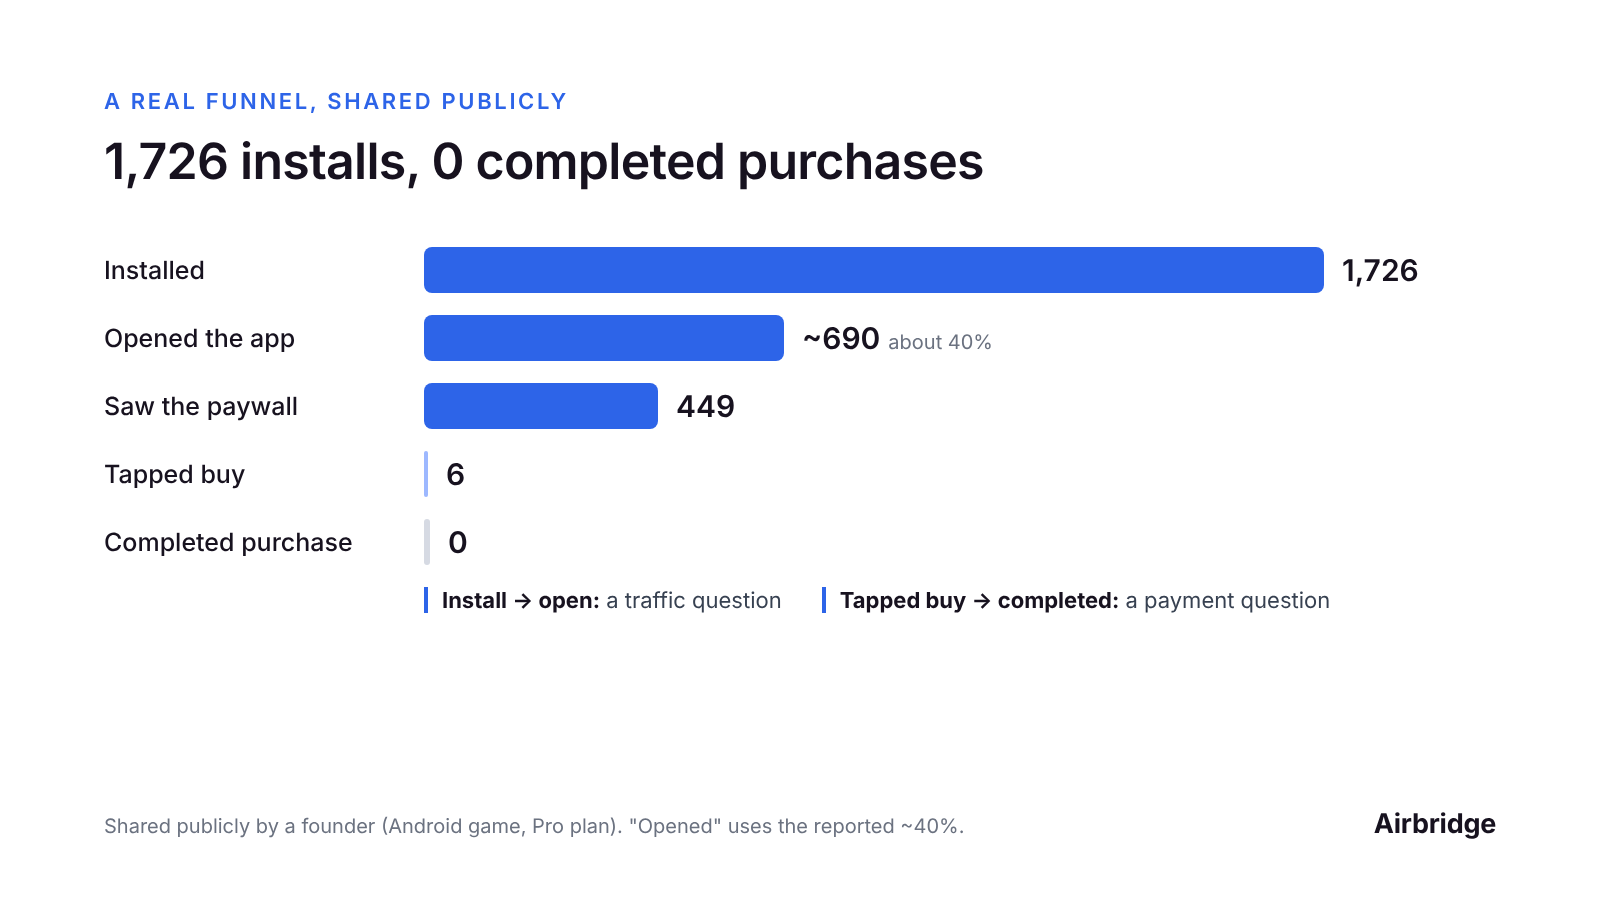
A funnel a founder shared publicly: most installs never opened the app, and the six people who tapped buy didn't complete a purchase.
Want to see how Installs up but revenue flat works with your data?
Get hands-on with Airbridge and see real results.
Try It Free →What happens when you split the funnel by source?
The answer is usually clearest when you split the funnel by source. The example below is illustrative.
| Source | Installs | Opened | Saw paywall | Started trial | Paid after trial |
|---|---|---|---|---|---|
| App Store Search | 300 | 270 | 200 | 30 | 12 |
| A post that went viral | 300 | 180 | 90 | 9 | 2 |
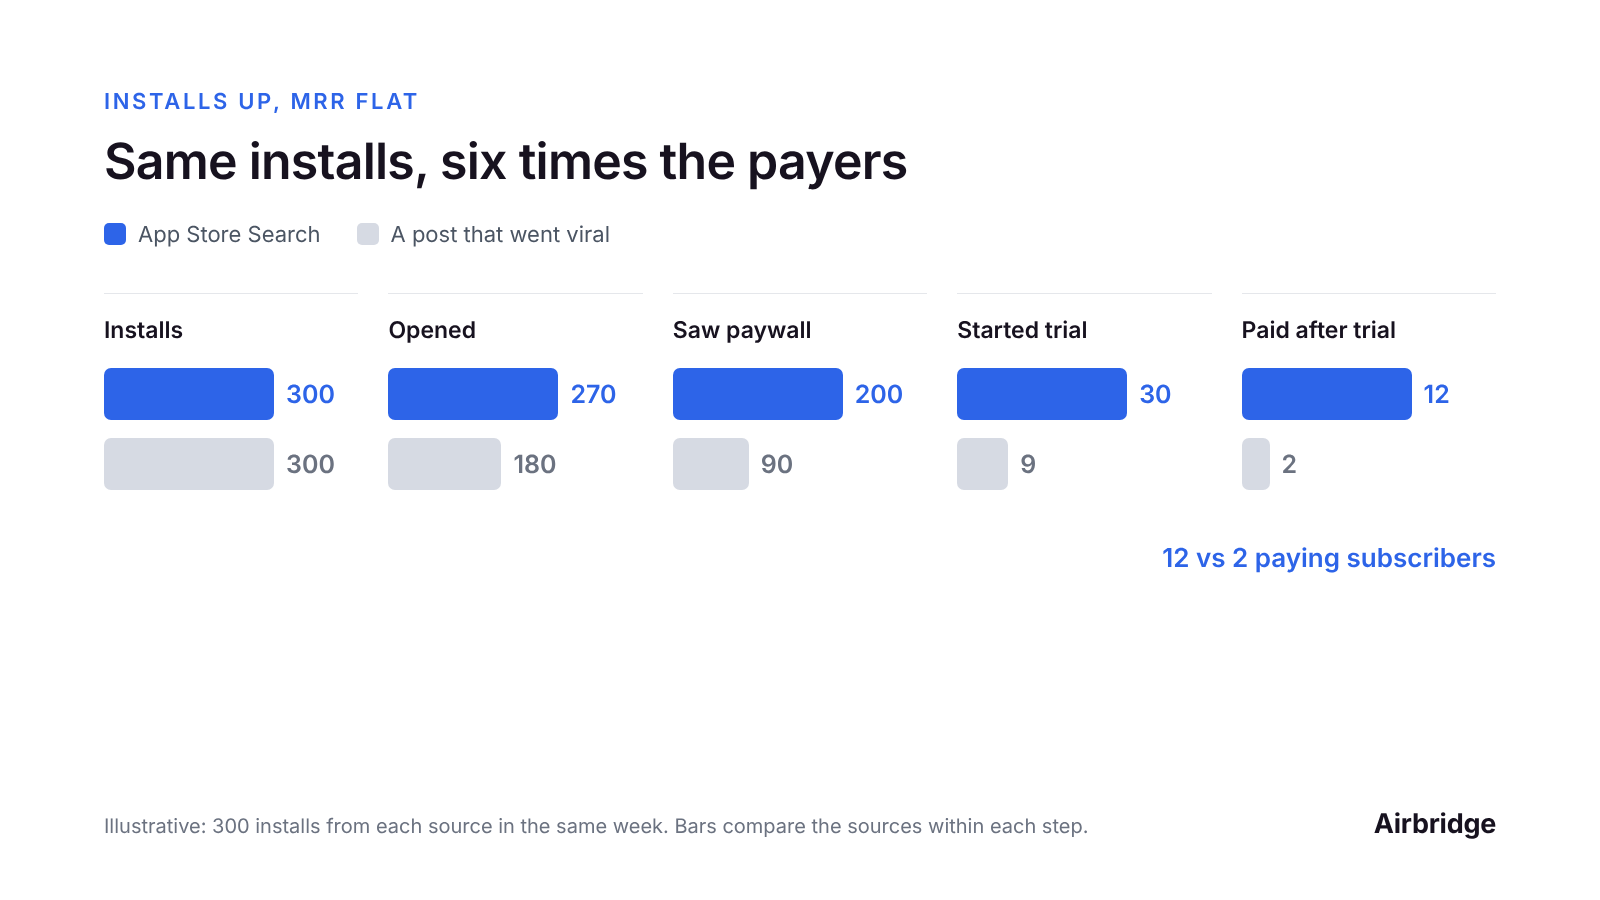
Illustrative example: the same number of installs from two sources can bring very different numbers of payers.
Same installs, six times the payers. If the viral post drove this week's jump, MRR stays flat even though nothing in your app got worse. The fix is not a new paywall. It's knowing which sources bring payers, so you can do more of those and judge the next spike faster. If the two sources had matched until the paywall and only then split, the fix would sit in the offer, not the channel.
What to do this week
-
Line up the dates: installs from two weeks ago against trials and payments from those users today.
-
Find the source that grew in App Store Connect Sources or Play Console, then in each ad dashboard by country.
-
Build the funnel for that source: install, open, onboarding, paywall, trial, paid.
-
Fix the biggest drop first. Traffic drops call for targeting changes; activation and paywall drops call for product changes.
-
Give every creator, post and campaign its own link so the next spike tells you where it came from on day one.
-
Make sure your conversion counts mean the same thing. If an ad platform reports 20 conversions and your subscription platform shows 2 new subscribers, they are probably counting different events; see why ad platforms and subscription data disagree.
Common questions
Why are my installs increasing but revenue isn't?
Usually because the new installs came from a source whose users don't reach the paywall or don't pay, or because revenue simply hasn't caught up yet: with a 7-day trial, payments land a week after install.
Can App Store Connect show which source brings subscribers?
Partly. App Store Connect attributes sales and subscription data to the source of the download (App Store Search, App Store Browse, Web Referrer, App Referrer) and lets you view MRR by source type. It doesn't split by ad network, campaign or creator, and redownloads reset the source.
Should I cut the channel with the cheapest installs?
Not before you check its payers. Cheap installs are a problem only when they don't open, start trials or pay. Compare cost per paying user, not cost per install. We cover the setup in optimizing for trial starts, not installs.
How do I know if the problem is activation or the paywall?
Track how many new users reach the paywall. If most never see it, the gap is activation or flow. If they see it and don't start a trial, the gap is the offer. If they tap buy and don't finish, check payment errors first.
The bottom line
"Installs up, MRR flat" is two questions, not one: who came in, and where they stopped. Answer the first by source, the second by funnel step, and the fix usually becomes obvious. The hard part is doing it every week, across every channel, creator and campaign at once.
That is what Airbridge does for subscription apps. It connects with RevenueCat, Adapty and Superwall and ties every install, trial, payment and renewal to the channel, campaign or creator that drove it, so a spike tells you where it came from on the day it happens. The Core Plan is built for subscription apps: try it free for 30 days, then from $40 per month.

Ready to transform your mobile growth?
Learn how Airbridge helps leading brands measure and optimize every touchpoint.
“While working with Airbridge, we have learned that MMM is a crucial attribution model for post-privacy era marketing to predict future performance and optimize the budget.”