One Number per Subscriber: Choosing a Source of Truth When Your Tools Disagree

On this page
Why don't my app revenue numbers match?
Because each tool answers a different question with different rules. App Store Connect shows estimates in its own timezone and currency rules; your subscription platform counts renewals and refunds as they happen; analytics counts behavior; each ad platform counts the conversions it can attribute to itself. None of them is wrong. The fix is to pick one source of truth for each question, write the rules down, and stop adding numbers from different tools together.
Tools that do this
-
Free: a shared sheet that names the source for each metric, plus a monthly check against store payouts.
-
Acquisition numbers counted by one rule for every channel: an MMP. Airbridge Core ties trials and renewals from RevenueCat, Adapty or Superwall to the campaign that drove them, next to spend synced from Meta, Google, Apple Ads and TikTok. Try it free for 30 days, then from $40 per month.
Why does the same week show five different numbers?
1. Timezones. Apple's Sales and Trends shows data in UTC by default; downloaded reports use Pacific Time. Your subscription platform and analytics may each use your account's timezone. A purchase at 11 p.m. lands on different days.
2. Currency. Apple's Sales and Trends "estimates the USD amount of sales and proceeds on the App Store, based on a rolling average of the previous month's exchange rates." Other tools convert on the day of the transaction, or not at all.
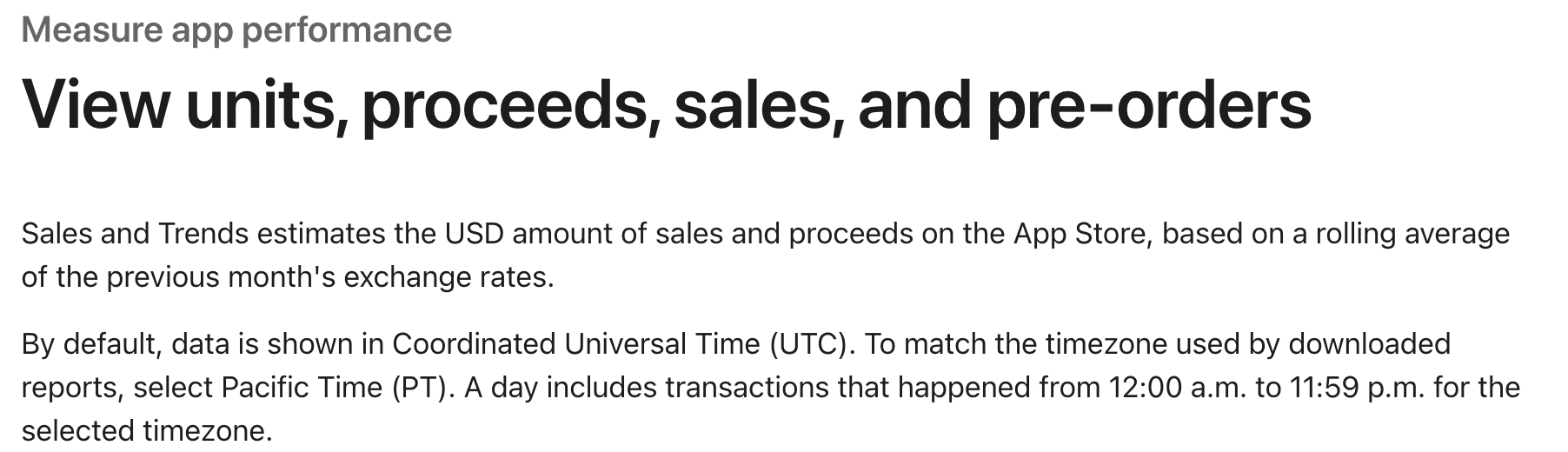
Two of the reasons store numbers differ from your other tools. Source: App Store Connect Help.
3. Gross vs. net. Apple defines Sales as the amount billed to customers, including taxes it collects, and Proceeds as the price minus taxes and Apple's commission. One dashboard showing gross and another showing net will never match.
4. Estimates vs. final. Apple says its dashboard shows near-real-time estimates while downloaded reports contain finalized data, and that refunds, billing retries and currency conversions "may be recorded at different times in each system." Apple's own advice is to avoid comparing those totals directly.
5. Attribution rules. Each ad platform credits the conversions it can see, with its own window. When two platforms both claim the same subscriber, adding their numbers together counts that person twice (why ad dashboards count the same install).
Want to see how App revenue numbers don't match works with your data?
Get hands-on with Airbridge and see real results.
Try It Free →Which source should you trust for each question?
Instead of hunting for the one tool that's right about everything, decide which tool answers which question, and always use it for that.
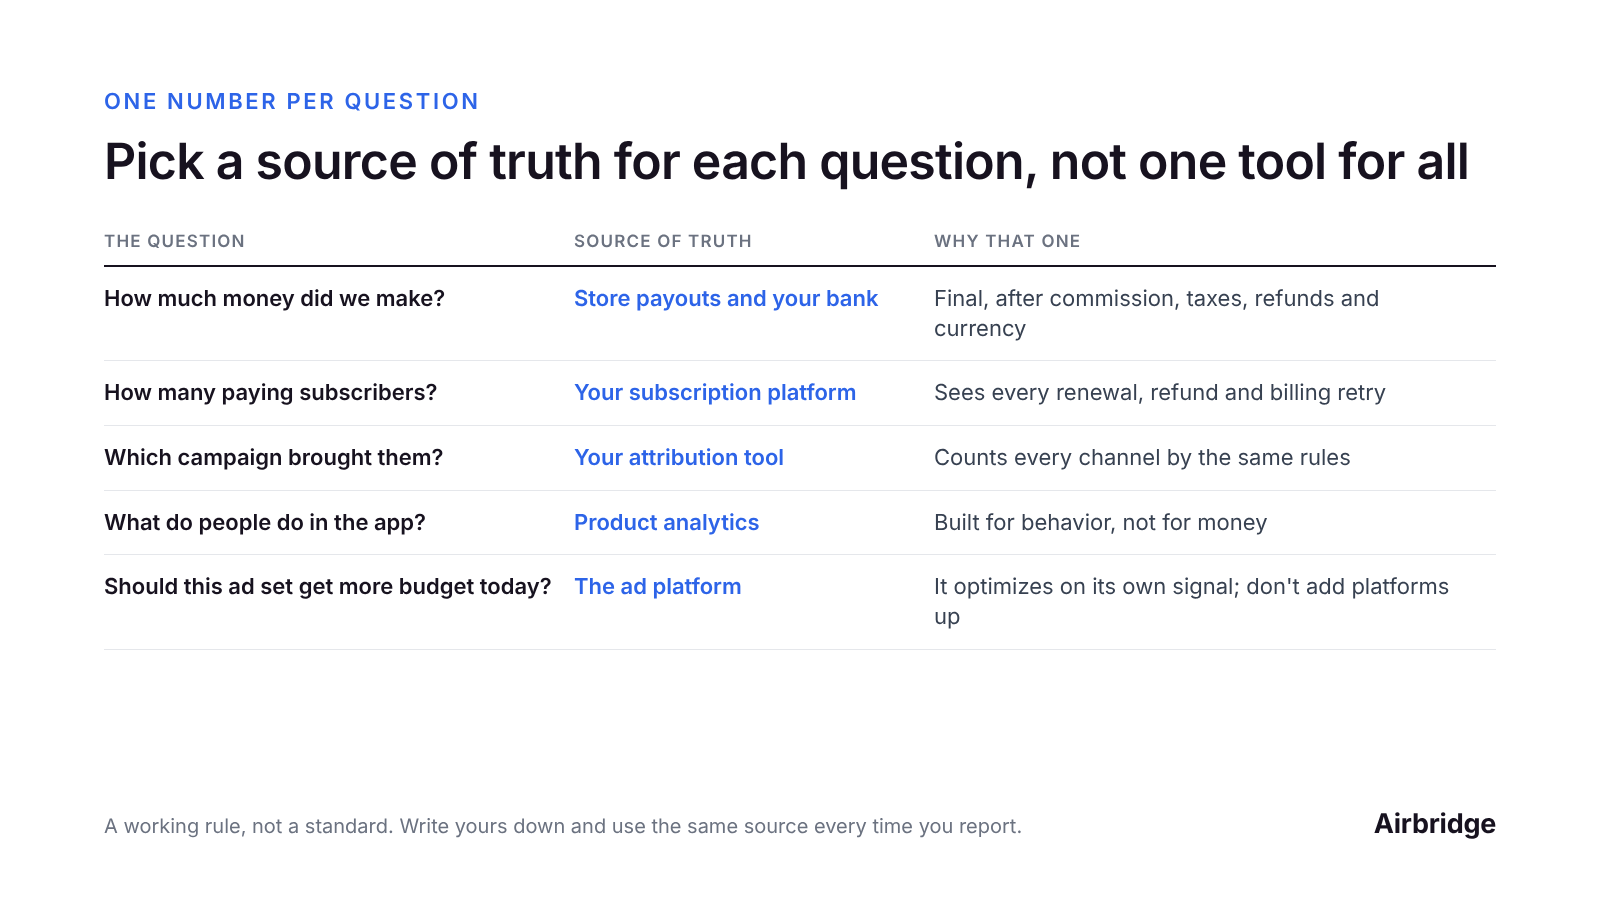
One way to split the questions. Write your version down and keep it.
A few notes on the split:
-
Money is final only when the store pays you. Use payouts for anything that goes to a board, a bank or a tax form.
-
Subscribers come from the system that receives every renewal and refund. For most subscription apps, that's the subscription platform.
-
Which campaign needs one set of rules across every channel. If you only have ad dashboards, you have several sets of rules.
-
Ad platforms are still the right place to decide daily budget within that platform, because that's the signal they optimize on.
How do you reconcile the numbers each month?
Mismatches are normal. Unexplained mismatches are the problem. Once a month:
-
Set the same timezone and date range in every tool you compare.
-
Compare like with like: gross with gross, net with net, same currency.
-
Check payouts against your subscription platform's revenue for the month. Write down the gap and the main reasons.
-
Check new subscribers per channel in your attribution tool against the subscription platform's total. The per-channel numbers should add up to roughly the total, not more.
-
Note what changed: a price change, a new country, a refund spike.
If a gap is bigger than last month and you can't name a reason, that's when to dig in.
Write a one-page metrics sheet
Put this in your team's shared docs, and link it every time you report:
Metric Source of truth Rule
Revenue (reported) Store payouts Net of commission, tax; by payout month
Paying subscribers Subscription platform Active paid, excl. trials; UTC
New subs by channel Attribution tool Same window for every channel
Trial-to-paid Subscription platform Cohort by trial start week
Daily budget calls Each ad platform Never summed across platforms
Common questions
Why are App Store Connect numbers different from my subscription dashboard?
Usually timezone (Apple shows UTC by default), currency (Apple estimates USD from last month's average rates), gross vs. net, and timing of refunds and billing retries.
Which number should I report to investors?
Revenue from store payouts and your bank, and subscriber counts from your subscription platform. Say which source you used.
Why do my ad platforms report more conversions than I have subscribers?
Each platform counts the conversions it can attribute to itself. When two platforms credit the same person, adding them up counts that person twice.
Do I need an MMP for this?
Only for the "which campaign" question across several channels. If you run one channel, its own dashboard may be enough.
The bottom line
Your tools disagree because they answer different questions with different rules. Pick one source per question, write the rules down, compare like with like, and reconcile once a month.
For the "which campaign brought them" question, Airbridge counts every channel by the same rules and ties trials and renewals from your subscription platform to each campaign. The Core Plan is built for subscription apps: try it free for 30 days, then from $40 per month.



Ready to transform your mobile growth?
Learn how Airbridge helps leading brands measure and optimize every touchpoint.
“Airbridge understands the essence of what it has to offer as an MMP. Its objective, transparent, and accurate performance analysis allows marketers to realize the true impact of their efforts.”