Best User Journey Mapping for Online Education App

On this page
For an online education app, first decide what "journey" means to you: where learners drop between stages, or every touch before they arrive. Those are different jobs, and they often sit on different plans. Airbridge makes one of the tools compared here, and its Core Plan covers the first through Funnel report drop-off, while touchpoint analytics sits on the Growth Plan.
What online education apps need from user journey mapping
A learner's path rarely runs in a straight line. Someone watches a video about a certification, reads a syllabus on a laptop, installs the app a week later, tries one free lesson, and vanishes. Two months later the exam date gets close, and they come back and pay. A clean funnel diagram hides most of that.
Three stages deserve more attention than the rest. The first is the gap between install and first real lesson, where a browser becomes a learner. The second is the return visit, since learning only works with repeat sessions. The third is the moment of payment, which may come long after install and often lines up with a deadline.
Education also has an odd ending. In most apps, a cancellation is a failure. Here it can mean success. A learner who passes the exam or finishes the course has no reason to stay, and that exit looks identical to someone who quit in frustration. If you map only the last step, you will treat your wins as churn. Pair the data with a short exit survey.
Cohort timing matters too. People who start at the beginning of a term follow a different rhythm from those who start in a quiet month. Group learners by start week before you compare drop-off.
Finally, the entry point shapes everything after it. A learner who arrives from a page about one specific course wants that course, not your home screen. Sending them to the right screen is part of the journey, not a detail.
What the data shows
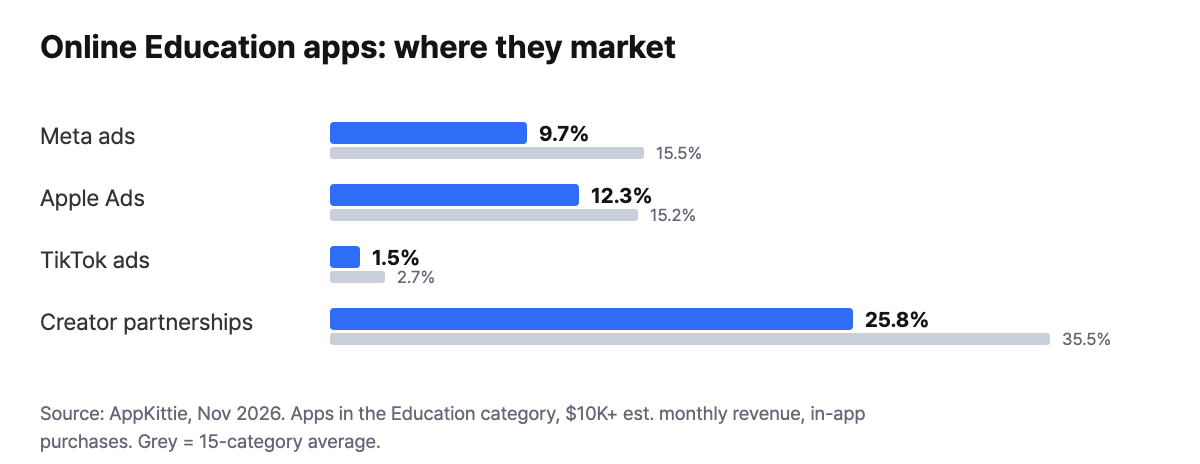
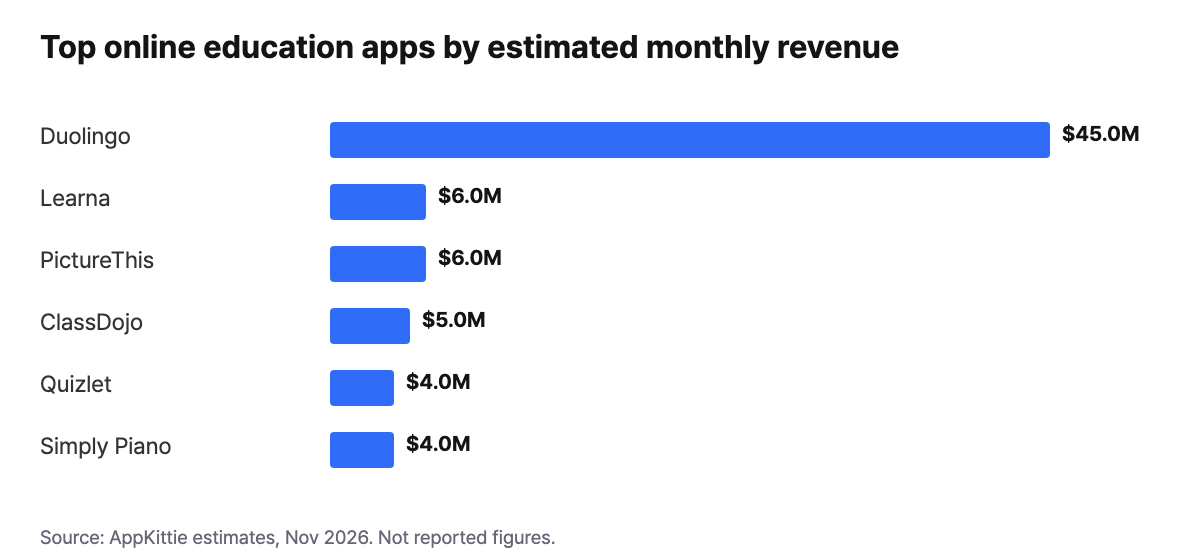
Creator partnerships are the largest signal at 25.8%, ahead of Apple Ads at 12.3% but under the 15-category average of 35.5%, across about 3,200 apps matched by category, with $10K+ estimated monthly revenue and in-app purchases, from AppKittie in November 2026. Creator content can start the journey before any ad, but this flag does not prove creator videos, so tag those links. Revenue figures are estimates from a small sample of 42 apps, and the list shows why one journey template will not fit: ClassDojo at $5M, Quizlet at $4M, and Simply Piano at $4M serve very different kinds of learning.
How to choose
| Criterion | Stage view is enough if | You need more if |
|---|---|---|
| Depth | You want to know which stage leaks | You need every touch before install |
| Lesson detail | Trial and payment are your main steps | You must see each lesson or quiz |
| Entry points | You can tag your links | You must analyze web browsing before the app |
| Return behavior | Repeat payment is your measure | You need custom return actions |
| Data access | Report exports serve you | You want raw events in a warehouse |
| Team size | One person reads the reports | An analyst builds custom paths |
Want to see how Best user journey mapping for online education apps works with your data?
Get hands-on with Airbridge and see real results.
Try It Free →Tools compared
| Airbridge Core | AppsFlyer | Adjust | Branch | Singular | Kochava | |
|---|---|---|---|---|---|---|
| Starting price | $40+/mo | Zero plan free (12,000 conversions in first 12 months); Growth $0.07 per conversion | Check vendor pricing page | Not listed on pricing page | Free plan (15,000 paid conversions); Growth $0.05 per conversion | Free App Analytics (10K conversions/month); Foundation from $500/mo |
| Self-serve signup | Yes | Yes | Check vendor pricing page | Yes on Basics | Yes on Free | Yes |
| Billing model | Data points | Per conversion | Check vendor pricing page | Not stated on pricing page | Per conversion | Conversions or MAU, by plan |
| Free trial | 30 days | Free Zero plan instead | Check vendor pricing page | Yes, on Basics | Free plan instead | Yes, on paid plans |
| RevenueCat integration | Yes | Yes | Yes | Yes | Yes | Yes |
Competitor details come from each vendor's public pages as of November 2026. AppsFlyer says its Zero plan is not suitable for apps with paid activities.
- Branch may suit a team that wants to try Basics with self-serve signup and a trial, though price is not listed.
- Kochava may suit a team that needs a free analytics start at 10K conversions a month, with billing that depends on plan.
- Airbridge Core may suit a team that is happy with stage-level funnels at $40+/mo on data points, after a 30-day trial.
- Singular may suit a learner app under 15,000 paid conversions that wants a free plan rather than a trial.
- Adjust may suit a team that will start from its pricing page, since the table points there for price, signup, billing, and trial.
- AppsFlyer may suit an app starting free with Zero, ready for per conversion billing once it moves to Growth.
How to set this up in Airbridge
- Use the no sales call setup guide to start your trial and add the SDK. The basic install is about 5 minutes of work.
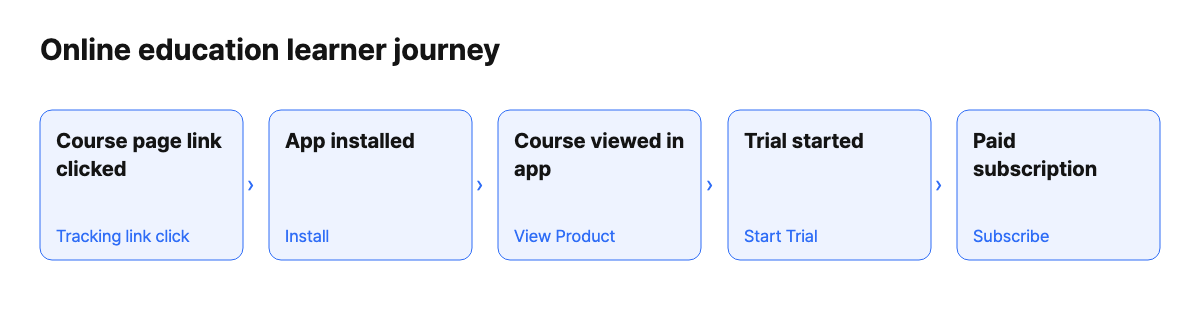
- Map your stages to standard events: Install, Sign Up, Search for finding a course, View Product for a course page, Start Trial, Subscribe, and Unsubscribe.
- Put tracking links on course pages and creator posts. Core's web-to-app routing and deep links can take people to the course they chose. deep linking">Deferred deep linking works for 1 hour after the click.
- Build one Funnel report for the path you sell, following this funnel example, and split it by channel.
- Add a Retention report with Subscribe as the Return Event, then split it by channel to see which channels keep paying.
What Airbridge Core does not do here
- Stages, not paths. The Funnel report shows drop-off between steps. It does not draw the routes learners took. Touchpoint analytics and overlap are Growth only.
- No lesson-level steps. Core takes standard events only, so "finished lesson 3" cannot be a funnel step without custom events on Growth.
- Little view before the app. The Core Web SDK handles web-to-app only. Syllabus reading and other web behavior need full web event measurement, which is also on Growth.
- No raw data export. You can export reports to Sheets or CSV, but not raw events. If you plan to build your own paths in a warehouse, choose Growth or another vendor.
FAQ
Is a Funnel report the same as a journey map?
No. A funnel shows how many people passed each step you defined. A journey map shows the routes they took to get there. For a small team, the funnel usually answers the first useful question: where do we lose people?
How do I tell a learner who finished from one who quit?
Airbridge cannot, because both appear as Unsubscribe. Use a short exit survey or your own course records. Keep that view next to the funnel when you discuss churn.
Do I still need a product analytics tool?
If you care about lessons, quizzes, and streaks, yes. Use attribution to see where learners came from and whether they paid. Use product analytics for what they did inside each lesson.


Ready to transform your mobile growth?
Learn how Airbridge helps leading brands measure and optimize every touchpoint.
“Airbridge understands the essence of what it has to offer as an MMP. Its objective, transparent, and accurate performance analysis allows marketers to realize the true impact of their efforts.”