Best ROAS Measurement for Nutrition App
On this page
For a nutrition app, look for ROAS measurement that puts ad cost, creator fees, and subscription revenue in one place, then tells you plainly which revenue it counts. Creator deals and annual plans make the simple install view misleading in this category. Airbridge makes one of the tools compared here, and its Core Plan takes cost from four ad channels or from a CSV upload.
What nutrition apps need from ROAS measurement
Nutrition apps sell a goal, and goals have seasons. Demand tends to rise around the new year and before summer, so a campaign can look strong because of the calendar. Compare cohorts from the same period, not this month against last.
Plan mix bends the numbers next. An annual plan pays up front, so its ROAS looks finished within days. A monthly plan pays slowly and looks weak in the same window, even if it keeps people longer. If you judge both on one early snapshot, you favor whichever channel happens to sell more annual plans.
Food logging adds a habit problem. Logging meals is work, and many people stop once the effort outweighs the novelty. A trial that starts on a burst of motivation may never convert. So a cheap trial start is weak proof of a good channel. Revenue is the event that settles it.
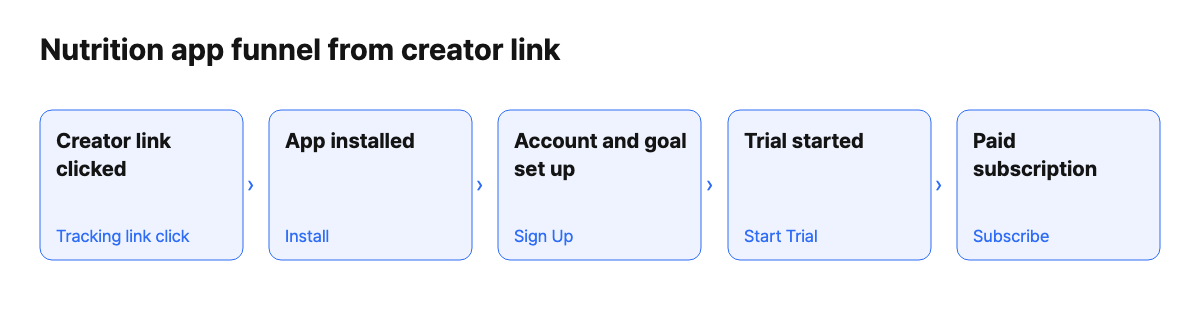
Creators bring the messiest cost. A dietitian or fitness creator is often paid a flat fee, and no ad platform reports that fee to you. The post keeps sending installs for weeks while the cost sits in one lump on one day. Without a way to log that fee, your creator channel shows revenue with no cost, and its ROAS looks perfect for the wrong reason.
Some apps also sell one-off meal plans next to the subscription. Check how that revenue reaches your tool, because it may not follow the same path.
What the data shows
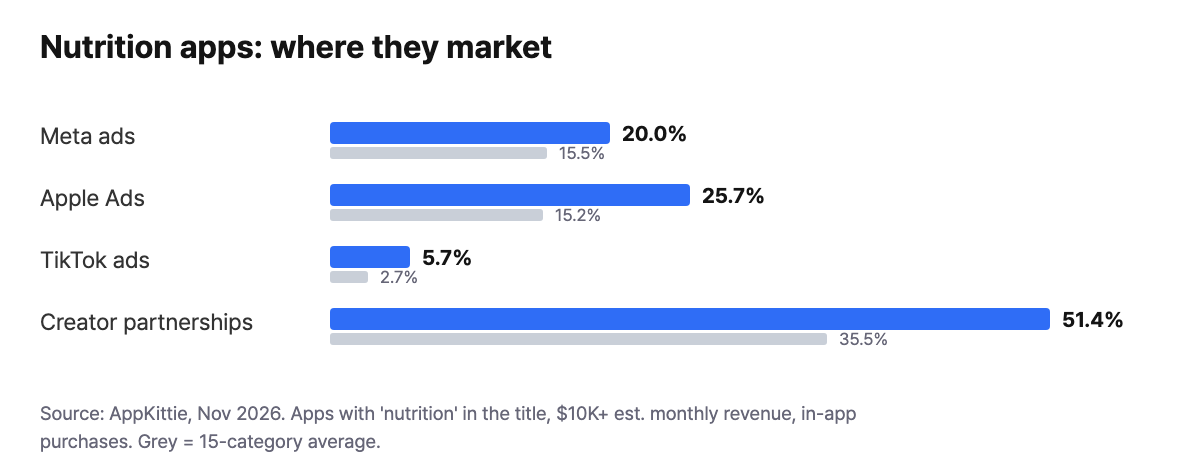
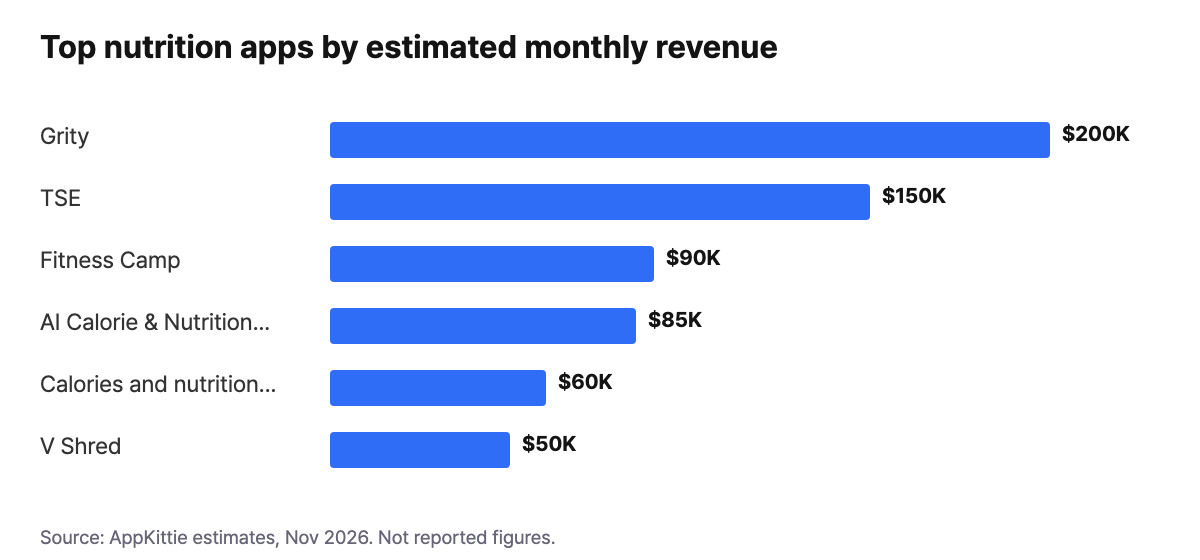
This is a small set: 35 apps matched by title, with $10K+ estimated monthly revenue and in-app purchases, from AppKittie in November 2026. Creator partnerships show on 51.4% of them against a 15-category average of 35.5%, and every channel in the chart runs above average, so creator cost is not a side issue here. Revenue figures are estimates, and downloads do not line up with them: Grity - Sport & Nutrition shows 8K downloads and $200K, while AI Calorie & Nutrition Tracker shows 500K downloads and $85K.
How to choose
- Creator cost. Can you add flat fees by hand and split them by creator? In this set, that may matter as much as any ad integration.
- Revenue source. Does the tool read from your subscription platform, or do you rebuild revenue from store reports?
- Credit rule. Does revenue need to land inside an attribution window? A late renewal can count in one report and not in another.
- Cost depth. Decide how deep you need to go. Cost by creative and cost by campaign are different purchases.
- Refunds. Find out how refunds appear. If the tool only shows a cancellation, you need a second source for net revenue.
- Billing shape. Per conversion and per event pricing react differently as logging sessions grow. Run both against your own volume.
Want to see how Best roas measurement for nutrition apps works with your data?
Get hands-on with Airbridge and see real results.
Try It Free →Tools compared
| Airbridge Core | AppsFlyer | Adjust | Branch | Singular | Kochava | |
|---|---|---|---|---|---|---|
| Starting price | $40+/mo | Zero plan free (12,000 conversions in first 12 months); Growth $0.07 per conversion | Check vendor pricing page | Not listed on pricing page | Free plan (15,000 paid conversions); Growth $0.05 per conversion | Free App Analytics (10K conversions/month); Foundation from $500/mo |
| Self-serve signup | Yes | Yes | Check vendor pricing page | Yes on Basics | Yes on Free | Yes |
| Billing model | Data points | Per conversion | Check vendor pricing page | Not stated on pricing page | Per conversion | Conversions or MAU, by plan |
| Free trial | 30 days | Free Zero plan instead | Check vendor pricing page | Yes, on Basics | Free plan instead | Yes, on paid plans |
| RevenueCat integration | Yes | Yes | Yes | Yes | Yes | Yes |
Competitor details come from each vendor's public pages as of November 2026. AppsFlyer says its Zero plan is not suitable for apps with paid activities.
- Singular may suit a team that wants per conversion billing at $0.05 after a free plan of 15,000 paid conversions.
- AppsFlyer may suit a team happy with $0.07 per conversion on Growth, since it says its Zero plan is not suitable for apps with paid activities.
- Kochava may suit a team with budget for Foundation from $500/mo, or one that only needs free App Analytics at 10K conversions a month.
- Branch may suit a team that values self-serve Basics and accepts that its pricing page lists no price.
- Adjust may suit a team that can ask for details, since the table sends you to its pricing page for most rows.
- Airbridge Core may suit a small team that wants to test ROAS for 30 days, then pay $40+/mo with data point billing.
How to set this up in Airbridge
- Start the 30-day free trial and install the SDK, which takes about 5 minutes for a basic install.
- Connect Meta Ads, Google Ads, Apple Ads, and TikTok for Business, so ad spend arrives without manual work. Apple Ads Basic has no cost sync, so upload that cost by CSV.
- Connect RevenueCat, Adapty, or Superwall. Initial purchases, trial conversions, and renewals all arrive as Subscribe.
- Give each creator a tracking link, then upload fees with CSV Cost Data Upload. Put the creator in the campaign column. A custom channel name is allowed. Actuals then shows cost metrics for each creator, and you can read CPI from them.
- Open the Revenue Report, choose your Start Event, and pick Subscribe as the Revenue Event. Compare that revenue against ad spend for each channel.
What Airbridge Core does not do here
- Cost stops short of creative level. The cost integration does not reach individual creatives, and Performance Max is campaign level only.
- Subscribe is one bucket. First payment, trial conversion, and renewal collapse into it. Core has no dedicated refund event, and refund cancellations surface only as Unsubscribe, so check net revenue in your subscription tool.
- One-off meal plans need care. Non-renewing purchases arrive from subscription integrations as custom events, which Core cannot use.
- No raw data export. If you plan to build your own ROAS model in a warehouse, Core will not feed it. Raw export is on the Growth Plan, along with more than the four Core ad channels. Choose Growth or another vendor if either one is a must.
FAQ
Why do the Revenue Report and Actuals show different revenue?
They use different rules. The Revenue Report credits each revenue event to the most recent Start Event with no attribution window. Actuals counts only events inside the window. A renewal months later can appear in the first and not the second.
Is CAC in the Revenue Report my cost per paying customer?
No. It is total ad spend divided by Start Event users. If your Start Event is Install, it reads closer to cost per install. Do not treat it as cost per payer.
Can I judge a channel before the first renewal?
Partly. Predictive LTV estimates value up to day 180. It multiplies a machine learning prediction of user lifetime by ARPDAU. It stays in the dashboard and is never sent to ad networks, so use it for your own budget calls.


Ready to transform your mobile growth?
Learn how Airbridge helps leading brands measure and optimize every touchpoint.
“While working with Airbridge, we have learned that MMM is a crucial attribution model for post-privacy era marketing to predict future performance and optimize the budget.”