INTVL Revenue & Ads
A running app that turns runs into a territory game on a real map, with takeovers, leaderboards and training plans.
 Hyunjong Choi
Published Oct 19, 2026Updated Oct 19, 202613 min readPricing play
Est. monthly revenue
$205K
↓ 1.1% vs prev. period
Downloads / month
92K
↓ 11.0% vs prev. period
Rating
4.7
5.5K ratings · #6 in Denmark
Meta ads running
429
685 found · median 28
INTVL revenue and downloads trend
Est. monthly revenue
$205K ↓ 26.1% in 90 days
Nov 20, 2025: $88KOct 18, 2026
Monthly downloads
92K ↓ 0.3% in 90 days
Nov 20, 2025: 29KOct 18, 2026
Daily estimates from AppKittie, 319 days ending Oct 18, 2026. Revenue changed +133% and downloads +214% over the period. Meta ads live went from 0 to 429 between Aug 25, 2026 and Oct 18, 2026.
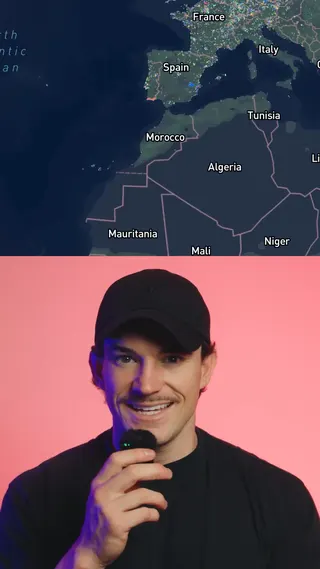
INTVL Meta ads: 429 active, longest running 159 days
Top 12 by days live out of 685 found (12 video and 0 image creatives). Tap any one to open the original in the Meta Ad Library.
 #1159 days liveAd copy“Tired of running apps that feel the same as every other fitness tracker? Most apps track runs passively in the background - INTVL turns runs into territory wars where you battle against runners in your neighborhood. The rules are simple: run to claim territory and defend when rivals try to steal your land. Join over 1 million runners competing for territory. Click the link to”Why it worksTired of running apps that feel the same? Territory wars with neighbors; video, 159 days.
 #2159 days liveAd copy“Tired of running apps that feel the same as every other fitness tracker? Most apps track runs passively in the background - INTVL turns runs into territory wars where you battle against runners in your neighborhood. The rules are simple: run to claim territory and defend when rivals try to steal your land. Join over 1 million runners competing for territory. Click the link to”Why it worksSame territory wars pitch, claim and defend your land; video, 159 days live.
 #3159 days liveAd copy“Tired of running apps that feel the same as every other fitness tracker? Most apps track runs passively in the background - INTVL turns runs into territory wars where you battle against runners in your neighborhood. The rules are simple: run to claim territory and defend when rivals try to steal your land. Join over 1 million runners competing for territory. Click the link to”Why it worksThird copy of the run to claim territory line, 159 days, no store link.




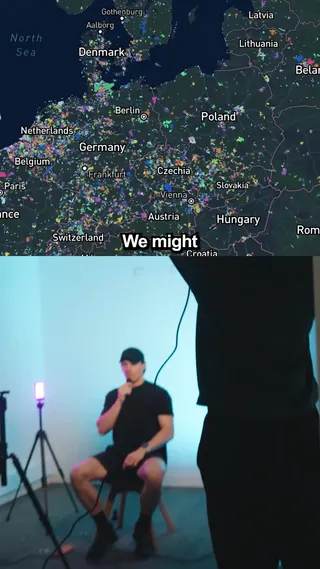



9 more Meta ads are locked
Unlock freeAds from the Meta Ad Library via AppKittie, snapshot Oct 16, 2026. Store data from the App Store.
Territory Wars Copy for Runners Who Want a Game
INTVL is a running app from INTVL PTY LTD that turns runs into a game of claiming and defending territory on a real map. As of Oct 2026 it makes an estimated $205K a month from an estimated 92K downloads, 3.4x the Health & Fitness median revenue. The top ads call other running apps passive trackers and sell territory wars against neighbors, backed by $322K of estimated lifetime Meta spend.
Key takeaways
- 429 active Meta ads out of 685 found, 15.3x the Health & Fitness median of 28, and 0 Apple Search Ads creatives. All 12 top ads are video with no store link.
- Every top ad opens with Tired of running apps that feel the same as every other fitness tracker? The longest has run 159 days and the median 148.
- Plans cost $7.99, $8.99 or $12.99 a month and $49.99, $59.99 or $79.99 a year, a 1.6x spread. The cheapest annual is 52% of 12 monthly payments.
- Meta Ad Library spend estimates put lifetime spend at $322K, reaching 21.0M people. Men get 81.3%, ages 25-34 take 42.2%, and the United States 74.3%.
- Best App Store ranks are #6 in Denmark, #15 in Norway and the United States, #16 in Ireland and #20 in Sweden.
Full teardown
Unlock 9 more Meta ads
Unlocked. Everything on this page is open now.
Where INTVL spends on Meta
Audience and spend estimates built on Meta Ad Library data (reported for ads shown in the EU, with other countries modeled), lifetime of the ads found. The biggest audience is 25-34, taking 42.2% of spend.
Est. spend
$322K
Reach
21.0M
Avg. CPM
$15.31
Ads delivered
685
Spend by age
Spend by gender
Top countries by reach
| Country | Reach | Spend | Share |
|---|---|---|---|
| United States est. | 11.3M | $239,107 | 74.3% |
| United Kingdom | 2.3M | $30,212 | 9.38% |
| Germany | 823.3K | $8,842 | 2.75% |
| Poland | 515.5K | $2,645 | 0.82% |
| Portugal | 439.6K | $2,690 | 0.84% |
Rows marked est. are modeled by AppKittie from Ad Library coverage, not reported by Meta.
What INTVL does differently
Attack the category's boredom
159 days
longest running top ad, median 148
Competitive men, mostly American
81.3%
of $322K estimated Meta spend aimed at men
Annuals above the median
52%
cheapest annual versus 12 monthly payments
The measurement gap
12 of 12
top ads carry no store link
1. Attack the category's boredom
All 12 top Meta ads open by naming a complaint: tired of running apps that feel the same as every other fitness tracker? Then they explain the twist. Most apps track runs passively in the background, while INTVL turns runs into territory wars where you battle runners in your neighbourhood. Run to claim territory and defend when rivals try to steal your land, join over 1 million runners. All are video, none carries a store link, and they have run 146 to 159 days. The ad sells a game, not a tracker, which is easier to share and harder to copy. INTVL names what bores users about the category, then shows the one mechanic that is different.
2. Competitive men, mostly American
Meta Ad Library spend estimates put INTVL's lifetime Meta spend at $322K, reaching 21.0M people. Men receive 81.3% and women 17.0%. Ages 25-34 take 42.2%, 35-44 take 30.3% and 18-24 take 16.7%. The United States gets 74.3%, the United Kingdom 9.38% and Germany 2.75%. Territory wars and leaderboards appeal to competitive runners, and the targeting follows. Organic ranks are strongest in Nordic countries, #6 in Denmark, #15 in Norway and #20 in Sweden, markets with little of the spend. A smaller app with a social or competitive mechanic should find the countries where its community already forms and use paid only to fill the gaps.
3. Annuals above the median
INTVL sells 10 in-app purchases at 6 prices. Monthly plans cost $7.99, $8.99 or $12.99, and annual plans $49.99, $59.99 or $79.99, a 1.6x spread. The cheapest annual equals 52% of 12 monthly payments and matches the Health & Fitness median annual of $49.99. A game mechanic supports a yearly plan, since territory takes time to build and loses value if you stop. Reviews are mostly warm, 164 five-star out of 200, but some report surprise charges, such as $19.99 they say they did not expect. Revenue grew 132.8% over 319 days but fell from a $328K peak on Aug 31. A clear notice before each trial converts would answer INTVL's billing complaints.
4. The measurement gap
INTVL sells territory wars through 429 Meta ads with no store link, puts an estimated $322K of Meta spend on competitive men, and sells annuals from $49.99. The question is which city, country and video bring runners who keep claiming land and renew the year, not curious installs who run once and churn.
How much does INTVL cost?
10 in-app purchases, 6 distinct prices, annual plans from $49.99 to $79.99. Prices as listed on the US App Store, Oct 16, 2026.
| Monthly | $7.99 · $8.99 · $12.99 |
|---|---|
| Annual | $49.99 · $59.99 · $79.99 |
INTVL vs the Health & Fitness median
| INTVL | Median | |
|---|---|---|
| Est. monthly revenue | $205K | $60K |
| Downloads / month | 92K | 20K |
| Meta ads running | 429 | 28 |
| Rating | 4.7 | 4.7 |
| Lowest annual price | $49.99 | $49.99 |
Median of 147 Health & Fitness apps with active Meta ads in our set. See the Health & Fitness hub ›
What INTVL users say about paying
Of 200 reviews from Aug 1 to Oct 17, 2026, 15, or 7.5%, mention price, trial or subscription, and 9 of those are negative, mostly about unexpected charges. The sample averages 4.57.
Latest 200 US reviews, Aug 1, 2026 to Oct 17, 2026
Mention price, trial or subscription
8%15 of 200 reviews, 9 of them 1 or 2 stars
They charge you $19.99 without you knowing. Be careful.
When I wake up at 5:30 in the morning, one of the biggest questions I have is, what route should I run this morning? This app certainly helps to answer that que…
How to measure a playbook like INTVL's
INTVL runs 429 Meta ads with no store link and ranks #6 in Denmark, so measurement means separating paid installs from unpaid ones and tying both to annual plans.
- 01
Connect RevenueCat to see revenue by channel
Every purchase and renewal joins the install it came from, so each channel shows real revenue, not only installs.
- 02
Compare markets, not only campaigns
With several price points, the same campaign earns different revenue per country. Break revenue down by country and channel together.
- 03
An annual buyer and a monthly buyer look the same at install. Retention by channel shows which source keeps paying.
Measure this on your own app with Airbridge Core
From $40/mo · 30 days free · no sales call
How we built this teardown
- Revenue and downloads are third-party estimates from AppKittie, snapshot Oct 16, 2026. Store intelligence estimates for a single app can be off by 30% or more. Treat them as a range, not a figure from the developer. Daily revenue and download series cover 319 days ending Oct 18, 2026.
- Ads come from the public Meta Ad Library. "Days live" counts days since an ad first appeared. Spend and audience breakdowns start from Meta's EU transparency figures; country splits outside the EU are AppKittie models.
- Prices, ratings and ranks come from the App Store (US storefront) on the same date. Prices differ by country and by paywall offer. Review stats use the latest 200 US reviews from Apple's public review feed.
- Category medians are computed across 147 Health & Fitness apps with active Meta ads in our set of 860 subscription apps.
- Written by Hyunjong Choi. Ads, prices and estimates are refreshed every 30 to 90 days. Updated Oct 19, 2026.
Top Health & Fitness apps by estimated revenue
All 25 ›| # | App | Est. revenue / mo | Ads live |
|---|---|---|---|
| 1 |  StravaStrava Inc. | $15M | 330 |
| 2 |  AllTrailsAllTrails, Inc. | $6M | 166 |
| 3 |  RunnaStrava Inc. | $4M | 1,100 |
| 4 |  CalmCalm.com, Inc. | $3M | 659 |
| 5 |  Cal AIViral Development LLC | $2M | 823 |
| 49 | INTVLINTVL PTY LTD | $205K | 429 |
Similar apps
 Life Reset
 Lumenate
 Balance
 Reframe
Frequently asked questions about INTVL
How much does INTVL make?
An estimated $205K a month as of Oct 2026, a -1.1% change versus the previous period and 3.4x the Health & Fitness median of $60K. These are AppKittie estimates, not figures reported by INTVL PTY LTD.
How much does INTVL cost?
Monthly plans are listed at $7.99, $8.99 and $12.99 and annual plans at $49.99, $59.99 and $79.99 on the US App Store.
How many ads does INTVL run?
429 active Meta ads out of 685 found, 15.3x the Health & Fitness median of 28, and no Apple Search Ads creatives.
How fast is INTVL growing?
Over 319 days to Oct 18, 2026, estimated downloads rose 214.1% and revenue 132.8%, though revenue is below its Aug 31 peak.
Where is INTVL most popular?
Its best App Store ranks are #6 in Denmark, #15 in Norway and the United States, #16 in Ireland and #20 in Sweden.
Who makes INTVL?
INTVL PTY LTD develops INTVL. The app launched on Feb 10, 2024, making it 32 months old, and was last updated on Oct 4, 2026.
Who does INTVL target with ads?
Estimated Meta spend goes 81.3% to men, with 42.2% at ages 25-34 and 30.3% at 35-44.
Try Airbridge Core free (no sales call)
The install is visible, the subscriber is not. Airbridge Core closes that gap: connect Meta, TikTok, Google and Apple Ads, add one tracking link per creator, plug in RevenueCat, Superwall or Adapty, and each campaign shows revenue instead of installs. The Core plan is $40 a month after 30 free days. Start your free trial.
Start Core free
Hyunjong Choi LinkedIn
Go-to-market, Airbridge Core
Works on go-to-market for Airbridge Core, the self-serve attribution plan for subscription apps. Writes these teardowns from public App Store data, the Meta Ad Library and AppKittie estimates.
About Airbridge
Airbridge is a mobile measurement partner for Meta, Google, TikTok and Apple Ads, with native RevenueCat, Superwall and Adapty integrations. Subscription teams like NOICE cut measurement setup time by 75% after switching.