
TZ iBoat Revenue & Ads
A marine navigation app with charts, satellite imagery, AIS tracking, weather, route planning and anchor alarms for boaters.
 Hyunjong Choi
Published Oct 19, 2026Updated Oct 19, 202611 min readPricing play
Est. monthly revenue
$80K
↓ 48.4% vs prev. period
Downloads / month
7K
↑ 2.2% vs prev. period
Rating
4.6
882 ratings · #48 in New Zealand
Meta ads running
35
43 found · median 25
TZ iBoat revenue and downloads trend
Est. monthly revenue
$80K ↓ 18.8% in 90 days
Jul 22, 2026: $98KOct 18, 2026
Monthly downloads
7.4K ↑ 25.0% in 90 days
Jul 22, 2026: 5.9KOct 18, 2026
Daily third-party estimates, 88 days ending Oct 18, 2026. Revenue changed -19% and downloads +25% over the period.
TZ iBoat Meta ads: 35 active, longest running 152 days
Top 13 by days live out of 43 found (12 video and 1 image creatives). Tap any one to open the original in the Meta Ad Library.
 #1152 days liveApp StoreAd copy“Game on. Jason’s favorite fishing app: TZ iBoat”Why it worksGame on, Jason's favorite fishing app, a named user as the hook; video to the App Store, 152 days.
 #2120 days liveWeb linkAd copy“Everything you need on the water. Marine charts, weather forecasts, AIS, route planning and advanced boating tools in one app. Now available on Android.”Why it worksEverything you need on the water, charts, weather, AIS, now on Android; video to the web, 120 days.
 #3106 days liveWeb linkAd copy“Everything you need on the water in one powerful app. Marine charts, weather forecasts, AIS, route planning and advanced boating tools.”Why it worksEverything on the water in one app, a feature list; video to the web, 106 days.



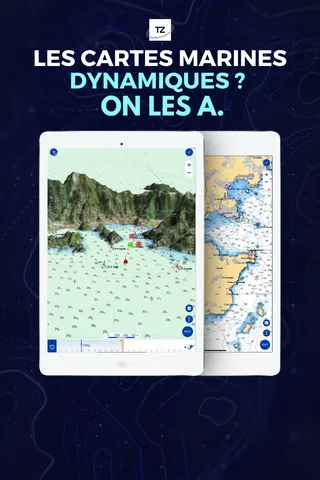
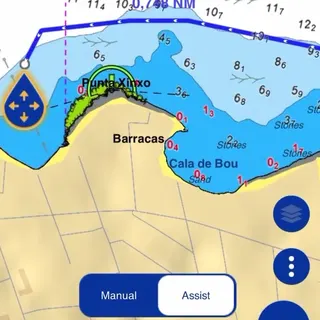



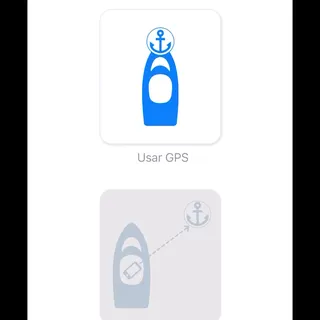

10 more Meta ads are locked
Unlock freeAds from the Meta Ad Library as of Oct 16, 2026. Store data from the App Store.
Regional Chart Packs for Older Boaters
TZ iBoat is a marine navigation app from Nobeltec, Inc. with charts, AIS tracking, weather and route planning. As of Oct 2026 it makes an estimated $80K a month on an estimated 7K downloads. An estimated $11.43 per download comes from regional chart packs such as Bahamas and Canada West, sold beside monthly and annual plans.
Key takeaways
- TZ iBoat earns an estimated $80K a month, 1.3x the Navigation median of $60K, on downloads 0.3x the median of 22K.
- Its 10 in-app purchases include months at $2.99, $9.99 and $39.99, years at $19.99 and $30.99, and add-ons at $8.99 and $49.99.
- It runs 35 active Meta ads, 1.4x the category median, with 13 distinct lines in the top 13 and 21 Apple Search Ads creatives.
- Meta Ad Library spend estimates skew older and male: ages 55 to 64 take 25.4%, 65 and over 23.8%, and men 78.5%.
- Estimated revenue changed -48.4% against the previous period, after a peak of $187K on Sep 2.
Full teardown
Unlock 10 more Meta ads
Unlocked. Everything on this page is open now.
Where TZ iBoat spends on Meta
Audience and spend estimates built on Meta Ad Library data (reported for ads shown in the EU, with other countries modeled), lifetime of the ads found. The biggest audience is 55-64, taking 25.4% of spend.
Est. spend
$5K
Reach
345.5K
Avg. CPM
$14.17
Ads delivered
44
Spend by age
Spend by gender
Top countries by reach
| Country | Reach | Spend | Share |
|---|---|---|---|
| United States est. | 143.0K | $3,038 | 62.1% |
| France | 94.2K | $918.23 | 18.8% |
| Spain | 72.4K | $552.17 | 11.3% |
| United Kingdom | 13.9K | $184.15 | 3.76% |
| Belgium | 9.4K | $80.22 | 1.64% |
Rows marked est. are modeled from Ad Library coverage, not reported by Meta.
What TZ iBoat does differently
Charts sold region by region
$11.43
estimated revenue per download
Thirteen ads, thirteen lines
13
distinct copy lines in the top 13
Older boaters in three markets
62.1%
share of estimated Meta spend in the US
The measurement gap
-48.4%
estimated revenue change vs previous period
1. Charts sold region by region
Bahamas (Annual), Canada West (Annual), Central America & Caribbean (Annual), an AIS module and an Elite Subscription (Monthly): the product list reads like a chart shop. Monthly prices are $2.99, $9.99 and $39.99, annual prices $19.99 and $30.99, and add-ons cost $8.99 and $49.99. The cheapest year costs 56% of 12 monthly payments. Boaters pay for the waters they sail, so a regional pack matches the price to real use, and a sailor heading south buys another pack. That earns an estimated $11.43 per download from only 7K installs. For TZ iBoat, each new region a boater sails is another sale, so revenue can grow without new installs.
2. Thirteen ads, thirteen lines
Game on, Jason's favorite fishing app: TZ iBoat. That line leads the top ad, live 152 days. The next two, at 120 and 106 days, list charts, weather, AIS and route planning in one app, and one adds that it is now on Android. Each of the top 13 has its own line, in English, French and Spanish, from fishing tools to an anchor alarm shown by a skipper named Santiago. One ad even shows a raw template field where the brand name should be. With 92% video, 9 links to the App Store and 4 to the web, the app tests many angles at once. Named people, a fisher or a skipper, make the tool look used, and TZ iBoat runs them across three languages.
3. Older boaters in three markets
Ages 55 to 64 take 25.4% of tracked spend, 65 and over 23.8%, and 45 to 54 another 21.2%, so most spend reaches people past 45. Men take 78.5%. By country, the United States takes a modeled 62.1%, France 18.8% and Spain 11.3%, which matches the French and Spanish copy. Lifetime spend is $5K for a reach of 345.5K. New Zealand is the best chart, at #48. An older audience may also explain part of the high revenue per download. For TZ iBoat, the ads already target by age and by coast, so the languages of the copy follow the buyers.
4. The measurement gap
TZ iBoat sells regional chart packs to older boaters in the US, France and Spain, and its estimated revenue changed -48.4% after the summer peak. The question is which market and which of its 13 ad lines bring boaters who buy a chart pack or the Elite plan, and which only download for the season.
How much does TZ iBoat cost?
10 in-app purchases, 7 distinct prices, annual plans from $19.99 to $30.99. Prices as listed on the US App Store, Oct 16, 2026.
| Monthly | $2.99 · $9.99 · $39.99 |
|---|---|
| Annual | $19.99 · $30.99 |
| Other | $8.99 · $49.99 |
TZ iBoat vs the Navigation median
| TZ iBoat | Median | |
|---|---|---|
| Est. monthly revenue | $80K | $60K |
| Downloads / month | 7K | 22K |
| Meta ads running | 35 | 25 |
| Rating | 4.6 | 4.7 |
| Lowest annual price | $19.99 | $34.99 |
Median of 17 Navigation apps with active Meta ads in our set. See the Navigation hub ›
What TZ iBoat users say about paying
Of the latest 158 reviews, 13 (8.2%) mention price, trial or subscription and 4 of those are negative, with some confusion about buying again on a second device.
Latest 158 US reviews, Oct 7, 2018 to Sep 29, 2026
Mention price, trial or subscription
8%13 of 158 reviews, 4 of them 1 or 2 stars
I had the app and created an account on my phone. When I log into my account on my IPad it asks me to buy another account. I sent several requests for info as t…
Save your money. I bought the service, and quite honestly it’s worthless. I already canceled future subscriptions. I bought it for chart access, but you can get…
How to measure a playbook like TZ iBoat's
TZ iBoat runs 35 ads in three languages and sells chart packs by region, so the number that matters is which market brings boaters who buy a pack.
- 01
Connect RevenueCat to see revenue by channel
Every purchase and renewal joins the install it came from, so each channel shows real revenue, not only installs.
- 02
Compare markets, not only campaigns
With several price points, the same campaign earns different revenue per country. Break revenue down by country and channel together.
- 03
An annual buyer and a monthly buyer look the same at install. Retention by channel shows which source keeps paying.
Measure this on your own app with Airbridge Core
From $40+/mo · 30 days free · no sales call
How we built this teardown
- Revenue and downloads are third-party app intelligence estimates as of Oct 16, 2026. Store intelligence estimates for a single app can be off by 30% or more. Treat them as a range, not a figure from the developer. Daily revenue and download series cover 88 days ending Oct 18, 2026.
- Ads come from the public Meta Ad Library. "Days live" counts days since an ad first appeared. Spend and audience breakdowns start from Meta's EU transparency figures; country splits outside the EU are modeled.
- Prices, ratings and ranks come from the App Store (US storefront) on the same date. Prices differ by country and by paywall offer. Review stats use the latest 158 US reviews from Apple's public review feed.
- Category medians are computed across 17 Navigation apps with active Meta ads in our set of 860 subscription apps.
- Written by Hyunjong Choi. Ads, prices and estimates are refreshed every 30 to 90 days. Updated Oct 19, 2026.
Top Navigation apps by estimated revenue
All 6 ›| # | App | Est. revenue / mo | Ads live |
|---|---|---|---|
| 1 |  onX HuntonXmaps, Inc. | $8M | 123 |
| 2 |  WikilocWikiloc Outdoor SL | $600K | 0 |
| 3 |  Gaia GPSTrailbehind, INC. | $300K | 9 |
| 4 |  onX OffroadonXmaps, Inc. | $245K | 34 |
| 5 |  Cardo RideRISER GmbH | $84K | 53 |
| 6 | TZ iBoatNobeltec, Inc. | $80K | 35 |
Similar apps
 onX Backcountry
 Enroad
 onX Fish
Frequently asked questions about TZ iBoat
How much does TZ iBoat make?
TZ iBoat makes an estimated $80K a month as of Oct 2026, 1.3x the Navigation median of $60K. These are third-party estimates, not figures from the developer.
How much does TZ iBoat cost?
Monthly plans cost $2.99, $9.99 or $39.99, annual plans $19.99 or $30.99, and add-ons such as regional charts cost $8.99 or $49.99 on the US App Store.
How many ads does TZ iBoat run?
TZ iBoat runs 35 active Meta ads, 1.4x the Navigation median of 25, out of 43 found, plus 21 Apple Search Ads creatives.
How fast is TZ iBoat growing?
Over 88 days estimated downloads rose 25.0%, from 5.9K to 7.4K, while estimated revenue changed -18.8%, from $98K to $80K.
Where is TZ iBoat most popular?
Its best chart position is #48 in New Zealand, and the US, France and Spain take most of its estimated Meta ad spend.
Who uses TZ iBoat?
Its ad spend skews older and male: ages 55 to 64 take 25.4% and men 78.5% of spend.
Who makes TZ iBoat?
Nobeltec, Inc. makes TZ iBoat. It launched on Jan 2, 2018 and was last updated on Oct 5, 2026.
Try Airbridge Core free (no sales call)
The install is visible, the subscriber is not. Airbridge Core closes that gap: connect Meta, TikTok, Google and Apple Ads, add one tracking link per creator, plug in RevenueCat, Superwall or Adapty, and each campaign shows revenue instead of installs. The Core plan starts at $40 a month after 30 free days. Start your free trial.
Start Core free
Hyunjong Choi LinkedIn
Go-to-market, Airbridge Core
Works on go-to-market for Airbridge Core, the self-serve attribution plan for subscription apps. Writes these teardowns from public App Store data, the Meta Ad Library and third-party estimates.
About Airbridge
Airbridge is a mobile measurement partner for Meta, Google, TikTok and Apple Ads, with native RevenueCat, Superwall and Adapty integrations. Subscription teams like NOICE cut measurement setup time by 75% after switching.