
RatePunk Revenue & Ads
A flight deal app that sends discounted fares, airline promotions and mistake fares from a chosen departure airport.
 Hyunjong Choi
Published Oct 19, 2026Updated Oct 19, 202613 min readPricing play
Est. monthly revenue
$106K
↑ 3.2% vs prev. period
Downloads / month
32K
↑ 3.1% vs prev. period
Rating
4.7
6.7K ratings · #74 in New Zealand
Meta ads running
1,000
836 found · median 19
RatePunk revenue and downloads trend
Est. monthly revenue
$106K ↑ 24.0% in 90 days
Dec 23, 2025: $39KOct 18, 2026
Monthly downloads
32K ↑ 67.2% in 90 days
Dec 23, 2025: 8.7KOct 18, 2026
Daily third-party estimates, 300 days ending Oct 18, 2026. Revenue changed +170% and downloads +264% over the period. Meta ads live went from 1261 to 962 between Aug 24, 2026 and Oct 18, 2026.
RatePunk Meta ads: 1,000 active, longest running 677 days
Top 13 by days live out of 836 found (4 video and 8 image creatives). Tap any one to open the original in the Meta Ad Library.
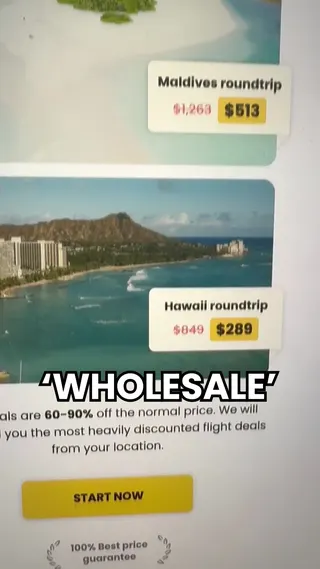
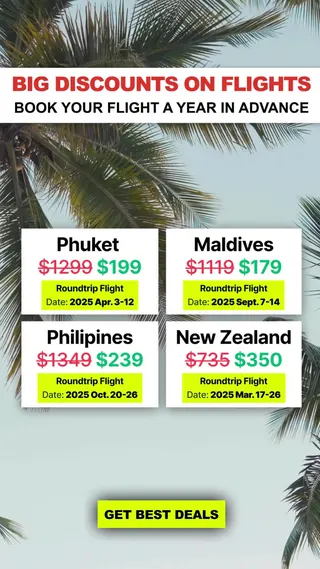
 #1677 days liveWeb linkAd copy“Love traveling but strapped for cash? Get mind-blowing flight deals up to 72% off, sent straight to your inbox. Just sign up, choose your departure airport, and watch the magic happen today!”Why it worksStrapped for cash pitch with deals up to 72% off by email, image, 677 days.
 #2677 days liveWeb linkAd copy“Love traveling but strapped for cash? Get mind-blowing flight deals up to 72% off, sent straight to your inbox. Just sign up, choose your departure airport, and watch the magic happen today!”Why it worksSame image and line as the first, a duplicate placement, also 677 days live.
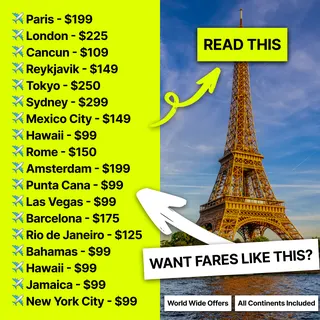 #3677 days liveWeb linkAd copy“Love traveling but strapped for cash? Get mind-blowing flight deals up to 72% off, sent straight to your inbox. Just sign up, choose your departure airport, and watch the magic happen today!”Why it worksThird copy of the 72% off image, 677 days, linking to a web sign-up page.







10 more Meta ads are locked
Unlock freeAds from the Meta Ad Library as of Oct 16, 2026. Store data from the App Store.
Fare List Ads, Five Annual Prices and 677 Day Runners
RatePunk: Cheap Plane Tickets is a Travel app from YARD VENTURE, UAB that finds discounted fares, airline promotions and mistake fares. As of Oct 2026 it makes an estimated $106K a month on an estimated 32K downloads, 1.1x the Travel median revenue. 1,000 active Meta ads put RatePunk at 52.6x the Travel median of 19, with 3 identical image ads promising flight deals up to 72% off that have each run 677 days.
Key takeaways
- 1,000 active Meta ads, 52.6x the Travel median of 19. All 13 top ads link to the web, 8 are image and 4 video, and their median age is 351 days.
- Copy is a price list: the most repeated line, used 8 times, lists roundtrips such as Thailand for $335 and Italy for $303. Only 3 distinct lines cover the top 13.
- 10 in-app purchases at 8 prices, with 5 annual prices from $14.99 to $49.99, a 3.3x spread, plus weekly at $4.99 or $9.99 and an $89.99 Unlimited Access item.
- Over 300 days, estimated revenue rose 170.2% from $39K to $106K and estimated downloads rose 264.3% from 8.7K to 32K.
- 100 of the latest 177 reviews (56.5%) mention price, trial or subscription, 88 of them negative, often doubting that quoted fares can be booked.
Full teardown
Unlock 10 more Meta ads
Unlocked. Everything on this page is open now.
Where RatePunk spends on Meta
Audience and spend estimates built on Meta Ad Library data (reported for ads shown in the EU, with other countries modeled), lifetime of the ads found. The biggest audience is 25-34, taking 25.7% of spend.
Est. spend
$89K
Reach
6.6M
Avg. CPM
$13.43
Ads delivered
869
Spend by age
Spend by gender
Top countries by reach
| Country | Reach | Spend | Share |
|---|---|---|---|
| United States est. | 2.6M | $55,937 | 62.9% |
| United Kingdom | 543.9K | $7,207 | 8.10% |
| Italy | 407.5K | $2,901 | 3.26% |
| Spain | 337.9K | $2,578 | 2.90% |
| Germany | 303.9K | $3,264 | 3.67% |
Rows marked est. are modeled from Ad Library coverage, not reported by Meta.
What RatePunk does differently
Five annual prices, two tiers
3.3x
spread across the annual prices
1,000 ads, three lines of copy
52.6x
active Meta ads vs the Travel median
Image ads that never retire
677 days
oldest top ads, 3 identical images
The measurement gap
56.5%
of recent reviews mention paying
1. Five annual prices, two tiers
RatePunk lists 10 in-app purchases at 8 prices, and the annual tier alone holds 5 of them: $14.99, $19.99, $24.99, $29.99 and $49.99, a 3.3x spread. Item names split the product into Standard Flight Deals and Elite Flight Deals, each with weekly and annual options, plus a monthly Standard plan at $4.99 and an $89.99 Unlimited Access item. The cheapest annual equals 25% of 12 monthly payments, so the year is the obvious buy for anyone who flies twice. A deal service sells a promise of savings, and a buyer who saves on one $303 roundtrip will not argue about $14.99. RatePunk prices the year against a single win the user can count, such as one cheaper flight.
2. 1,000 ads, three lines of copy
With 1,000 active Meta ads against a Travel median of 19, RatePunk runs at 52.6x the category. The copy behind that volume is narrow. Only 3 distinct lines cover the top 13: love traveling but strapped for cash with deals up to 72% off, do not buy a full priced flight ever again, and a list of roundtrip fares used 8 times. The fare list does the selling with numbers, Thailand for $335, Australia for $536, Barbados for $193, so each viewer scans for a place they want to go. All 13 link to a web page, which lets the sign-up happen before the app store. RatePunk's ads show concrete prices, not adjectives.
3. Image ads that never retire
The 3 oldest top ads are the same image and the same line, and each has run 677 days. Two more, the full priced flight ads, have run 599 days, and the fare list set sits at 350 or 351. 8 of the 13 are image and 4 video, a 31% video share, low for a set this size. A deal headline works as a still because the number is the message and needs no motion to explain it. Downloads grew 264.3% over 300 days while these ads kept running, which suggests RatePunk adds new ads beside winners rather than swapping them out. RatePunk treats its first proven image as permanent and tests new ones around it.
4. The measurement gap
RatePunk runs 1,000 Meta ads, all to the web, and sells 5 annual prices. Which ad, the 72% off image or the fare list, brings a subscriber who books a deal and renews, and which brings a buyer who cannot find the fare and leaves a 1-star review? With 88 negative paying mentions, renewal by ad is the question.
How much does RatePunk cost?
10 in-app purchases, 8 distinct prices, annual plans from $14.99 to $49.99. Prices as listed on the US App Store, Oct 16, 2026.
| Weekly | $4.99 · $9.99 |
|---|---|
| Monthly | $4.99 |
| Annual | $14.99 · $19.99 · $24.99 · $29.99 · $49.99 |
| Other | $89.99 |
RatePunk vs the Travel median
| RatePunk | Median | |
|---|---|---|
| Est. monthly revenue | $106K | $100K |
| Downloads / month | 32K | 32K |
| Meta ads running | 1,000 | 19 |
| Rating | 4.7 | 4.7 |
| Lowest annual price | $14.99 | $33.49 |
Median of 13 Travel apps with active Meta ads in our set. See the Travel hub ›
What RatePunk users say about paying
Of the latest 177 reviews (Sep 9, 2022 to Oct 16, 2026), 100 mention price, trial or subscription, 56.5% of the sample, and 88 of those are negative, often saying quoted fares could not be booked. The sample averages 2.17 stars.
Latest 177 US reviews, Sep 9, 2022 to Oct 16, 2026
Mention price, trial or subscription
56%100 of 177 reviews, 88 of them 1 or 2 stars
RatePunk claims they can find “…live fares” that are available at the moment of the search. I’m calling BS. I got a price quote for a flight from RatePunk, and …
I purchased a subscription to Ratepunk, and downloaded the app. The app itself was fine. However, what the company claims to do cannot be done. When I went to b…
How to measure a playbook like RatePunk's
RatePunk runs 1,000 active Meta ads to web sign-up pages and sells annual plans from $14.99 to $49.99. Tying each ad to the annual tier it sells and to renewal is the measurement job.
- 01
Connect RevenueCat to see revenue by channel
Every purchase and renewal joins the install it came from, so each channel shows real revenue, not only installs.
- 02
Compare markets, not only campaigns
With several price points, the same campaign earns different revenue per country. Break revenue down by country and channel together.
- 03
An annual buyer and a monthly buyer look the same at install. Retention by channel shows which source keeps paying.
Measure this on your own app with Airbridge Core
From $40+/mo · 30 days free · no sales call
How we built this teardown
- Revenue and downloads are third-party app intelligence estimates as of Oct 16, 2026. Store intelligence estimates for a single app can be off by 30% or more. Treat them as a range, not a figure from the developer. Daily revenue and download series cover 300 days ending Oct 18, 2026.
- Ads come from the public Meta Ad Library. "Days live" counts days since an ad first appeared. Spend and audience breakdowns start from Meta's EU transparency figures; country splits outside the EU are modeled.
- Prices, ratings and ranks come from the App Store (US storefront) on the same date. Prices differ by country and by paywall offer. Review stats use the latest 177 US reviews from Apple's public review feed.
- Category medians are computed across 13 Travel apps with active Meta ads in our set of 860 subscription apps.
- Written by Hyunjong Choi. Ads, prices and estimates are refreshed every 30 to 90 days. Updated Oct 19, 2026.
Top Travel apps by estimated revenue
All 10 ›| # | App | Est. revenue / mo | Ads live |
|---|---|---|---|
| 1 |  WanderlogVacation and Travel Planner App LLC | $314K | 249 |
| 2 |  MarineTrafficMARINETRAFFIC APPLICATIONS LTD | $200K | 29 |
| 3 |  ATCEnhanced Radar Corporation | $110K | 36 |
| 4 | RatePunkYARD VENTURE, UAB | $106K | 1,000 |
| 5 |  GuideAlongGypsy Guide LLC | $102K | 12 |
Similar apps
 Mapy.com
 Campercontact
Frequently asked questions about RatePunk
How much does RatePunk make?
RatePunk makes an estimated $106K a month on about 32K monthly downloads as of Oct 2026, by third-party estimates. That is 1.1x the Travel category median of $100K.
How much does RatePunk cost?
RatePunk lists 10 in-app purchases at 8 prices: annual plans at $14.99, $19.99, $24.99, $29.99 or $49.99, weekly at $4.99 or $9.99, monthly at $4.99, and $89.99 Unlimited Access.
How many ads does RatePunk run?
1,000 active Meta ads, 52.6x the Travel median of 19. All 13 top ads link to the web, and the oldest have run 677 days.
How fast is RatePunk growing?
Over the 300 days to Oct 18, 2026, estimated revenue rose 170.2% from $39K to $106K a month and estimated downloads rose 264.3% from 8.7K to 32K.
Where is RatePunk most popular?
Its best App Store ranks are #74 in New Zealand and #90 in Australia. 62.9% of estimated Meta spend targets the United States.
What do RatePunk ads say?
The top 13 use 3 lines: flight deals up to 72% off for people strapped for cash, never buy a full priced flight again, and a list of roundtrip fares such as Italy for $303.
Who makes RatePunk?
YARD VENTURE, UAB publishes RatePunk. It launched on Feb 18, 2022, making it 56 months old, and was last updated Oct 15, 2026.
Try Airbridge Core free (no sales call)
The install is visible, the subscriber is not. Airbridge Core closes that gap: connect Meta, TikTok, Google and Apple Ads, add one tracking link per creator, plug in RevenueCat, Superwall or Adapty, and each campaign shows revenue instead of installs. The Core plan starts at $40 a month after 30 free days. Start your free trial.
Start Core free
Hyunjong Choi LinkedIn
Go-to-market, Airbridge Core
Works on go-to-market for Airbridge Core, the self-serve attribution plan for subscription apps. Writes these teardowns from public App Store data, the Meta Ad Library and third-party estimates.
About Airbridge
Airbridge is a mobile measurement partner for Meta, Google, TikTok and Apple Ads, with native RevenueCat, Superwall and Adapty integrations. Subscription teams like NOICE cut measurement setup time by 75% after switching.