
Osta Revenue & Ads
A recipe keeper that imports recipes from social media and websites into one cookbook, with a cooking mode and shared folders.
 Hyunjong Choi
Published Oct 19, 2026Updated Oct 19, 202610 min readFast riser
Est. monthly revenue
$80K
↑ 14.2% vs prev. period
Downloads / month
201K
↑ 99.9% vs prev. period
Rating
4.8
6.8K ratings · #23 in Austria
Meta ads running
12
40 found · median 44
Osta revenue and downloads trend
Est. monthly revenue
$80K ↑ 320.1% in 90 days
Nov 20, 2025: $15Oct 18, 2026
Monthly downloads
201K ↑ 110.1% in 90 days
Nov 20, 2025: 76Oct 18, 2026
Daily third-party estimates, 324 days ending Oct 18, 2026. Revenue changed +531228% and downloads +263992% over the period. Meta ads live went from 14 to 13 between Aug 26, 2026 and Oct 18, 2026.
Osta Meta ads: 12 active, longest running 61 days
Top 13 by days live out of 40 found (13 video and 0 image creatives). Tap any one to open the original in the Meta Ad Library.
 #161 days liveApp StoreAd copy“Import recipes from Instagram, Tiktok & Facebook in seconds!”Why it worksImport recipes from Instagram, TikTok and Facebook in seconds; video to the App Store, 61 days.
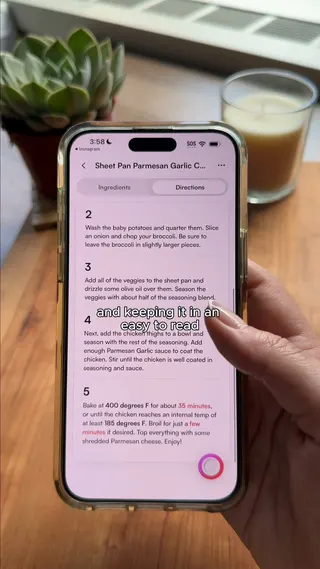 #261 days liveApp StoreAd copy“Import recipes from Instagram, Tiktok & Facebook in seconds!”Why it worksThe same import in seconds line on a second video, live for 61 days.
 #361 days liveApp StoreAd copy“Import recipes from Instagram, Tiktok & Facebook in seconds!”Why it worksA third cut of the import line, also sent to the App Store for 61 days.










10 more Meta ads are locked
Unlock freeAds from the Meta Ad Library as of Oct 16, 2026. Store data from the App Store.
One Import Promise Behind a Fast Install Climb
Osta is a recipe saving app from General Digital Connoisseurs Ltd. that imports recipes from Instagram, TikTok, Facebook and websites. As of Oct 2026 it makes an estimated $80K a month on an estimated 201K downloads. Twelve of its top 13 ads use the same line, import recipes from Instagram, TikTok and Facebook in seconds.
Key takeaways
- Osta pulls an estimated 201K downloads a month, 7.6x the Food & Drink median of 26K, and estimated downloads changed 99.9% against the previous period.
- Revenue is an estimated $80K a month, 2.2x the category median of $36K, at an estimated $0.4 per download.
- 12 of the top 13 ads use one import line, all are video and all link to the App Store.
- In-app purchases include months at $5.99 and $7.99 and years at $39.99, $49.99 and $59.99.
- Its best charts are #23 in Austria, #30 in New Zealand and #31 in the Netherlands.
Full teardown
Unlock 10 more Meta ads
Unlocked. Everything on this page is open now.
Where Osta spends on Meta
Audience and spend estimates built on Meta Ad Library data (reported for ads shown in the EU, with other countries modeled), lifetime of the ads found. The biggest audience is 18-24, taking 62.9% of spend.
Est. spend
$7K
Reach
423.7K
Avg. CPM
$17.25
Ads delivered
40
Spend by age
Spend by gender
Top countries by reach
| Country | Reach | Spend | Share |
|---|---|---|---|
| United States est. | 211.9K | $4,502 | 61.6% |
| United Kingdom | 211.9K | $2,807 | 38.4% |
Rows marked est. are modeled from Ad Library coverage, not reported by Meta.
What Osta does differently
From near zero in 324 days
7.6x
downloads vs Food & Drink median
One line in seconds
12 of 13
top ads share one copy line
Many installs, low value each
$0.4
estimated revenue per download
The measurement gap
201K
estimated monthly downloads
1. From near zero in 324 days
Eighteen months after launch, Osta pulls an estimated 201K downloads a month. The trend shows downloads going from 76 to 201K over 324 days, with a 110.1% rise in the last 90 days alone, and revenue up 320.1% in those 90 days. Live Meta ads stayed small, between 14 and 13 with a peak of 19. Ad counts do not show spend, so paid's share is unknown. The product fits a habit that already exists: people save recipes from social feeds and lose them. A 4.8 rating across 6.8K ratings matches the category median. Osta's market is made by other platforms: every recipe saved on Instagram or TikTok and then lost is a reason to install.
2. One line in seconds
Import recipes from Instagram, TikTok and Facebook in seconds. That line runs on 12 of the top 13 ads, and the 13th drops TikTok from the list. Only 2 distinct lines appear, all 13 are video, and all 13 link to the App Store. The top three have each run 61 days. Naming three apps the viewer already uses tells them where the value comes from without a feature tour. Meta Ad Library spend estimates show a young female audience: women take 85.3% of spend and ages 18 to 24 take 62.9%. Naming the source platforms in the first line lets each viewer picture their own saved posts, and Osta has kept that line on almost every ad.
3. Many installs, low value each
Months at $5.99 and $7.99 and years at $39.99, $49.99 and $59.99 make up the ladder, a 1.5x annual spread, and the cheapest year costs 56% of 12 monthly payments. Product names include Gusta Premium beside Osta Premium, a sign of an earlier brand. Revenue per download is an estimated $0.4, so most users stay free. Reviews show the friction as the app moves toward paid: some long time users call the switch dishonest, others say they bought premium after using it often. Of the latest 175, 50 mention paying. A smaller app growing on a free tool can learn from this: introduce paid limits early, before users treat free as a promise.
4. The measurement gap
Osta grows on one import promise and a young female audience, but earns an estimated $0.4 per download. The question is which source, TikTok users, Instagram users, or markets such as Austria and the Netherlands, brings the cooks who pay for a year, and which brings savers who never leave the free tier.
How much does Osta cost?
8 in-app purchases, 5 distinct prices, annual plans from $39.99 to $59.99. Prices as listed on the US App Store, Oct 16, 2026.
| Monthly | $5.99 · $7.99 |
|---|---|
| Annual | $39.99 · $49.99 · $59.99 |
Osta vs the Food & Drink median
| Osta | Median | |
|---|---|---|
| Est. monthly revenue | $80K | $36K |
| Downloads / month | 201K | 26K |
| Meta ads running | 12 | 44 |
| Rating | 4.8 | 4.8 |
| Lowest annual price | $39.99 | $49.99 |
Median of 10 Food & Drink apps with active Meta ads in our set. See the Food & Drink hub ›
What Osta users say about paying
Of the latest 175 reviews, 50 (28.6%) mention price, trial or subscription, and 32 of those are negative, mostly about a long onboarding and a free app turning to ads and premium.
Latest 175 US reviews, Sep 4, 2025 to Oct 16, 2026
Mention price, trial or subscription
29%50 of 175 reviews, 32 of them 1 or 2 stars
This app is such slop. Why is the onboarding 5 minutes long? Why do they even need that data theres no “app customization based on your preferences”? Shady but …
Dishonest to have a free app for so long and all of the sudden switch to an ad based model. Now no better than the other apps that do the same, but less trust w…
How to measure a playbook like Osta's
Osta grows across markets from Austria to Canada with one import line, so the number that matters is which source brings cooks who pay, not just savers.
- 01
Split installs and revenue by country from day one
When an app climbs the charts in several countries at once, each market needs its own numbers. Every report breaks down by country and channel.
- 02
Measure iOS campaigns without the ATT prompt
SKAdNetwork setup is self-serve, so iOS campaigns still report results when users decline tracking.
- 03
Test new channels with a link, not a project
Create a tracking link for each new test (a creator, a subreddit, a newsletter) and compare it with Meta in the same report.
Measure this on your own app with Airbridge Core
From $40+/mo · 30 days free · no sales call
How we built this teardown
- Revenue and downloads are third-party app intelligence estimates as of Oct 16, 2026. Store intelligence estimates for a single app can be off by 30% or more. Treat them as a range, not a figure from the developer. Daily revenue and download series cover 324 days ending Oct 18, 2026.
- Ads come from the public Meta Ad Library. "Days live" counts days since an ad first appeared. Spend and audience breakdowns start from Meta's EU transparency figures; country splits outside the EU are modeled.
- Prices, ratings and ranks come from the App Store (US storefront) on the same date. Prices differ by country and by paywall offer. Review stats use the latest 175 US reviews from Apple's public review feed.
- Category medians are computed across 10 Food & Drink apps with active Meta ads in our set of 860 subscription apps.
- Written by Hyunjong Choi. Ads, prices and estimates are refreshed every 30 to 90 days. Updated Oct 19, 2026.
Top Food & Drink apps by estimated revenue
All 8 ›| # | App | Est. revenue / mo | Ads live |
|---|---|---|---|
| 1 |  ReciMeReciMe Pty Ltd | $2M | 813 |
| 2 |  VivinoVivino ApS | $319K | 34 |
| 3 |  LocalizeLocalize LLC | $113K | 196 |
| 4 | OstaGeneral Digital Connoisseurs Ltd. | $80K | 12 |
| 5 |  InVintoryInVintory Wines Incorporated | $60K | 88 |
Similar apps
 Scoolinary
 CookShelf
Frequently asked questions about Osta
How much does Osta make?
Osta makes an estimated $80K a month as of Oct 2026, 2.2x the Food & Drink median of $36K. These are third-party estimates, not figures from the developer.
How much does Osta cost?
In-app purchases include monthly plans at $5.99 or $7.99 and yearly plans at $39.99, $49.99 or $59.99 on the US App Store.
How many ads does Osta run?
Osta runs 12 active Meta ads, 0.3x the Food & Drink median of 44, out of 40 found, plus 2 Apple Search Ads creatives.
How fast is Osta growing?
Very fast. Estimated downloads changed 99.9% against the previous period, to 201K a month, and estimated revenue changed 14.2%.
Where is Osta most popular?
Its best chart positions are #23 in Austria, #30 in New Zealand, #31 in the Netherlands, #34 in Canada and #39 in Norway.
Who sees Osta's ads?
In Meta Ad Library spend estimates, women take 85.3% of spend and ages 18 to 24 take 62.9%.
Who makes Osta?
General Digital Connoisseurs Ltd. makes Osta. It launched on Apr 8, 2025 and was last updated on Sep 24, 2026.
Try Airbridge Core free (no sales call)
The install is visible, the subscriber is not. Airbridge Core closes that gap: connect Meta, TikTok, Google and Apple Ads, add one tracking link per creator, plug in RevenueCat, Superwall or Adapty, and each campaign shows revenue instead of installs. The Core plan starts at $40 a month after 30 free days. Start your free trial.
Start Core free
Hyunjong Choi LinkedIn
Go-to-market, Airbridge Core
Works on go-to-market for Airbridge Core, the self-serve attribution plan for subscription apps. Writes these teardowns from public App Store data, the Meta Ad Library and third-party estimates.
About Airbridge
Airbridge is a mobile measurement partner for Meta, Google, TikTok and Apple Ads, with native RevenueCat, Superwall and Adapty integrations. Subscription teams like NOICE cut measurement setup time by 75% after switching.