Hard Paywall vs Freemium in 2026: What 75K Apps Reveal

The average subscription app converts 1.9% of downloads into paying subscribers within the first 35 days. Apps using a hard paywall convert at 12.1%, which is 5.5 times higher, per the RevenueCat State of Subscription Apps 2025 analysis of 75,000+ apps. But hard-gated apps also see refund rates 70% higher than freemium, and many of those installs never come back.
A hard paywall blocks the core app experience behind a subscription. A freemium model offers ongoing free access with paid upgrades later. Trial-inclusive designs sit between them, gating the product after a short evaluation window.
The hard paywall vs freemium 2026 question is not abstract. It is a category-fit decision that shows up in your D35 conversion, your Y1 LTV, and your refund rate. Hard gates win on per-user economics. Freemium wins on volume and category dynamics.
Picking the wrong model can compress your conversion rate by 5x or burn your top-of-funnel. The question is not which is "better." It is which is better for the app you are building.
Key Takeaways
-
Hard paywalls convert 5.5x higher than freemium on D35 download-to-paid. Median rates are 12.1% vs 2.2% (RevenueCat SOSA 2025). This is a survivorship effect: most users who do not pay never return.
-
Hard-gated apps generate 2x the Y1 lifetime value (LTV) per payer. Median $49.30 vs $24.24 (RevenueCat SOSA 2025). Higher prices and self-selecting users compound into stronger lifetime value.
-
Stacked together, hard models deliver ~11x revenue per install. $5.96 vs $0.53 once you multiply conversion by LTV. The economic edge is much larger than the headline 2x suggests.
-
Trial-inclusive paywalls win the most A/B tests. Trial-format screens beat visual-only layouts in 64.5% of head-to-head experiments, per the Adapty State of In-App Subscriptions 2026 report on 16,000+ apps and $3B in revenue.
-
Category dictates the right model. 86% of AI apps skip trials (RevenueCat SOSA 2025), Health & Fitness wins with trial-inclusive (RevenueCat), and Productivity often loses LTV when trials are added (Adapty 2026).
-
Hard model refund rates are 70% higher. 5.8% vs 3.4% for freemium (RevenueCat SOSA 2025). The conversion lift is real but partly clawed back.
5.5x Conversion Gap: The Hard Paywall Number That Hides a Trap
Start with the headline number. Across 75,000+ subscription apps analyzed by RevenueCat in 2025, median D35 download-to-paid conversion rates split sharply by paywall strategy.
| Strategy | Median D35 Conversion | P90 (Top 10%) |
|---|---|---|
| Hard Paywall | 12.1% | 39.0% |
| Freemium | 2.2% | 7.9% |
| All Categories | 1.9% | 8.5% |
Source: RevenueCat State of Subscription Apps 2025 (75K+ apps).
A hard gate pushes more users to a yes/no decision faster. Freemium offers ongoing free access and tries to convert users later. The conversion gap is enormous: 5.5x at the median, and the top 10% of hard-gated apps reach 39%.
But that number hides what is happening underneath. Hard gates do not manufacture purchase intent. They surface it earlier and discard everyone else. Users who would not have converted under freemium also do not convert under a hard model. They churn at the door instead of months later.
This only matters if your acquisition can scale with your model. Most apps cannot 10x install volume by switching to freemium. As the category-fit section later shows, the model is partly determined by what your app does, not by what your spreadsheet wants.
2x LTV, And Why the Gap Compounds With Conversion
Conversion is the first half of the story. Lifetime value is the second.
| Strategy | Y1 LTV per Payer (Median) |
|---|---|
| Hard Paywall | $49.30 |
| Freemium | $24.24 |
Source: RevenueCat State of Subscription Apps 2025.
Hard-gated payers are worth roughly 2x more over their first year. Two mechanisms drive the gap.
1. Price elasticity favors hard gates. Apps that force a paid decision upfront can sustain higher pricing because they are filtering for users with explicit purchase intent. Adapty's 2026 analysis of 16,000+ apps shows high-priced apps generate 3x the LTV of low-priced apps. Hard-gated apps cluster toward the higher-price end of that distribution.
2. Self-selection improves retention. A user who pays before experiencing the product is signaling stronger conviction than a user converted from freemium via aggressive upsells. The same Adapty dataset shows top hard-gated users spend 20 to 33% more than their freemium counterparts on equivalent products.
The compounding effect is the real story. Stacked on the conversion gap, hard models generate roughly 11x revenue per install:
-
Hard: 12.1% × $49.30 = $5.96 per install
-
Freemium: 2.2% × $24.24 = $0.53 per install
The LTV gap multiplies the conversion gap. That is the economic argument. The next section is the case against making the decision on revenue per install alone.
The Hidden Costs of Hard Paywalls: Refunds, Churn, and Top-of-Funnel Loss
Conversion and LTV are the case for hard models. The case against them is quieter but real.
1. Hard Paywall Refund Rates Run 70% Higher
Hard-gated apps see median refund rates of 5.8% versus 3.4% for freemium (RevenueCat SOSA 2025). That is a 70% higher refund rate.
Users who paid before trying are more likely to feel surprise or regret when they realize what they bought. The same dataset shows Education apps already lead refunds at 4.86% and Health & Fitness at 4.71%. Layering a hard gate on top pushes those numbers higher.
A 70% lift in refunds does not erase the LTV advantage. It does mean your reported revenue is more volatile, and your customer support load is heavier.
2. Hard Paywalls Collapse the Top-of-Funnel
The 5.5x conversion lift comes with a corresponding install-to-engagement collapse. Hard-gated apps convert more of who they keep. They keep far fewer. For apps that rely on organic growth, network effects, or referral loops, this is a structural problem.
3. Hard Paywalls Limit Onboarding Optimization Gains
The biggest gains in onboarding optimization come from increasing initial engagement before the monetization gate appears. Hard gates limit how much engagement work you can do, which compresses the gains from the highest-leverage optimization area in subscription apps.
RevenueCat data shows 82% of trials start on Day 0, so placement and first impression are decisive. Hard gates give you less surface area to refine. The paywall flow setup before scaling covers what to instrument before you experiment.
Want to see how Hard paywall vs freemium works with your data?
Get hands-on with Airbridge and see real results.
Try It Free →When Freemium Wins and Why Trial-Inclusive Paywalls Beat Both
Freemium is not the loser in this matchup. It is the right model for a specific set of conditions.
1. When Freemium Beats Hard Paywall
Freemium works when your app has network effects, when users need time to experience value, when you optimize for the long tail, or when you are already at scale.
-
Network-effect apps. Communication, marketplace, and social apps need scale to deliver value. Hard gates kneecap that.
-
Value-over-time apps. Productivity tools that take weeks to integrate into a workflow cannot validate willingness to pay on Day 0.
-
Long-tail monetization. If 1% of your users pay $100/year and the other 99% generate ad revenue, referrals, or content, freemium might be right.
-
At-scale economics. Freemium math works at 1M+ monthly actives. It rarely works at 10K.
The 2026 data shows freemium is not going away. One report, based on 2,900+ subscription apps and 1.7B paid installs, shows hybrid models (subscription + ads, subscription + IAP) growing across nearly every category.
-
Gaming. Subscription + IAP combo moved from 29.5% to 37%, up 25%.
-
Lifestyle. Subscription + ad mix grew roughly 70% in two years (5.4% to 9.2%).
-
Short Drama. Ad monetization rose from near-zero to 7.4%, a new freemium-leaning category.
The future is not "pick one." It is freemium as a base layer with subscription monetization stacked on top.
2. Why Trial-Inclusive Paywalls Win Most A/B Tests
The hard-versus-soft framing often misses the option most successful apps actually use: trial-inclusive paywalls.
In head-to-head A/B tests, trial-format screens win 64.5% of experiments against visual-only layouts (Adapty 2026). Trial-inclusive designs gate the product after a short evaluation window, combining two strengths:
-
The conversion velocity of hard models. Paid decision happens quickly.
-
The lower refund risk of freemium. Users have tried before they buy.
For structured experimentation, the paywall A/B testing setup guide breaks down sample size and duration considerations.
Trial length matters more than design. Apps with 17 to 32 day trials convert at a median 45.7%, nearly double the 26.8% rate of 3 to 7 day trials (RevenueCat SOSA 2025). Counter to most copywriting advice, longer trials do not reduce conversion. They let high-intent users self-confirm at a comfortable pace.
Two categories where trials backfire. Trial-inclusive is not the right call for every app type:
-
AI apps. 86% skip trials and monetize fine because their value is instant and consumable, not gradual (RevenueCat SOSA 2025).
-
Productivity. Adapty's data shows trials can actually hurt LTV: direct purchasers convert at $55.45 vs $40.13 for trial users.
The trial model is the safest default, not the universal answer.
Best Paywall Strategy by App Category in 2026
Strategy interacts with category dynamics. The four cases below cover the four distinct models most subscription apps end up running.
| Category | Best-Fit Model | Why |
|---|---|---|
| Health & Fitness | Trial-Inclusive | 7.8% trial start rate (highest), Y1 LTV $27.21, trial boosts LTV (RevenueCat SOSA 2025) |
| AI Apps | Hard Paywall or No-Trial | 86% skip trials (RevenueCat SOSA 2025); $1.44 install LTV vs $0.84 average (Adapty 2026) |
| Productivity | Direct Purchase | Trial users convert at lower LTV: $40.13 vs $55.45 direct (Adapty 2026) |
| Gaming | Freemium + IAP Hybrid | Trial conversion 19% (lowest), IAP combo up 25% (Adapty 2026) |
The pattern is simple:
-
Hard paywall fits when value is instant or commoditized.
-
Trial-inclusive fits when value is gradual and personal.
-
Freemium fits when scale and engagement compound.
A Health & Fitness app shipping a hard gate is leaving the 39.9% trial-to-paid lift on the table. An AI app with a 30-day trial is giving away free compute to users who would have paid Day 0. The subscription app pricing by category benchmarks help anchor where your prices should land within each vertical.
How to Choose Between Hard Paywall, Freemium, and Trial in 2026
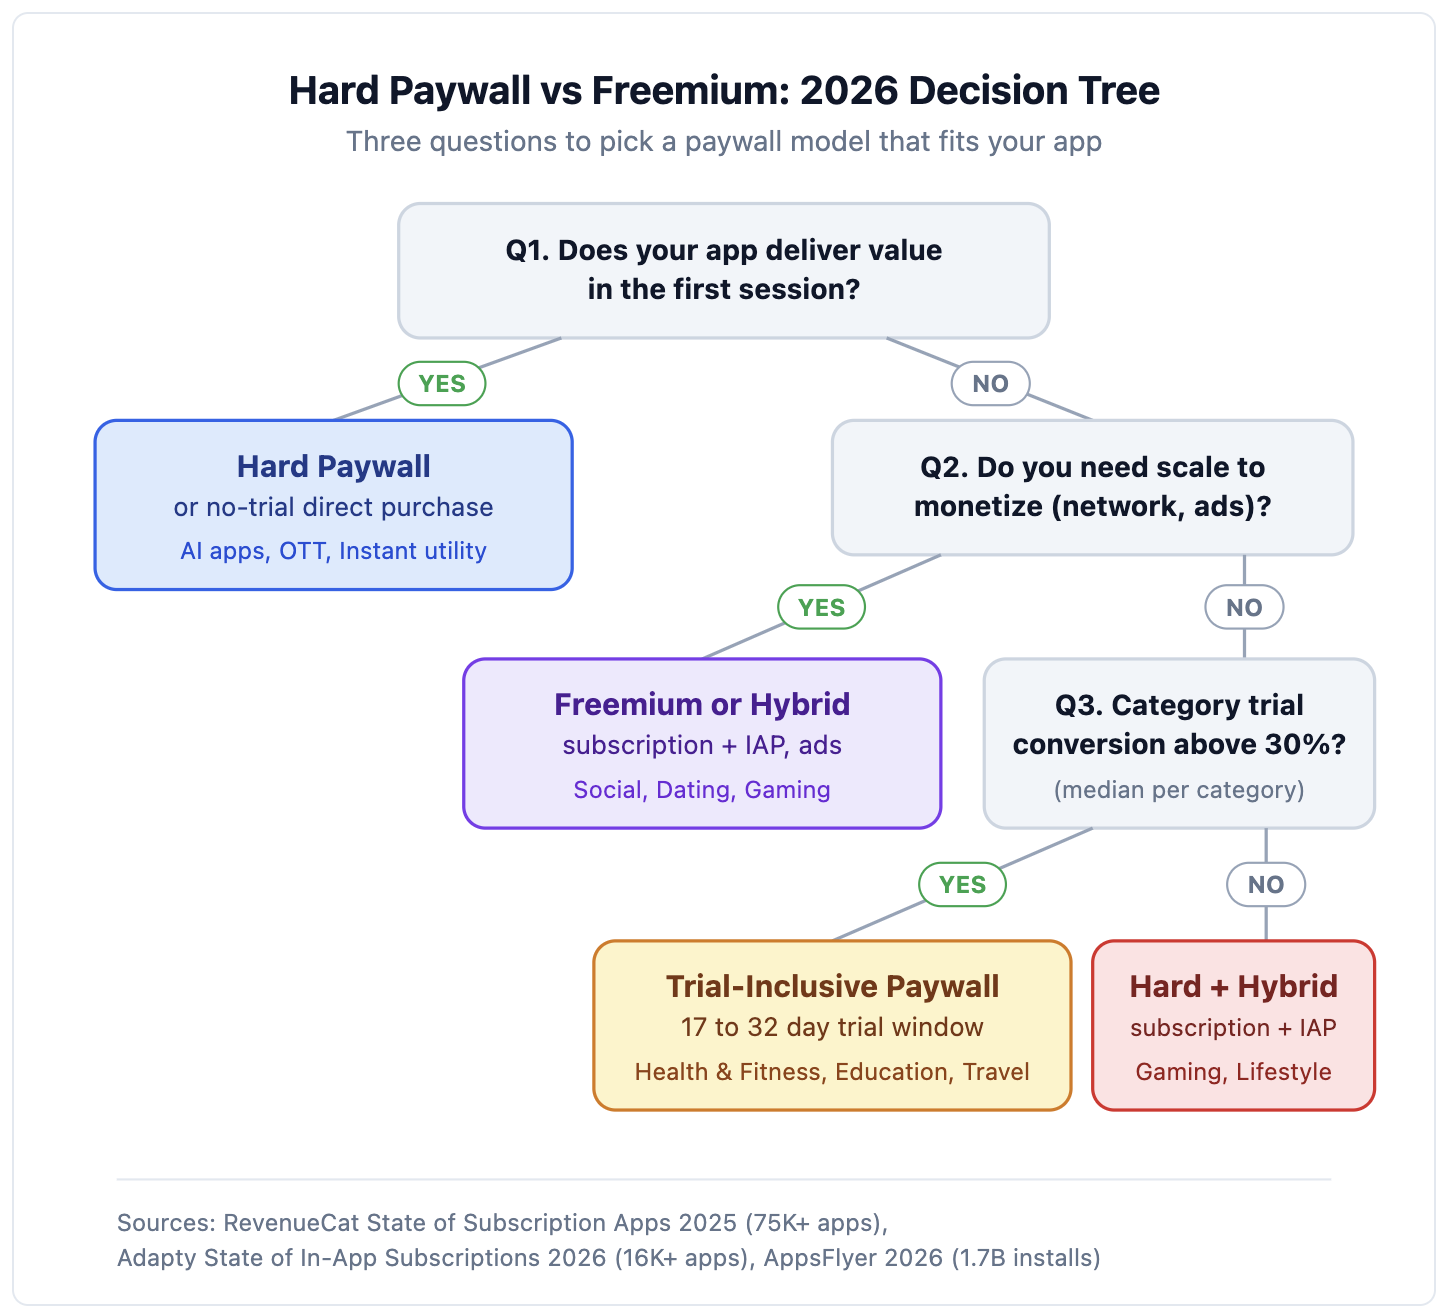
Three questions narrow the field from two religious camps to two or three testable options. The decision tree below visualizes the flow.
-
Does your app deliver value in the first session? Yes points to hard paywall or no-trial direct purchase. AI apps, instant-utility apps, OTT. No points to trial-inclusive or freemium. Fitness, education, productivity.
-
Do you need scale to monetize through network effects, ads, or referral loops? Yes points to freemium or hybrid. Social, dating (lower-end), gaming. No points to hard paywall or trial. Solo-use, premium-positioned apps.
-
Is your category trial conversion rate above or below 30%? Above (Education 42%; Health & Fitness 39.9%, Travel 48.7% per RevenueCat SOSA 2025) points to trial paywall. Below (Gaming 19%) points to skip trials and use hybrid monetization.
The framework will not decide for you. It will narrow your options to a testable set. From there, the right move is a structured paywall experiment.
The 2026 experimentation data is striking:
-
Experimenting teams generate up to 40x more revenue than non-experimenters (Adapty 2026).
-
Price experiments improve LTV 46% of the time even when conversion lifts only 28% of the time (Adapty 2026).
Judge experiments by ARPU, not raw conversion.
The 3-Step Sequence Most Founders Should Ship in 2026
There is no universal default for subscription app monetization in 2026. There is a category-fit decision, a value-delivery question, and a test plan.
The practical sequence for most founders shipping this year is straightforward:
-
Default to a 17 to 32 day trial unless your category data points elsewhere. The data shows this trial length converts at 45.7% median, nearly double the rate of short trials.
-
Validate against your category's benchmarks for D35 conversion, Y1 LTV, and refund rate within 60 days of launch.
-
Run two to three paywall experiments per quarter with ARPU as your decision metric, not raw conversion.
The teams that win in concentrated 2026 markets, where the top 10% of apps now capture 95% of subscription revenue (up from ~85% in prior Adapty cuts), are the ones who measure faster and iterate harder. They treat their paywall as a product surface that ships weekly.
The 2026 winners are not the apps picking the right model on Day 0. They are the apps shipping the next test this quarter.

Ready to transform your mobile growth?
Learn how Airbridge helps leading brands measure and optimize every touchpoint.