How to A/B Test Your Paywall: Setup, Duration, and Results
You already know your paywall needs work. Trial starts are lower than you'd like, the plan mix looks off, or the same design has been live for six months without a meaningful change. Knowing how to A/B test your paywall for subscription apps correctly is what separates teams that iterate toward revenue from teams that run tests and see nothing move.
Apps running 50 or more paywall experiments generate a median 18.7x revenue premium over teams running just one (Adapty State of In-App Subscriptions 2026). That gap doesn't come from a single breakthrough test. It comes from running the right experiments in the right order, measuring what actually matters, and building on each result.
Paywall A/B testing means running two or more versions of your purchase screen simultaneously, routing a random split of users to each variant, and measuring which version drives more subscription revenue per user.
Key Takeaways
-
Test pricing before visuals. Plan and trial duration changes consistently drive more LTV improvement than copy or layout changes. Most teams get this sequence backwards.
-
ARPU is your north-star metric. conversion-rate" class="glossary-link" title="Conversion Rate">Conversion rate tells you how many people bought. ARPU tells you whether those purchases generate revenue. They do not always move together.
-
Set your sample size before you start. You need a meaningful number of paid conversions per variant before results are reliable — the exact threshold depends on your baseline conversion rate and the lift you are trying to detect. Calculate this upfront, not after two weeks have passed.
-
Run most tests for a minimum of 2 weeks. A weekend test does not capture a full weekly cycle of user behavior. Pricing tests often need 4-8 weeks to surface renewal and churn patterns.
-
Define your "done" criteria before looking at results. Decide ship, iterate, or kill thresholds in advance. If you are using a fixed-horizon test, peeking at early data invalidates p-values. Bayesian tools like Adapty allow ongoing monitoring, but stopping decisions based on early results still introduce bias.
Common Paywall A/B Testing Mistakes That Kill Results
Bad paywall tests don't fail because of bad luck. They fail because of decisions made before data collection starts.
Mistake 1: Testing Visuals Before Pricing
The most common mistake is reaching for visual and copy changes first. A new headline, different button color, reshuffled plan layout: these feel manageable and safe to ship. But among subscription apps that run experiments, plan and trial duration changes drive the most LTV improvement, consistently outperforming visual and copy tests in both win rate and revenue impact.
The data is specific. When apps run experiments by category, here is how the LTV uplift win rates compare (Adapty State of In-App Subscriptions 2026):
| Experiment Type | LTV Uplift Win Rate |
|---|---|
| Locale / language changes | 62.3% |
| Trial duration changes | 59.6% |
| Plan count changes | 57.1% |
| Price point changes | 45.5% |
| Visual-only changes | 34.6% |
Visual-only tests have the lowest win rate of any category — lower even than price changes. When you optimize visual conversion before finding the right price, you're routing more users to a potentially underpriced offer. The price is the foundation. Visual changes are the polish. Polish applied to an unvalidated foundation doesn't hold.
Among apps that run pricing experiments, only 28% improved conversion rate. But those that succeeded lifted LTV by an average of ~46% (Adapty State of In-App Subscriptions 2026). Pricing is not the riskiest thing to test. It's the highest-upside lever available, and most teams skip it because it feels more disruptive to touch.
Mistake 2: Stopping the Test Too Early
User behavior on a Saturday looks nothing like behavior on a Tuesday. Weekend users have different intent patterns, different free time, and different willingness to start trials. A test that runs for four days captures a skewed and unrepresentative sample.
A commonly cited minimum threshold for any paywall test is 2 weeks, long enough to cover a full weekly behavior cycle at least twice and smooth out day-of-week variation (Adapty, 2026). Running a test too short is one of the most expensive mistakes in paywall optimization. You ship a variant that "won" in a small sample, only to find months later that it underperforms the control on renewal metrics.
Mistake 3: Tracking Conversion Rate Alone
Conversion rate answers one question: how many users purchased. It doesn't tell you whether those users renewed, what plan they chose, or what the average purchase value was.
ARPU (Average Revenue Per User) captures all three. Two patterns are common. First, a discounted price lifts trial starts but brings in users who churn faster after renewal: conversion goes up but ARPU goes down. Second, a slightly lower conversion rate at a higher price point generates more total revenue per user cohort: conversion is flat or down but ARPU is up. Track both. Optimize for ARPU.
How to Build a Hypothesis for Your Paywall A/B Test
The worst version of paywall testing is opening a dashboard, clicking "create experiment," and choosing a variable because it seems interesting. Random testing generates noise, not insight.
The 3-Part Hypothesis Formula for Paywall Tests
A testable hypothesis has three components: what you're changing, what you expect to happen, and why you expect that outcome based on what you already know. If you cannot articulate all three, the test isn't ready to run yet.
A working hypothesis looks like this: "Changing the default plan from monthly to annual will increase ARPU by 15% or more, because users who encounter annual pricing first are more likely to perceive monthly as expensive by comparison, and anchoring typically shifts plan selection toward annual."
If the "why" section of your hypothesis is empty or vague, that's a signal to do more analysis before testing. A hypothesis without a reason is a guess with extra steps.
The Testing Sequence That Consistently Generates Returns
The teams that generate compounding results from paywall experiments follow a specific order. Pricing first. Trial structure second. Visual and copy changes third.
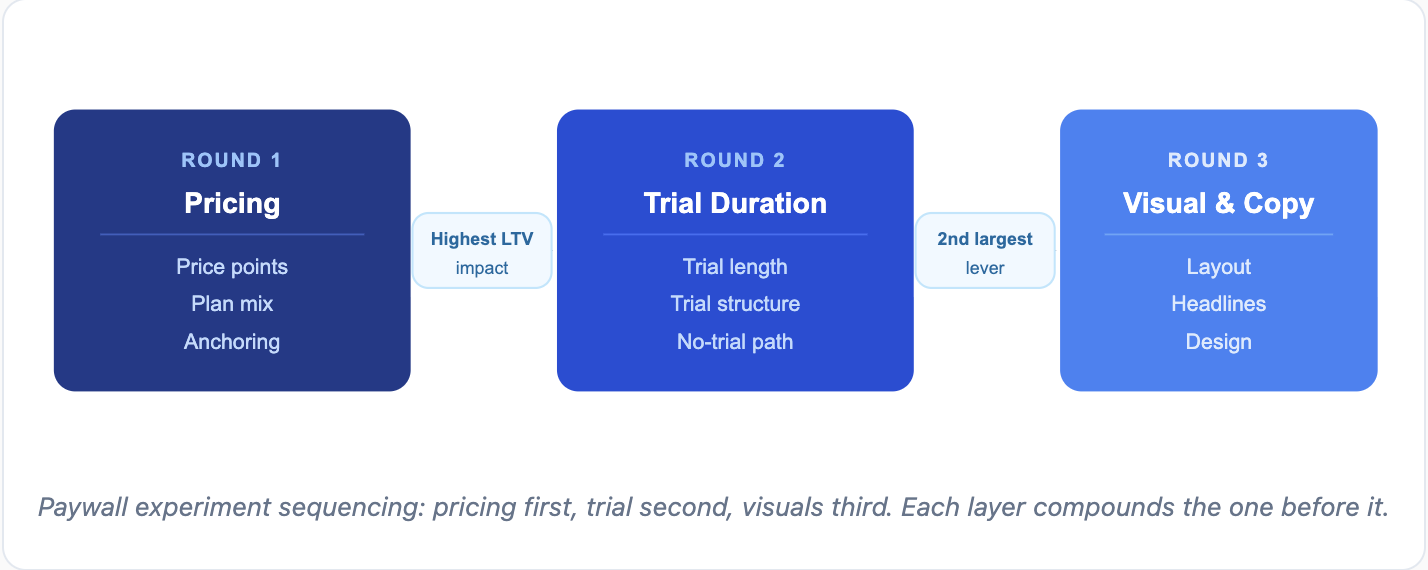
| Round | What to Test | Why This Order |
|---|---|---|
| Round 1 | Pricing (price points, plan mix, anchoring) | Highest LTV impact; all downstream tests interact with pricing |
| Round 2 | Trial duration and structure | Second-largest lever; directly affects trial-to-paid conversion and renewal behavior |
| Round 3 | Visual design, copy, layout | Lowest win rate; only valuable once price and trial are validated |
Testing visuals before pricing means optimizing conversion into an offer that hasn't been validated yet. Each layer affects the next. Add a weekly plan and your annual price perception changes. Raise the annual price and your conversion profile shifts. Get the pricing layer right first, then build on it.
Benchmarks: apps with trial periods in the 17-32 day range convert at a median of 45.7% trial-to-paid, compared to 26.8% for short 3-7 day trials (RevenueCat State of Subscription Apps 2025). Trial duration is not a minor variable: it's the second-most-impactful structural lever available, right after pricing.
Want to see how Paywall works with your data?
Get hands-on with Airbridge and see real results.
Try It Free →How to Set Up a Paywall A/B Test Step by Step
Once you have a hypothesis, the setup is straightforward. The discipline is in what you choose not to do.
Step 1: Isolate One Variable Per Test
This rule exists for a reason. If you change the headline, price, and trial length simultaneously, you cannot isolate what drove the result. Every experiment should change exactly one thing: one price point, one trial length, one layout element.
If you want to move faster, run multiple experiments on separate user segments. Do not combine variables in a single test. A result from a multi-variable test tells you that some combination of changes worked. It does not tell you which element to keep.
Step 2: Choose a Paywall Experiment Platform
Paywall A/B testing requires a tool that randomly assigns users to variants and tracks the full subscription funnel: trial start, paid conversion, and renewal, broken down by variant. Three platforms subscription apps commonly use:
-
RevenueCat Experiments runs tests based on Offerings (combinations of price points, trial lengths, and plan structures). It supports up to four variants per experiment (A/B/C/D) and surfaces full-funnel analytics including LTV and renewal rates by variant.
-
Adapty provides a no-code experiment builder with a visual paywall editor. It tracks conversion, LTV, and revenue by variant and allows you to ship paywall changes without a new app release.
-
Superwall is purpose-built for paywall experimentation, with percentage-based traffic allocation and a visual editor for designing variants. It suits teams running frequent, rapid experiments.
The right tool depends on your existing subscription infrastructure. If subscriptions are managed in RevenueCat, use RevenueCat Experiments. If you use Adapty, use its built-in experiment tools. Keeping subscription data and experiment data in the same platform avoids reconciliation errors.
Step 3: Calculate Sample Size Before You Launch
Sample size is not a guess. You can calculate it using your baseline conversion rate and the minimum improvement you want to detect. A practical floor: at least 200 paid conversion events per variant is enough to detect a large lift of 20% or more. For smaller improvements — which most real pricing changes produce — you will typically need several thousand visitors per variant (Adapty Experiments Playbook). Use an A/B test sample size calculator before you start, not after.
For an app converting downloads to paid at 2%, detecting a 10% relative improvement requires roughly 30,000 users per variant. For an app at 5%, it's proportionally less. Run this calculation before launching the test. If your traffic volume means reaching significance will take six months, either narrow your test to a higher-converting segment or reconsider the experiment timeline. A test you cannot complete is not worth starting.
How Long Should You Run a Paywall A/B Test?
Test duration and sample size are related but distinct. Both must be sufficient for results to be trustworthy.
The Minimum: 2 Weeks and Sufficient Paid Conversions Per Variant
Two weeks is the floor, not the target. The requirement is to satisfy both conditions simultaneously: at least 2 calendar weeks and enough paid conversions per variant to detect the lift you care about. The slower condition determines when the test is done.
If your app reaches your conversion threshold in five days, don't stop at five days. Continue to two weeks. If your app takes six weeks to reach the threshold, don't stop at two weeks. Continue to the sample threshold. Both conditions must be met before you trust a result.
Pricing Tests Need 4 to 8 Weeks to Show Renewal Patterns
A conversion rate result tells you what happened at the moment of purchase. A pricing test is about more than that. It's about whether the users who bought at the new price are renewing and churning at comparable rates to the control group. That behavior only becomes visible after at least one billing cycle has passed.
For any test that changes a price point, plan for 4-8 weeks of data collection to capture at least one renewal cycle per variant (Adapty Experiments Playbook). A monthly subscriber who converts in week one hits their first renewal in weeks four or five. If you declare a winner before that data exists, you're working with half the picture.
Nearly 30% of annual subscriptions cancel in the first month (RevenueCat State of Subscription Apps 2025). That signal only appears if you wait for it. For more on how retention rates behave across plan types, the benchmarks are worth reviewing before setting your evaluation window.
When to Stop a Test Early (and When to Keep Going)
Stopping early because one variant looks like it's winning is usually a mistake. Early results are often shaped by novelty effects: users encountering a new layout for the first time behave differently than the broader population would over time. The fix is simple: set your duration in advance and do not look at results until both the time and sample thresholds are met.
Two legitimate reasons to stop early: one variant is producing materially lower revenue at statistical significance, which warrants protecting the control; or you have hit both your sample threshold and your time threshold simultaneously, and results are conclusive in both conversion and ARPU.
How to Read Paywall A/B Test Results Without Being Misled
Why ARPU Is the North-Star Metric for Paywall Tests
ARPU is the one number that simultaneously reflects conversion rate, price level, and plan mix. A test result showing higher conversion but lower ARPU is not a win. It means more users bought at a lower effective value per user.
| Conversion | ARPU | Decision | Next Step |
|---|---|---|---|
| ↑ Up | ↑ Up | Ship it | Deploy the variant to all users |
| ↓ Down | ↓ Down | Kill it | Return to control and revise the hypothesis |
| ↑ Up | ↔ Flat | Iterate | Check plan mix and post-trial churn by segment |
| ↑ Up | ↓ Down | Kill or iterate | Revenue is falling; revert unless the discount was intentional |
| ↔ Flat or slightly down | ↑ Up | Likely a win | Verify renewal rates before shipping |
| Mixed by segment | Mixed | Segment first | Analyze by platform and region before deciding |
Segment by Platform and Region Before Declaring a Winner
A winning variant at the aggregate level can be a losing variant for your highest-value users. Before shipping any result, break down the numbers by at least two dimensions: platform (iOS vs Android) and geography.
Among subscription apps analyzed across more than 75,000 apps, trial-to-paid conversion rates vary significantly by region: North America converts at approximately 35.5%, while South and Southeast Asia convert at around 15.9% (RevenueCat State of Subscription Apps 2025). A test variant that wins in aggregate may be dragged upward by North American users while losing in every other market you care about.
Also segment by acquisition source if you have sufficient volume. Users from paid acquisition channels tend to show different price sensitivity than users from organic or referral sources.
Set Your Decision Criteria Before the Test Starts
Decision criteria set in advance are immune to confirmation bias. Criteria set after looking at early data are not. Before launching any paywall test, write down three explicit thresholds:
-
Ship if: ARPU improves by X% at 95% or higher statistical confidence over the required test duration.
-
Iterate if: ARPU is flat but conversion rate changes significantly, indicating a possible offer structure issue worth exploring in a follow-up test.
-
Kill if: ARPU declines or conversion falls below the control by a meaningful margin at statistical significance.
Once those thresholds are written and agreed before launch, the data tells you what to do. You don't have to decide in the moment.
What a Paywall Experimentation Roadmap Looks Like
Apps running 50 or more paywall experiments generate that 18.7x median revenue premium over apps running just one (Adapty State of In-App Subscriptions 2026). The gap is not explained by any single winning test. It's explained by compounding: each experiment teaches you something that makes the next one more targeted and more likely to produce a meaningful result.
Among subscription apps that actively experiment, the average team runs 14.7 experiments per year, roughly one test every 3 to 4 weeks (Adapty State of In-App Subscriptions 2026). At that cadence, a practical roadmap looks like this:
In the first three months, focus on establishing the pricing baseline. Test one or two price points against your current control. Once pricing is validated, move to trial duration. After pricing and trial structure are settled, test visual and copy elements. Each round compounds the one before it. Pricing optimized at the wrong trial length will give you different results than pricing optimized at the right one. Sequence matters.
Your First Paywall A/B Test Builds the Entire System
Here is what the first test actually requires: pick one pricing variable you have never tested, write a full three-part hypothesis before opening any tool, and calculate the sample size your traffic volume can actually reach in a reasonable timeline. Set a fixed duration before the test starts. Write down the ARPU threshold that constitutes a win.
That is the whole system. Every subsequent test builds on what this one teaches you. The teams running 14.7 experiments per year are not running more sophisticated experiments than you. They are running the same simple loop faster, with tighter hypotheses each time, because they have done it enough that the setup is automatic.
Start with pricing. Measure ARPU. Wait long enough to trust the result. Then build on it.


Ready to transform your mobile growth?
Learn how Airbridge helps leading brands measure and optimize every touchpoint.