Subscription App Pricing by Category: 2026 Benchmarks

Subscription app pricing benchmarks can tell you where your app stands relative to the market. They show what Health & Fitness apps charge, how Gaming compares to Education, and what annual vs. monthly pricing looks like across the industry.
But benchmarks alone won't tell you whether your subscription app pricing is actually working once users arrive from paid ads. That question requires a different kind of data.
Key Takeaways
-
The most common monthly price is $9.99, but the market median is $6.68. The most common price sits at the top quarter of the market, not the middle.
-
Category benchmarks matter more than overall medians. Health & Fitness monthly median is $9.70 vs Gaming's $4.99. Using the wrong benchmark mispositions your app pricing by more than 2x.
-
Annual subscribers retain at 44.1% after 12 months vs 17.5% for monthly. Which billing period your UA channels drive directly determines your LTV trajectory.
-
Higher-priced apps convert at higher rates, not lower. High-priced apps hit 2.7% D35 download-to-paid conversion vs 1.5% for low-priced, because higher prices pre-filter for purchase intent.
-
Teams running structured pricing experiments generate up to 40x more revenue. Revenue per install at Day 30, not same-day conversion, is the right metric to judge price tests.
What Subscription Apps Actually Charge in 2026
Across 75,000+ subscription apps generating over $10B in annual revenue, here is how subscription app pricing by category breaks down across plan types in 2026:
| Plan | Bottom 25% | Median | Most Common | Top 25% | P90 |
|---|---|---|---|---|---|
| Weekly | $3.08 | $4.99 | $4.99 | $6.99 | $9.99 |
| Monthly | $3.26 | $6.68 | $9.99 | $11.99 | $19.99 |
| Annual | $17.59 | $29.99 | $29.99 | $54.99 | $89.99 |
Source: RevenueCat State of Subscription Apps 2025, 75,000+ apps, 2024 data
Monthly app pricing shows a notable split. The median is $6.68, but the most common price point is $9.99. Many apps anchor at $9.99 because competitors do. But half the market charges under $6.68. Apps pricing at $9.99 are in the top quartile, not the middle. On average, apps offer a 67% discount on annual vs equivalent monthly pricing.
The overall medians provide a directional baseline. Category-level subscription app pricing is what actually informs decisions:
| Category | Weekly Median | Monthly Median | Annual Median |
|---|---|---|---|
| Health & Fitness | $4.99 | $9.70 | $39.99 |
| Education | $5.99 | $8.38 | $44.99 |
| Business | $6.15 | $7.58 | $37.50 |
| Gaming | $4.99 | $4.99 | $20.55 |
Source: RevenueCat State of Subscription Apps 2025, 75,000+ apps, 2024 data
A few patterns stand out:
-
Education leads with the highest annual median ($44.99), more than double Gaming's ($20.55).
-
Health & Fitness monthly pricing ($9.70) is nearly double Gaming's monthly median ($4.99).
-
Business leads in weekly pricing at $6.15, reflecting professional daily use patterns.
-
An app priced well below its category median may be leaving revenue on the table, not just competing on price.
Billing Period by Category: The LTV Multiplier
The plan type your category defaults to is one of the strongest drivers of long-term revenue. With pricing held constant, billing period alone creates a roughly 3x LTV gap between annual and monthly subscribers:
-
Annual subscribers retain at 44.1% after 12 months.
-
Monthly subscribers retain at 17.5% after 12 months.
-
Weekly subscribers retain at 3.4% after 12 months.
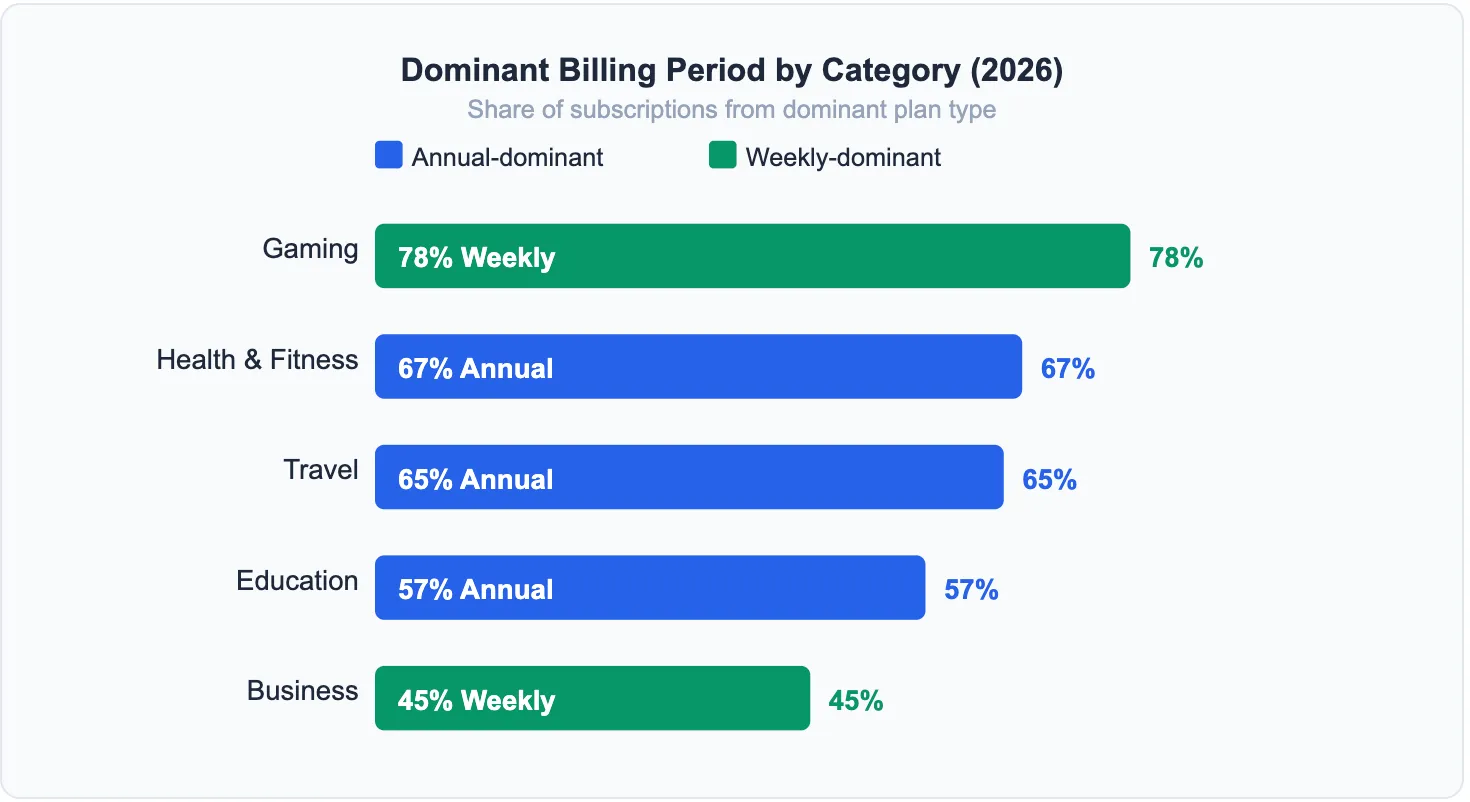
Annual-dominant categories (annual plan is the primary revenue vehicle):
-
Health & Fitness: 67% annual
-
Travel: 65% annual
-
Education: 57% annual
Weekly-dominant categories (first renewal is the critical moment):
-
Gaming: 78% weekly
-
Business: 45% weekly
-
Social & Lifestyle: 45% weekly
In annual-dominant categories, the annual plan is the primary revenue and retention vehicle, not an upsell. In weekly-dominant categories, only 51.8% of subscribers renew after the first billing cycle, making the first week the highest-risk period in the subscriber lifecycle.
For paid UA, this distinction matters directly. A channel that drives weekly subscribers in a Health & Fitness app generates roughly one-third the LTV of a channel driving annual subscribers at the same cost per install.
Price, Conversion, and LTV: The Counterintuitive Data
The assumption that lower app pricing drives higher conversion and more revenue does not hold in the data from tens of thousands of subscription apps. Three findings stand out:
-
Higher-priced apps convert at a higher rate. High-priced apps hit 2.7% D35 download-to-paid conversion vs 1.5% for low-priced apps. Higher prices pre-filter installs toward users with stronger purchase intent.
-
High-priced apps generate Y1 LTV 7x greater than low-priced apps per paying subscriber.
-
Price experiments improve LTV in 46% of tests, but conversion in only 28%. Judging a price test by same-day conversion leads to the wrong conclusion most of the time. (Adapty 2026)
The paywall model compounds this effect significantly:
| Model | D35 Download-to-Paid | Median Y1 LTV per Payer |
|---|---|---|
| Hard Paywall | 12.1% | $49.30 |
| Freemium | 2.2% | $24.24 |
Source: RevenueCat State of Subscription Apps 2025, 75,000+ apps, 2024 data
Hard paywalls convert at 5.5x the rate of freemium and produce 2x the LTV per subscriber. The trade-off is a 1.7x higher refund rate. For paid acquisition, hard paywall apps can typically sustain higher CPIs because the downstream LTV justifies the cost. Freemium apps need lower CPIs to maintain positive unit economics, because fewer installs become subscribers and each generates lower LTV.
Teams that run structured pricing experiments generate up to 40x more revenue than those that don't. (Adapty 2026) The right metric to judge those experiments is revenue per install at Day 30 and Day 60, not same-day conversion rate.
The benchmarks above tell you what the category does. They give you reference points for pricing, billing period norms, and the LTV levels your vertical typically achieves. That context is genuinely useful: it tells you whether you're priced at, above, or below your category median, and what the gap costs you in retention.
But they can't answer the question that matters most for early-stage apps spending real money on paid UA: are your paid users actually starting trials, becoming subscribers, and generating enough revenue to justify your acquisition cost? That question requires your own data, and most early-stage apps don't have it connected the right way.
Want to see how App pricing works with your data?
Get hands-on with Airbridge and see real results.
Try It Free →Pricing Benchmarks vs. Paid Acquisition Reality
Knowing where your subscription app pricing stands against the Health & Fitness annual median of $39.99 is useful context. Knowing whether your Meta campaigns are producing subscribers at that price point, and what their 30-day revenue looks like compared to your acquisition cost, is what drives actual budget decisions.
For early-stage subscription apps, the gap between "we know the category benchmark" and "we know our own numbers" is usually wide. Installs are tracked. Revenue appears in the app store. What's missing is the chain between them: which campaigns drove trial starts, which trials converted to subscribers, what billing period those subscribers are on, and what the revenue per install looks like by channel.
The Funnel You're Flying Blind Through
Most early-stage apps running paid UA have clear visibility at the top of the funnel: install volume and install cost. The data goes dark from there. Consider what you typically can't see:
-
How many of last week's installs actually started a trial?
-
Which specific campaign drove those trial starts?
-
Were those trial users on the $9.99 monthly plan or the $39.99 annual?
-
What does their Day 30 revenue look like compared to the CPI you paid?
Without closing this gap, benchmark comparisons become one-sided. You can see that high-priced apps in your category convert at 2.7%. You cannot see whether your app is at 2.7%, 0.9%, or 4.1%, or which of your campaigns is responsible for the difference.
The Number That Connects Pricing to UA Spend: CPS vs LTV
Cost per subscriber (CPS) is the metric that determines whether your app pricing makes economic sense in a paid acquisition context. It answers one question: for every dollar spent on paid UA, how much does it cost to produce one paying subscriber?
When you set CPS next to your category's LTV benchmark, you have a direct unit economics check. The benchmark data in this article gives you the LTV side. The missing piece is your actual CPS by channel.
| Scenario | CPS (your data) | H&F Y1 LTV Median | Unit Economics |
|---|---|---|---|
| Scalable | $9 | $27.21 | 3x return. Scale it. |
| Break-even | $25 | $27.21 | Marginal. Optimize first. |
| Unsustainable | $42 | $27.21 | Acquiring at a loss. |
H&F Y1 LTV median ($27.21) from RevenueCat SOSA 2025. Hard paywall apps specifically reach $49.30 median. CPS figures are illustrative scenarios.
The answer is almost always different by channel. Your Meta CPS may be $12 while your Apple Search Ads CPS is $9. Your Google campaigns may drive annual subscribers while your TikTok campaigns drive weekly ones. At Health & Fitness category medians, that billing period difference alone represents roughly a 3x gap in LTV. Without breaking down CPS and billing period by channel, you are optimizing for install volume rather than subscription economics.
Example: A Health & Fitness app spending equally across Meta and Apple Search Ads may find that Meta drives more installs at a lower CPI, but ASA drives annual subscribers whose LTV justifies a higher CPI. Rebalancing budget toward ASA increases CPS per channel but reduces total CPS per annual subscriber. At the same total spend, the outcome improves.
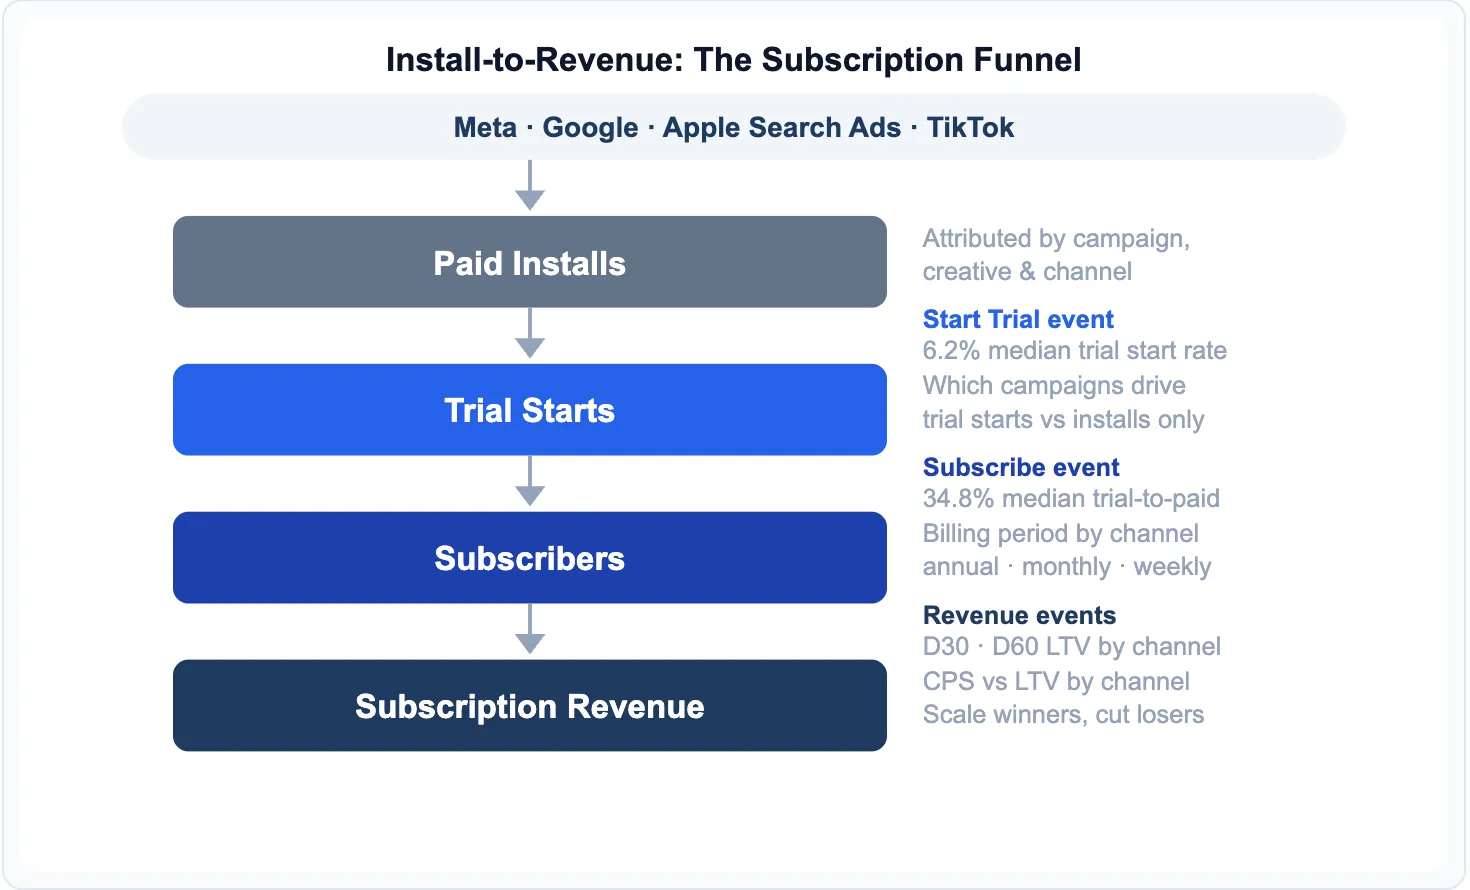
How Airbridge Core Plan Connects the Dots
Airbridge Core Plan is built for early-stage subscription apps that want to move beyond install tracking and see whether their paid acquisition is actually working.
It connects four ad channels (Meta, Google, Apple Search Ads, and TikTok) to subscription events, including Start Trial, Subscribe, and Unsubscribe. If you're using RevenueCat or Adapty for subscription management, Core Plan integrates directly. Your subscription revenue data connects to your campaign data without custom backend engineering.
After setup, you can answer questions like:
-
Which Meta campaigns produce trial starts, and which drive installs that never convert?
-
Are your Google campaigns producing annual subscribers or weekly ones? The LTV difference at Health & Fitness medians is roughly 3x.
-
What is your actual CPS by channel, and how does it compare to your category's LTV benchmark?
-
Which creative drives the highest Day 60 revenue per install?
If you're spending on Meta, Google, Apple Search Ads, or TikTok and want to see whether those campaigns are producing subscribers at your category's LTV benchmark, Airbridge Core Plan connects the full subscription funnel to your paid campaigns.
Start free with 15,000 attributed installs. Pay-as-you-go after that. No annual contract.
The Gap Between a Benchmark and a Result
Most subscription apps treat pricing as a decision you make once. The teams that outperform their category medians treat it as an ongoing experiment. They track CPS by channel, measure revenue per install at Day 30 and Day 60, and run structured tests against benchmarks they actually understand.
The benchmark tells you where the category sits. Your subscription funnel data tells you whether your app is getting there. Connecting the two is what turns a pricing decision into a pricing strategy.


Ready to transform your mobile growth?
Learn how Airbridge helps leading brands measure and optimize every touchpoint.