Build or Buy? Joining Subscription, App Store and Ad Spend Data in One Dashboard

On this page
Should you build or buy your app growth dashboard?
More app teams build their own growth dashboards than ever. One founder described a React tool that pulls together subscription, App Store, product analytics and ad platform data. Another told us his team now handles most monitoring with dashboards they built using an AI assistant: "we claude-dashboard our way through most of our monitoring now :)". Others keep a strict spreadsheet updated every week.
Building has never been easier. The question is whether keeping it right every week is worth your team's time.
What a growth dashboard needs to answer
Most subscription teams want the same handful of answers:
-
How much did we spend, by channel and campaign?
-
How many installs, trials and subscribers did each one bring?
-
What's our cost per trial and cost per subscriber by channel?
-
How much revenue did each cohort bring over time, after refunds?
The first and last questions are easy to build. The middle two need attribution: connecting each user to the campaign that brought them.
The four hidden costs of building
| Hidden cost | What it involves |
|---|---|
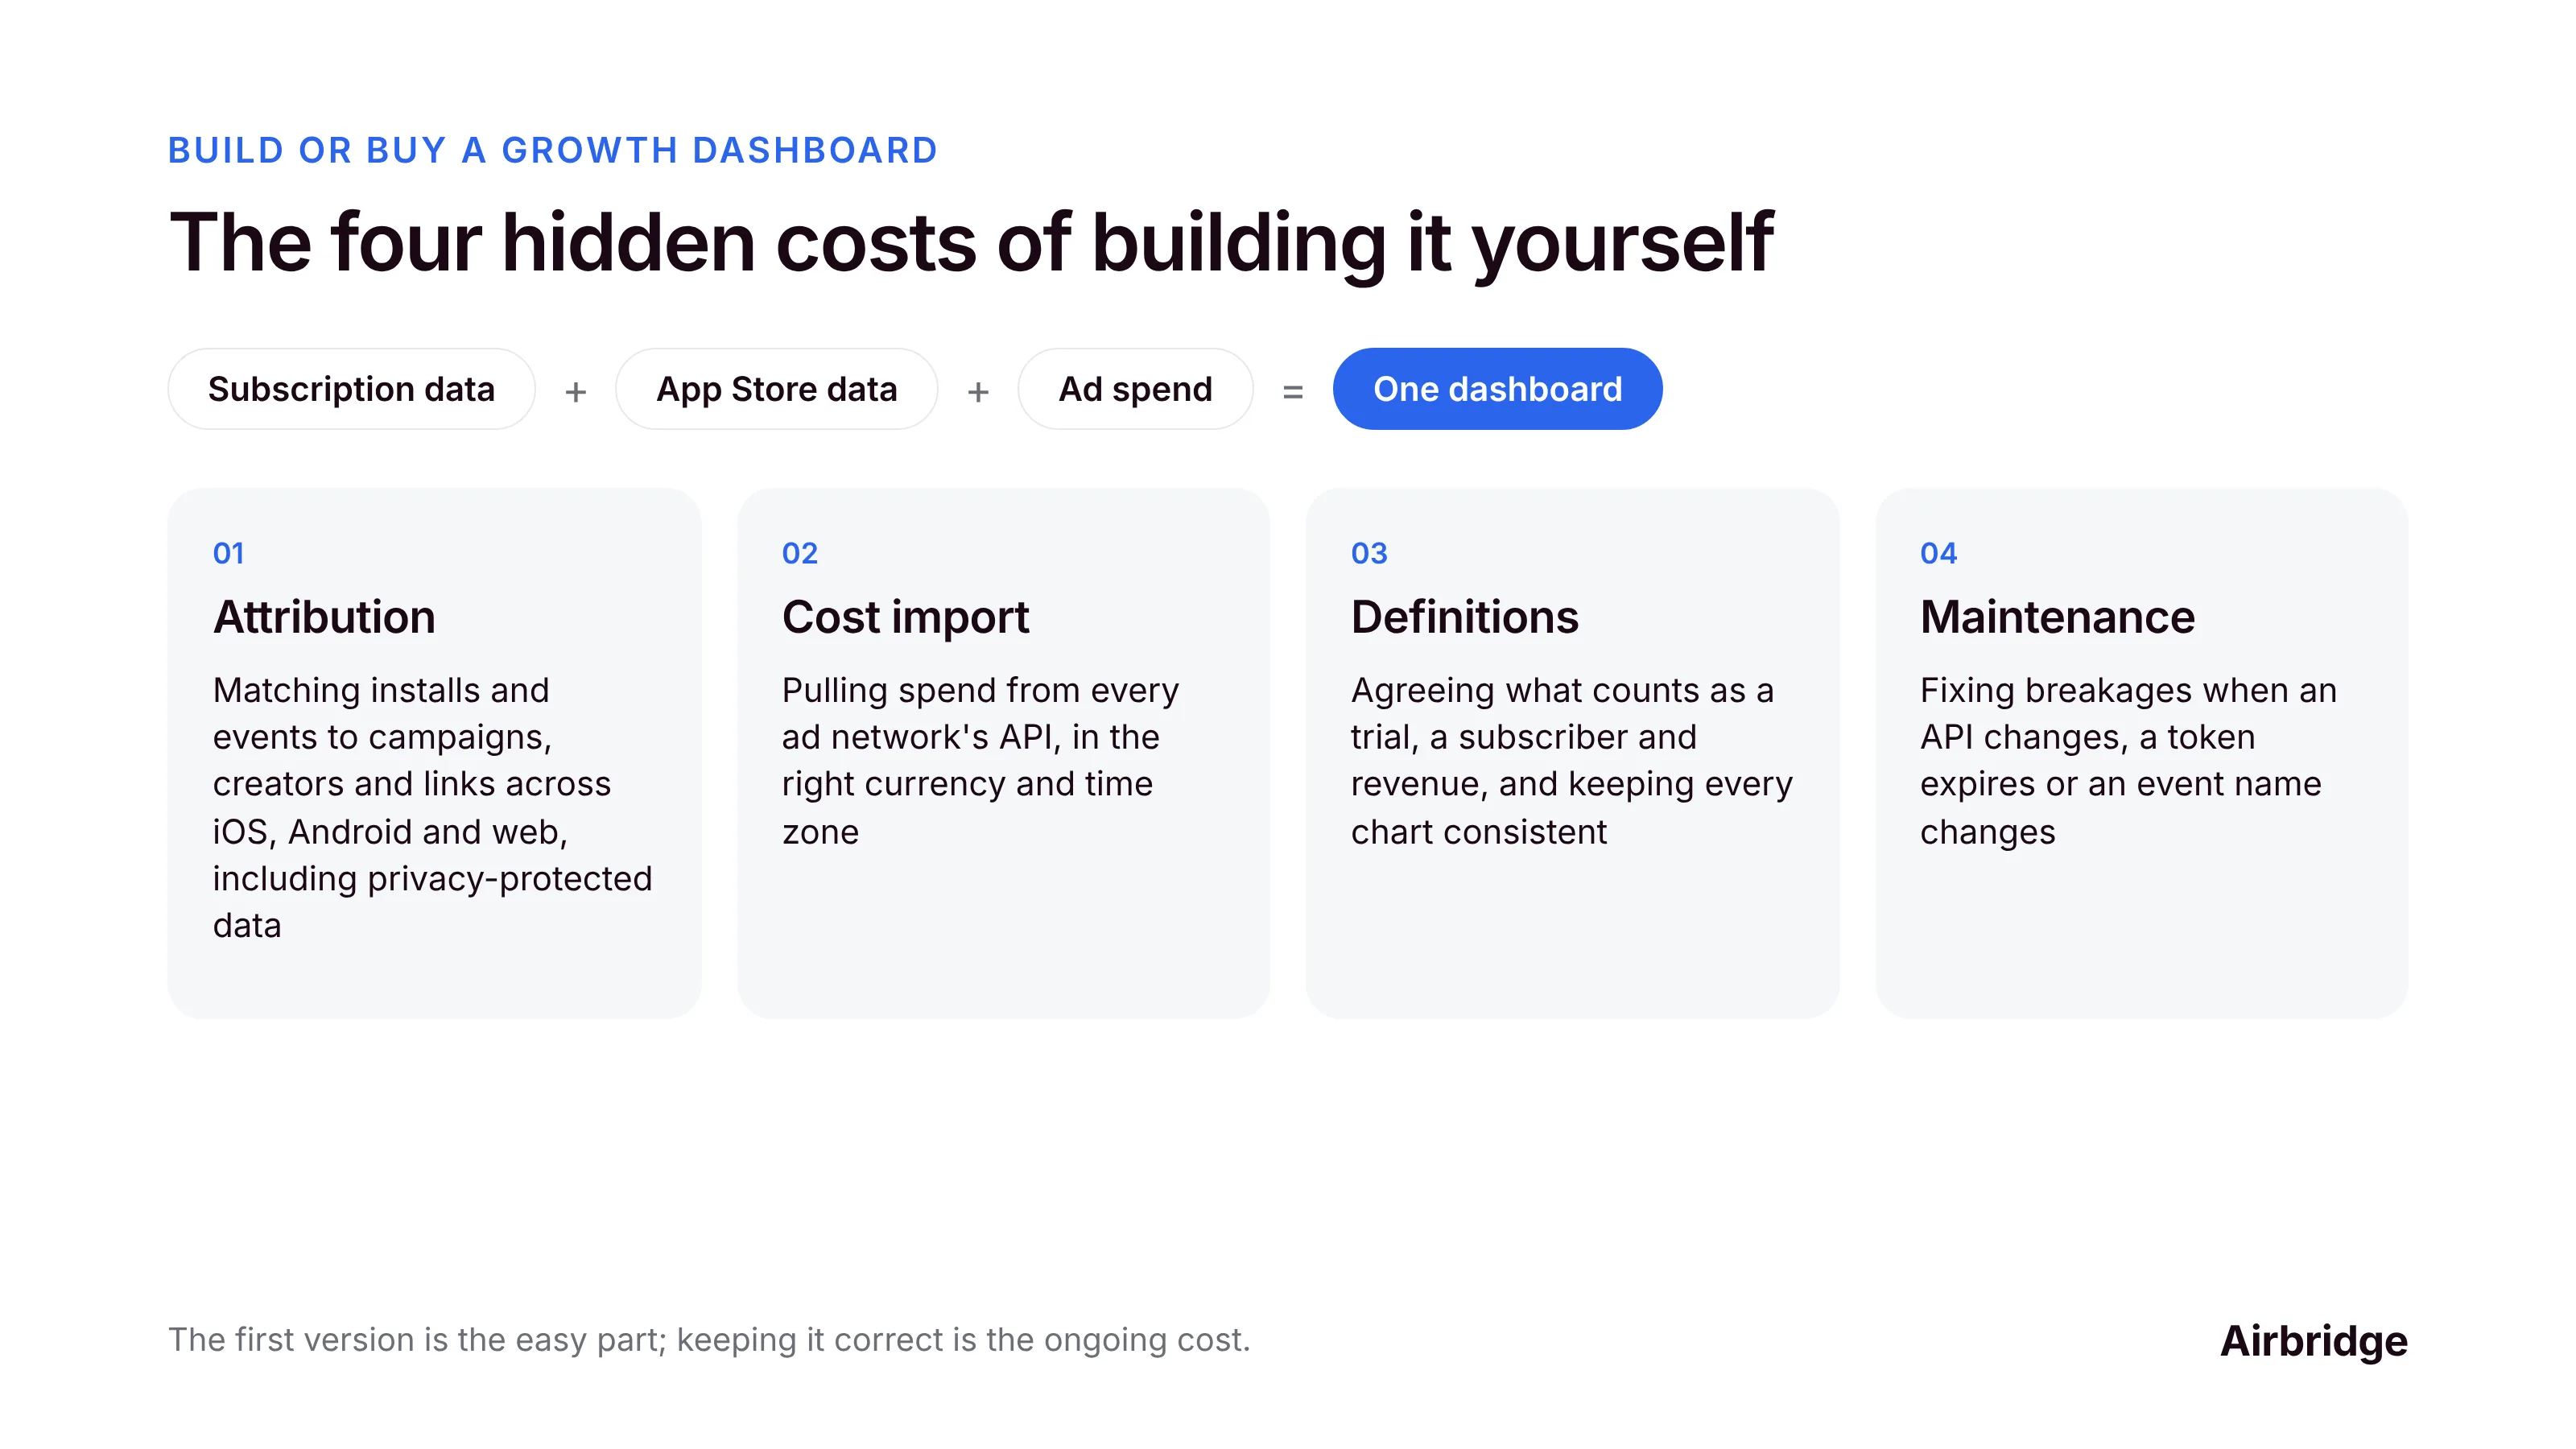
| Attribution | Matching installs and events to campaigns, creators and links across iOS, Android and web, including privacy-protected data |
| Cost import | Pulling spend from every ad network's API, in the right currency and time zone |
| Definitions | Agreeing what counts as a trial, a subscriber and revenue (gross, net, after refunds) and keeping every chart consistent |
| Maintenance | Fixing breakages when an API changes, a token expires or an event name changes |
The first version takes a weekend. The ongoing cost is a few hours every week, usually from your most technical person.
When building makes sense
-
One or two paid channels, each with clear in-platform reporting.
-
A stable set of events and plans.
-
Someone on the team who likes owning data and has time for it.
-
Questions that are mostly about revenue and product, not about which campaign brought whom.
Want to see how Build vs buy marketing dashboard for apps works with your data?
Get hands-on with Airbridge and see real results.
Try It Free →When buying (or combining) makes sense
-
Three or more channels, or any creator and influencer spend.
-
You need user-level attribution across iOS, Android and web.
-
You want ad platforms to receive attributed events for optimization.
-
The dashboard broke more than once last quarter.
-
Your most technical person is spending more time on reporting than on the product.
Many teams combine both: an attribution tool handles the hard joins, and they still build custom views on top using exported data.
A middle path
-
Keep your subscription platform as the revenue source of truth.
-
Use an attribution tool for the user-to-campaign join and for importing ad costs.
-
Export raw data into your warehouse or spreadsheet.
-
Build your own views for the questions unique to your business.
This keeps the flexibility of building without owning the parts that break most often.
Decision summary
-
Build when you have one or two channels, a stable setup and someone who enjoys owning data.
-
Buy, or combine both, when you run several channels, pay creators, need user-level attribution across platforms, or find the dashboard breaking every few weeks.
-
The hard part isn't the charts. It's attribution, cost import, definitions and maintenance.
Build vs. buy FAQ
Should I build my own app marketing dashboard?
It can work well with one or two channels, stable events and someone to maintain it. As channels, creators and platforms grow, attribution and maintenance usually make a tool worth it.
What's the hardest part of building a growth dashboard?
Attribution: connecting each user to the campaign, creator or link that brought them across platforms. Charts and revenue totals are the easy part.
Can I combine an attribution tool with my own dashboard?
Yes. Many teams use an attribution tool for joins and cost import, then export raw data to build their own views.
How do I know my homemade dashboard is no longer worth it?
When it breaks often, when someone spends hours a week maintaining it, or when it can't answer which campaigns bring your best subscribers.
What data sources should a subscription app dashboard include?
Ad spend by campaign, attributed installs and events, subscription revenue and renewals from your subscription platform, and refunds.
Our take
Building a dashboard is easy. Keeping attribution, costs and definitions right every week is the real work. Build what's unique to your business, and let a tool own the parts that break.
Airbridge joins ad costs, attributed installs and subscription events from RevenueCat, Adapty or Superwall in one view, and lets you export the data to build your own reports on top. The Core Plan is built for subscription apps, and you can try it free for 30 days, then from $40 per month.


Ready to transform your mobile growth?
Learn how Airbridge helps leading brands measure and optimize every touchpoint.
“While working with Airbridge, we have learned that MMM is a crucial attribution model for post-privacy era marketing to predict future performance and optimize the budget.”