What Makes a Paywall Convert? Six Structural Decisions for Subscription Apps
Most paywalls look reasonable. Clean layout, benefit bullets, a trial offer. Yet the median subscription app converts just 1.9% of downloads to paying subscribers within 35 days. The top 10% convert 8.5% (RevenueCat, State of Subscription Apps 2025). That 4.5x gap is not a design problem.
The difference lives in six structural decisions made before anyone opens a design tool: model, placement timing, plan structure, trial length, price level, and experiment discipline. Get these right and design becomes a finishing touch. Leave them to chance and no amount of copy iteration will close the gap.
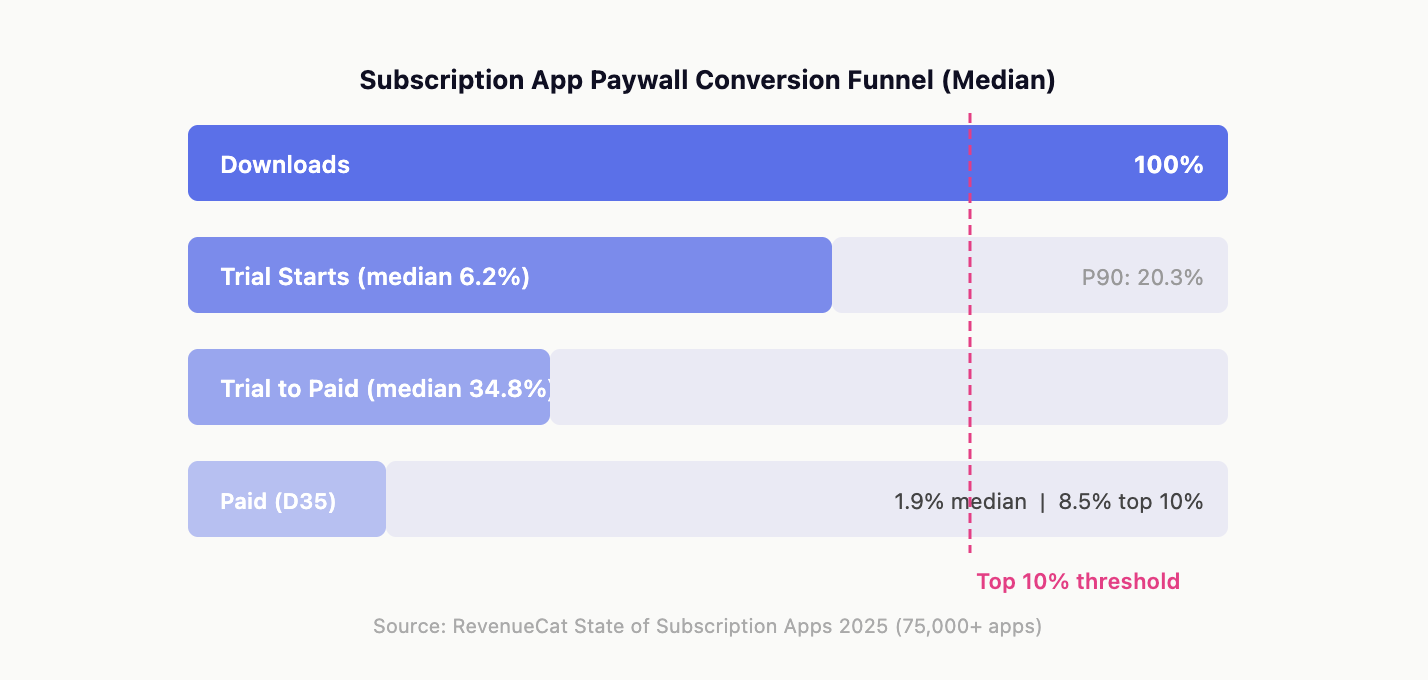
Each stage of the funnel drops significantly.
Top-performing apps widen the gap at the Trial Start and Trial-to-Paid stages through deliberate placement, model, and trial strategy decisions.
Key Takeaways
-
Paywall timing outweighs paywall design. 82% of trials start on Day 0 (RevenueCat SOSA 2025). What happens in onboarding determines conversion more than anything on the screen itself.
-
Hard paywalls convert 5.5x better than freemium at Day 35 (12.1% vs. 2.2% median), and they generate roughly double the year-one LTV.
-
Conversion = Motivation x Trust / Friction. Every element either builds motivation, adds trust, or removes friction. Low conversion means one of these three is broken.
-
Longer trials outperform shorter ones. Apps with 17 to 32-day trials convert at 45.7% trial-to-paid, compared to 26.8% for 3 to 7-day trials.
-
Teams that run experiments generate up to 40x more revenue than teams that do not. Optimization is a process, not a one-time project.
Why Do Most Paywalls Underperform? Six Decisions That Set Your Ceiling
The 4.5x Gap Between Median and Top Apps Is Structural, Not Visual
The subscription app market concentrates performance at the top. The top 10% of apps capture 95% of total revenue. Paywall best practices for subscription apps consistently point to six structural variables as the primary drivers of conversion, not design choices.
The leverage in structural decisions is extreme. Among weekly-plan apps, trial format screens win 64.5% of head-to-head tests against visual-only layouts, and weekly + trial configurations consistently rank highest for year-one LTV (Adapty, State of In-App Subscriptions 2026). That gap comes from one configuration decision, not a redesign.
Six Structural Decisions Determine Your Conversion Ceiling
| Decision | What It Controls |
|---|---|
| Paywall model | Hard gate vs. soft gate vs. freemium |
| Placement timing | When in the user journey the offer appears |
| Plan structure | Which plans are shown and how they are presented |
| Trial strategy | Whether to offer a trial and for how long |
| Price level | Actual price points and anchoring logic |
| Experiment roadmap | What gets tested and how results are measured |
Design and copy come after these six are deliberate. If the structure is misconfigured, visual iteration produces marginal gains at best.
When Should Your Paywall Appear? Placement Is the First Conversion Lever
Day 0 Is the Only Paywall Moment Most Users Give You
82% of trials begin on the same day a user downloads the app (RevenueCat SOSA 2025). If the offer is buried behind multiple onboarding screens, motivation has already started to drop by the time users reach it.
Track paywall visibility rate (the percentage of new users who ever reach the offer) as a primary metric before optimizing anything on the screen. If fewer than 80% see it, fix that first.
Onboarding Placements Outperform In-App Gates Across Every Configuration
Adapty's dataset of 16,000+ apps ranks install-to-paid conversion by placement type:
| Placement | Install-to-Paid |
|---|---|
| Onboarding + trial | 1.78% |
| In-app + trial | 0.89% |
| Onboarding, no trial | 0.82% |
| In-app, no trial | 0.76% |
Onboarding placements more than double the conversion of in-app gates with no trial. The user has just chosen to install your app and has not yet found reasons to disengage. Fix the onboarding flow first, then move the offer to the screen immediately after the user's first meaningful action.
What Does a High-Converting Paywall Screen Include?
Lead with Outcomes, Not Price: Information Order Drives Conversions
Most screens lead with pricing. This anchors users on cost before they have any reason to assign value. High-converting screens follow a different sequence: outcome, value explanation, reassurance, pricing, CTA.
This order answers user questions in the sequence they actually ask them: what do I get, how does that help me, is this trustworthy, what does it cost, and what do I do now. Reversing it leaves objections unanswered at the wrong moment.
Social Proof and Testimonials Can Double Trial Start Rates
Social proof answers the "is this trustworthy?" question before users commit to payment. Effective trust elements include star ratings with a specific review count, outcome-specific testimonials matched to the user's onboarding goal, and recognizable download numbers or media mentions.
One well-documented test showed that a long-scroll paywall with testimonials, feature explanations, and an FAQ section doubled trial start rates compared to a minimal single-screen layout (48 Laws of Subscription App Success, Law 16).
Default Selection and Price Anchoring Shift Plan Choice Without Changing Prices
Two behavioral mechanisms improve revenue without touching price.
Default bias: Users tend to accept the pre-selected plan. Pre-selecting your highest-value plan shifts the distribution of choices in your favor. Most apps pre-select the cheapest option by default, which is the opposite of the optimal configuration.
Anchoring via decoy: A mid-tier plan placed between the cheapest and best-value options makes the best-value plan appear to be the obvious choice.
Want to see how Paywall works with your data?
Get hands-on with Airbridge and see real results.
Try It Free →Hard Paywall or Soft Paywall: Which Model Converts Better?
Hard Paywalls Convert 5.5x Better Than Freemium at Day 35
The performance difference between models is larger than most teams expect (RevenueCat, State of Subscription Apps 2025):
| Model | Median D35 Conversion | Median Y1 LTV |
|---|---|---|
| Hard paywall | 12.1% | $49.30 |
| Freemium | 2.2% | $24.24 |
Hard paywalls filter for intent. Users who subscribe without a trial are more committed at the moment of purchase. They churn less, renew at higher rates, and generate more lifetime value. The 5.5x conversion advantage compounds into roughly 2x the LTV advantage at year one.
Hard paywalls only work if onboarding earns the ask. Users who hit the gate before understanding the product's value will not convert. Hard paywall Y1 LTV is $49.30, but refund rates are also higher (5.8% vs. 3.4% for freemium).
Freemium Works When Value Requires Time to Experience
Freemium is not the wrong model. It is an expensive model. Converting 2.2% of installs instead of 12.1% means you need roughly 5x more installs to generate the same subscriber count.
Freemium makes sense when the value proposition requires extended time to experience, or when growth relies on word-of-mouth from free users. For apps running paid UA, the data favors hard paywalls or onboarding-gate trials.
How Long Should a Free Trial Be? Trial Strategy That Converts
Longer Trials Win on Habit Formation, Not Time Pressure
The finding from 75,000+ apps is counterintuitive: longer trials convert better. Apps with 17 to 32-day trials achieve a 45.7% trial-to-paid conversion rate. Apps with 3 to 7-day trials convert at 26.8%. The longer trial outperforms by nearly 19 percentage points.
The mechanism is habit formation, not generosity. More than 55% of 3-day trial users cancel on Day 0, versus 31% for 7-day trials (RevenueCat). A 3-day trial creates time pressure with no time to form a habit. A 17-day trial gives users enough sessions to build a routine. By the time it ends, they are deciding whether to stop using something already integrated into their workflow. If your trial conversion is below the industry median of 34.8% and you are running 7-day or shorter trials, test a 14 or 30-day trial before redesigning the screen.
In High-Intent Categories, Direct Purchase Users Generate More LTV
Trials are not universally positive. The category-level premium from a trial vs. direct purchase varies widely (Adapty, 2026):
| Category | Trial Uplift vs. Direct Purchase |
|---|---|
| Utilities | +85.1% |
| Health & Fitness | +63.6% |
| Education | +50.4% |
| Productivity | -13.7% (direct purchase wins) |
For Productivity apps, direct buyer LTV is $56.95 versus trial user LTV of $49.13. A trial introduces hesitation for a user who was already ready to commit. Test a direct purchase option alongside your current offer.
90% of Users Who See the First Screen Do Not Convert. Show a Second Offer.
More than 90% of users who see the first screen do not convert on that view (48 Laws of Subscription App Success, Law 17). Most apps present nothing to that group. High-performing apps show a second offer.
The second offer does not have to be a discount. Effective options include a different plan format (monthly vs. annual), a lifetime purchase option that removes recurring commitment friction, or a short micro-survey that surfaces the hesitation reason. For more on subscription pricing plan structures that work alongside second offers, see our plan type guide.
How to Build a Paywall Optimization Roadmap
Segmentation Amplifies Broken Paywalls Instead of Fixing Them
The most common mistake is jumping to segmented offers before fixing the baseline. Segmentation amplifies what already exists. It does not create performance where none exists. Apps that experiment systematically generate up to 40x more revenue than apps that do not, but the experiments have to be structured correctly.
A practical three-phase roadmap:
-
Phase 1 (Foundation, 0 to 30 days): Fix visible friction. Confirm the offer loads reliably, the CTA is unambiguous, and the plan selection is logical. Track visibility rate and confirm 80%+ of new users see the offer.
-
Phase 2 (Optimization, 30 to 90 days): Test structural decisions in order of leverage: trial length, model, plan structure and default selection, price points. One test at a time, measured by ARPU.
-
Phase 3 (Expansion, 90+ days): Add segmentation and personalization based on onboarding behavior, engagement level, or acquisition source. This is also where connecting paywall performance to acquisition channel data becomes critical. Knowing whether your highest-converting users came from Meta or Apple Search Ads changes how you scale budget.
Price and Plan Experiments Are the Highest-Leverage Tests. Measure with ARPU.
Adapty's dataset of 16,000+ apps shows the probability a given experiment type produces a winning result:
| Experiment Type | LTV Win Rate |
|---|---|
| Localization | 62.3% |
| Trial structure | 59.6% |
| Plan duration | 58.7% |
| Number of plans | 57.1% |
| Price changes | 45.5% |
| Visual / copy changes | 34.6% |
Structure and trial experiments win more than half the time. Visual and copy changes are the only lever with a sub-50% win rate, failing nearly 65% of the time. Price experiments also improve conversion in 28% of cases (conversion win rate). Start with plan structure and trial length. Move to price testing when you can measure LTV. Save visual and copy testing for last.
ARPU (average revenue per user) is the right primary metric. It balances conversion rate, pricing, and plan mix in a single number. Set ARPU as your success metric before running any test, and define ship / iterate / kill criteria before looking at results. See also: what a good retention rate looks like for subscription apps.
Fix the Structure Before You Fix the Design
The gap between your current conversion rate and the top 10% is not a design gap. It is a structural gap. Placement, model selection, trial length, plan structure, pricing, and experiment discipline produce the 8.5% conversion rates. Button colors do not.
Pick the single structural decision you have never deliberately tested. Run one clean experiment this month. Measure ARPU. Then pair that experiment with channel-level attribution to see which acquisition sources are fueling your wins.

Ready to transform your mobile growth?
Learn how Airbridge helps leading brands measure and optimize every touchpoint.