How to Read App Ad Campaign Data and Decide When to Scale

You are running two ad campaigns on Meta. Campaign A drove installs at $4 cost per install. Campaign B drove installs at $8. The obvious read is to scale Campaign A and cut Campaign B.
Six weeks later, Campaign A's subscribers have churned at 60%. Campaign B's subscribers are still paying. The cheaper install turned out to be the worse campaign. This is the trap that cost-per-install decisions create, and most subscription app marketers fall into it at least once.
Reading campaign volume is not the same as reading campaign performance. The data you need to decide whether to scale or pull an app ad campaign does not live inside Meta Ads Manager or Google Ads. It lives in the downstream subscription funnel, weeks after the install.
Key Takeaways
-
CPI and CTR measure reach, not revenue. The numbers that drive scale decisions are trial-to-paid conversion, revenue per install, cost per subscription, and first renewal rate.
-
There are three campaign states, not two. Scale, Optimize, and Pull each have specific criteria. "Not scaling" is not the same as "pull."
-
Cost per Subscription (CPS) collapses the whole funnel into one number. If CPS exceeds your payback window, no amount of CPI optimization changes the outcome.
-
Adding budget to a broken funnel compounds the loss. Every dollar added to a campaign with weak downstream conversion increases the total loss, not the total gain.
-
Every ad platform claims its own version of your conversions. Without a single source of truth for subscription data, scale decisions are based on conflicting numbers.
What Meta and Google Ads Don't Tell You About Subscription Performance
App campaign performance analysis is the practice of evaluating subscription funnel metrics (trial conversion, revenue per install, and renewal rate) to determine whether a campaign should be scaled, optimized, or paused. It starts downstream from the ad platform, not inside it.
1. Why CPI Is a Cost Metric, Not a Subscription Revenue Metric
The cost per paying user (CPPU) runs 4 to 5 times the CPI across subscription app categories. A campaign showing a $4 CPI likely carries a $16 to $20 CPPU. That number does not appear on any ad platform dashboard (RevenueCat State of Subscription Apps 2025).
CPI measures one thing: how much you paid to get someone to tap "download." It says nothing about whether that person started a trial, converted to a paid plan, or renewed. The gap between install cost and subscriber cost is where most scaling decisions go wrong.
2. Actuals Tell You Cash. Cohorts Tell You Profit.
Last month's actuals show what happened in a time window: installs, spend, and revenue. Cohorts show what a specific group of users generates over time: users who installed in May, tracked through June, July, and August.
Actuals tell you your cash position. Cohorts tell you your unit economics. Scaling based on monthly actuals alone is deciding to increase a bet before all the cards are on the table.
3. Why Your Funnel Stage Determines Which Metrics to Read
Most campaigns are failing at one stage while appearing healthy at another. A campaign with strong install volume and a low trial start rate has an onboarding or paywall problem. A campaign with strong trial volume and a low trial-to-paid conversion has a product-trial alignment problem.
Read the funnel in order: install rate, trial start rate, trial-to-paid conversion, and first renewal rate. Strength at the top often hides a break further down.
The 4 Subscription Metrics That Determine Whether to Scale an App Ad Campaign
These four metrics live downstream from the ad platform. They do not appear on your Meta or Google dashboard. Each one gates the next: a weak trial-to-paid rate makes RPI projections unreliable, and an unexamined renewal rate makes CPS comparisons wrong.
1. Trial-to-Paid Conversion Rate: The First Gate Before Scaling Ad Spend
If your trial-to-paid conversion rate is below 34.8%, the median across 75,000+ subscription apps, scaling ad spend pushes more users into a funnel that does not convert. Every dollar added amplifies the leak, not the revenue.
The top quartile of apps converts at 51.5% and above. If you are below the median, the issue is the onboarding sequence or paywall design, not the acquisition campaign. Fix the funnel before scaling the top.
| Benchmark | Trial-to-Paid Conversion |
|---|---|
| Median (all categories) | 34.8% |
| Top quartile (Q3+) | 51.5%+ |
| Health and Fitness (median) | 39.9% |
| Travel (median) | 48.7% |
Source: RevenueCat State of Subscription Apps 2025
2. D30/D60 Revenue per Install (RPI): Is This Campaign Paying Back?
Revenue per install measures cohort-level revenue divided by install volume over a defined time window, including every trial, subscription, and renewal that follows.
Median D60 RPI across subscription apps is $0.31. The top quartile reaches $0.81 or above. If a campaign is generating D60 RPI below $0.31, it is underperforming the market. If it is above $0.81 and trending upward, it is a scaling candidate.
Health and Fitness apps see a median D60 RPI of $0.63. Business apps reach $0.48. If your category typically runs above $0.31 and your campaign is still near the floor, the issue is campaign quality, not category difficulty.
The D60 RPI gap between monetization models is significant: apps with hard paywalls reach a D60 RPI of $3.09 versus $0.38 for freemium models, an 8x difference that reflects directly in how quickly a campaign pays back (RevenueCat State of Subscription Apps 2026).
Source: RevenueCat State of Subscription Apps 2025 (category medians); RevenueCat State of Subscription Apps 2026 (paywall model comparison)
3. Cost per Subscription (CPS): The Metric That Collapses the Funnel
CPS is total ad spend divided by total subscriptions generated. It answers the critical question in budget decisions: what does one paying subscriber actually cost me?
The check is direct. If your D60 RPI is $0.81 and your CPS is $80, the campaign does not pay back within 60 days. If your Year 1 LTV per payer is near the median ($16.27 per RevenueCat SOSA 2025), a CPS of $80 never pays back. Compare CPS against your own payback window. The only relevant benchmark is your unit economics.
4. First Renewal Rate: The LTV Signal That Separates Campaigns Worth Scaling
The first renewal is the most important event after conversion. Across subscription plan types, first renewal rates run at 51.8% for weekly, 55.5% for monthly, and 66.3% for yearly plans. Nearly 30% of annual subscribers cancel in the first month.
Two campaigns with identical trial-to-paid conversion can have completely different LTV if their first renewal rates differ. Imagine Meta-sourced subscribers renew at 40% while Google-sourced subscribers renew at 65%: the Google campaign has higher LTV despite the higher CPI.
Check renewal rates by acquisition channel before projecting LTV. A first renewal rate below the platform baseline for your plan type is a pull signal, not a scale signal.
Source: RevenueCat State of Subscription Apps 2025
Want to see how App ad campaign data works with your data?
Get hands-on with Airbridge and see real results.
Try It Free →Where Each Funnel Stage Tells You to Spend Differently
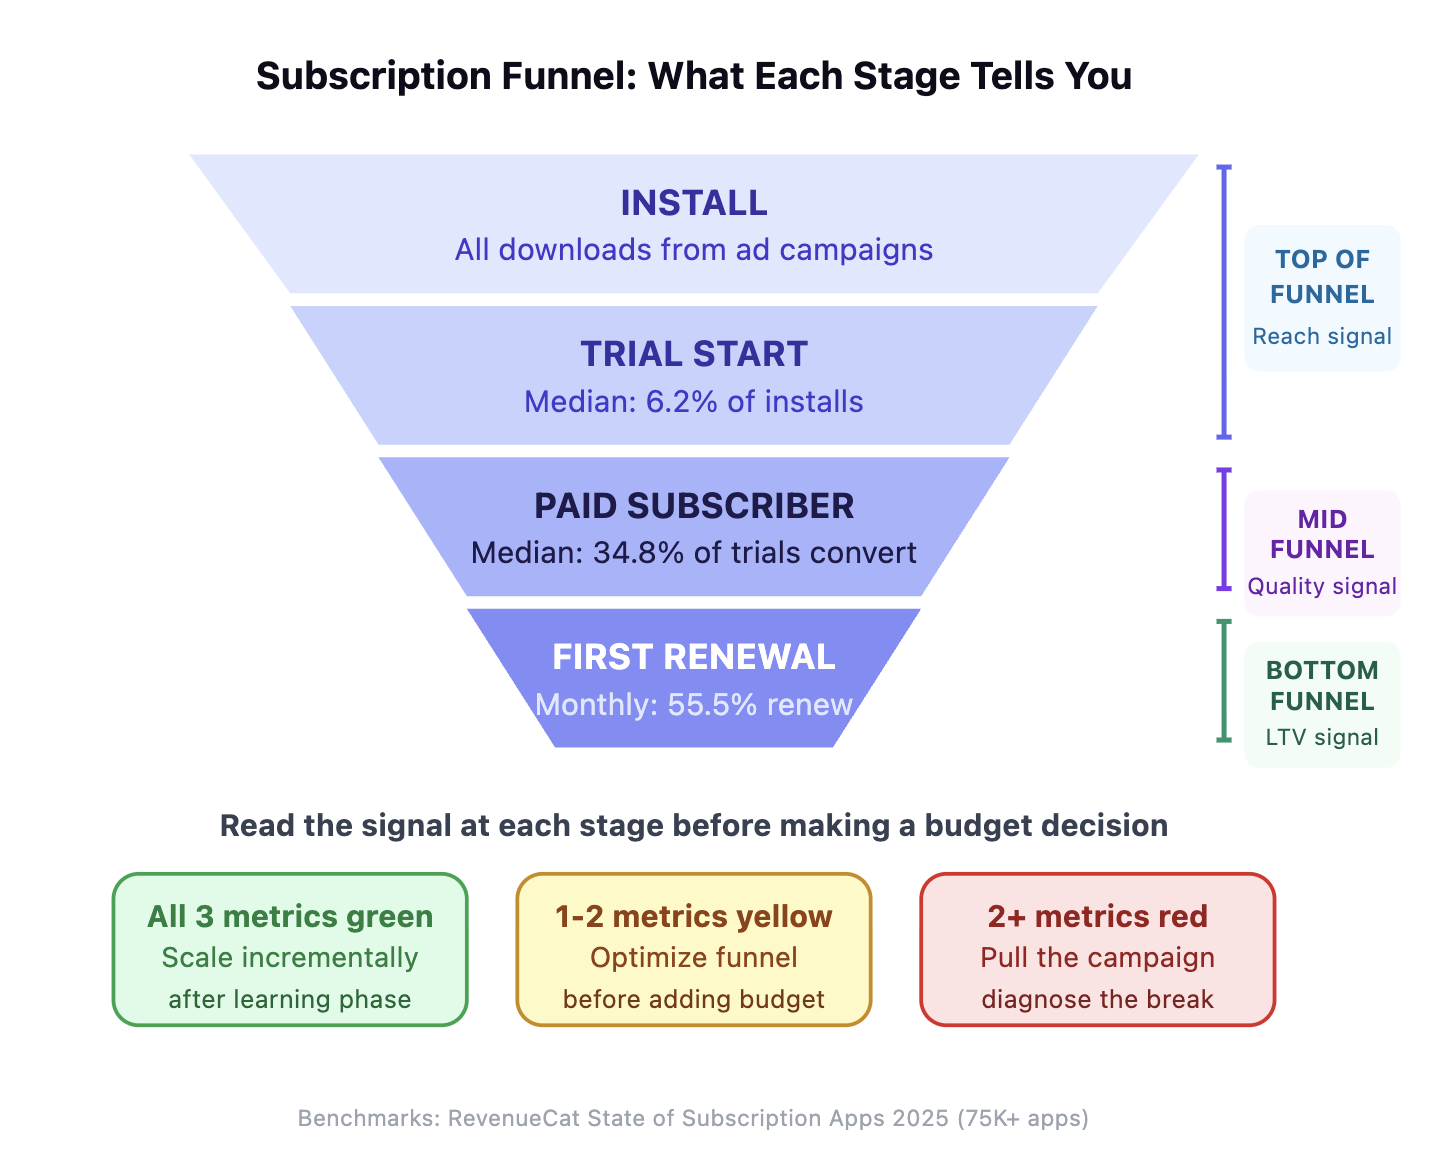
Subscription funnel diagram showing install, trial start, paid conversion, and first renewal stages with scale, optimize, and pull signal labels at each stage
Before running the three-condition scale check, map where your campaign stands in the funnel. Each stage reveals a different problem and points to a different fix.
1. Top of Funnel: Install Volume and Trial Start Rate
Top-of-funnel data tells you whether targeting and creative are resonating. The benchmark trial start rate is 6.2% median, with a top 10% of 20.3%.
If your trial start rate is below 6.2%, there is likely a problem with the onboarding flow or paywall placement. Fix that before scaling spend.
Do not confuse trial volume with trial quality. Lifestyle apps see only 3.9% trial start rates but achieve 41% trial-to-paid conversion. Gaming apps see 12.2% trial starts with only 19% conversion (AppsFlyer State of Subscriptions for Marketers 2026).
The category with 3x lower trial volume is the better scaling candidate when measured at the funnel level. Top-of-funnel data tells you about reach, not money.
2. Mid-Funnel: Trial Quality and Post-Trial Engagement
Mid-funnel is where the first revenue signal appears. Track trial-to-paid conversion rate, trial cancellation rate, and early in-app engagement.
Users who complete a meaningful first-week action — finishing their first workout in a fitness app, completing the first lesson in an education app — convert and renew at significantly higher rates than users who install, start a trial, and go quiet. If post-trial engagement is flat across a campaign's cohort, the acquisition targeting is not the problem.
3. Bottom Funnel: Cost per Subscription and First Renewal Rate Together
A campaign that consistently generates new paying subscribers at a CPS below your payback threshold, with a first renewal rate at or above baseline, has passed all three gates. That is a scaling candidate.
All three conditions must be true. Two out of three is an optimization signal, not a scale signal.
The Scale, Optimize, and Pull Decision Framework for App Ad Campaigns
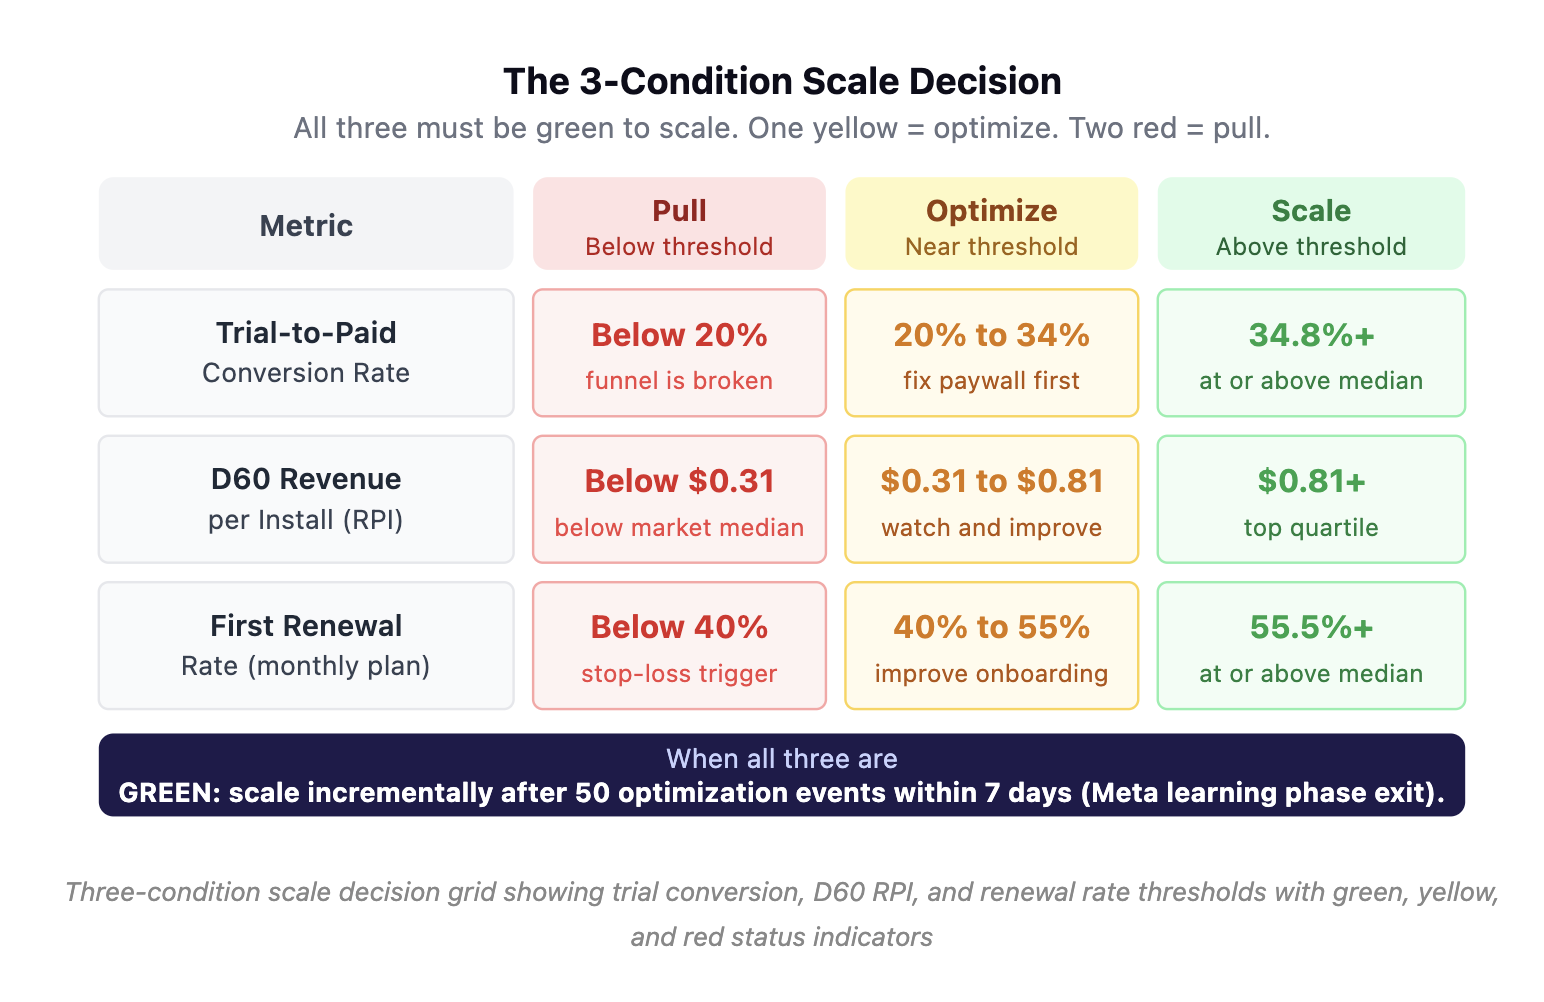
1. When to Scale: Three Conditions That Must All Be True
Scale a campaign when:
-
Trial-to-paid conversion is at or above the median for your category (34.8% general baseline; higher for Health and Fitness)
-
D60 RPI is trending above $0.31 and approaching or above $0.81
-
First renewal rate is at or above baseline for your plan type
When all three are green, increase budget in incremental steps. Meta's standard for exiting the learning phase is 50 optimization events within 7 days; scaling before that threshold is met tends to reset the algorithm and degrade performance (Meta Business Help Center).
2. When to Optimize: Reading Mixed Performance Signals
When some conditions are green and one or more are not:
-
Low trial-to-paid with normal CPI: the onboarding sequence or paywall needs fixing before adding budget
-
Low D60 RPI with normal trial conversion: check plan pricing and trial length, not the campaign targeting
-
High CPS with low renewal rate: the campaign is attracting users who subscribe once and leave
Mixed signals mean the problem is downstream of the campaign. Increasing budget on a funnel problem makes the funnel problem larger.
3. When to Pull: Three Stop-Loss Conditions for App Ad Campaigns
Pull the campaign when:
-
CPS exceeds 2x your payback threshold after reaching statistical significance (at least 50 paid subscription events per campaign variant before drawing conclusions)
-
Trial-to-paid conversion drops below 20% and post-trial engagement is also flat
-
First renewal rate falls below 40% for a monthly plan, roughly 75% of the 55.5% monthly median, the threshold at which Year 1 LTV typically cannot cover a sustainable CPS
These are not optimization problems. They are structural signals that the campaign is reaching the wrong audience or driving users into a broken product funnel.
Why Meta, Google, and Apple All Claim the Same Conversion
The four metrics above are not visible inside Meta Ads Manager, Google Ads, or Apple Search Ads. Those dashboards show installs and sometimes trials if you send back the event. They do not show which campaigns generated subscribers who actually renewed.
Every ad platform reports its own version of performance, and each claims credit for the same conversions. A user who sees a Meta ad and clicks a Google ad a week later before subscribing gets counted as a conversion in both systems. This double-counting makes CPS and RPI calculations unreliable when built from platform data alone.
Run the Three-Condition Check Before Moving Any Campaign Budget
The problem is not that you lack data. The problem is reading CPI when the decision requires CPS, or reading monthly actuals when the decision requires cohort-level renewal rates.
Run the three-condition check before moving any budget. If all three are green, scale incrementally. If one is yellow, find the funnel break first. If two are red, stop the spend and diagnose before adding a single dollar more.


Ready to transform your mobile growth?
Learn how Airbridge helps leading brands measure and optimize every touchpoint.