How to Build a Simple App Growth Loop for Subscription Apps

You open three tabs: RevenueCat shows churn is up. Mixpanel shows activation dropped. Meta Ads Manager shows spend is holding. Three dashboards, three data points, and no answer to the only question that matters: what do you fix first?
This is the problem with data-heavy, action-light app growth. Most subscription apps don't lack reports. They lack a loop: a repeatable system that converts a metric into a specific next action. The apps that grow consistently aren't watching more dashboards. They're running a simple growth loop for subscription apps that tells them exactly what to test each week.
Key Takeaways
-
Reports describe the past. A growth loop drives the future. A dashboard tells you churn went up. A loop tells you which node is broken and what experiment to run this week.
-
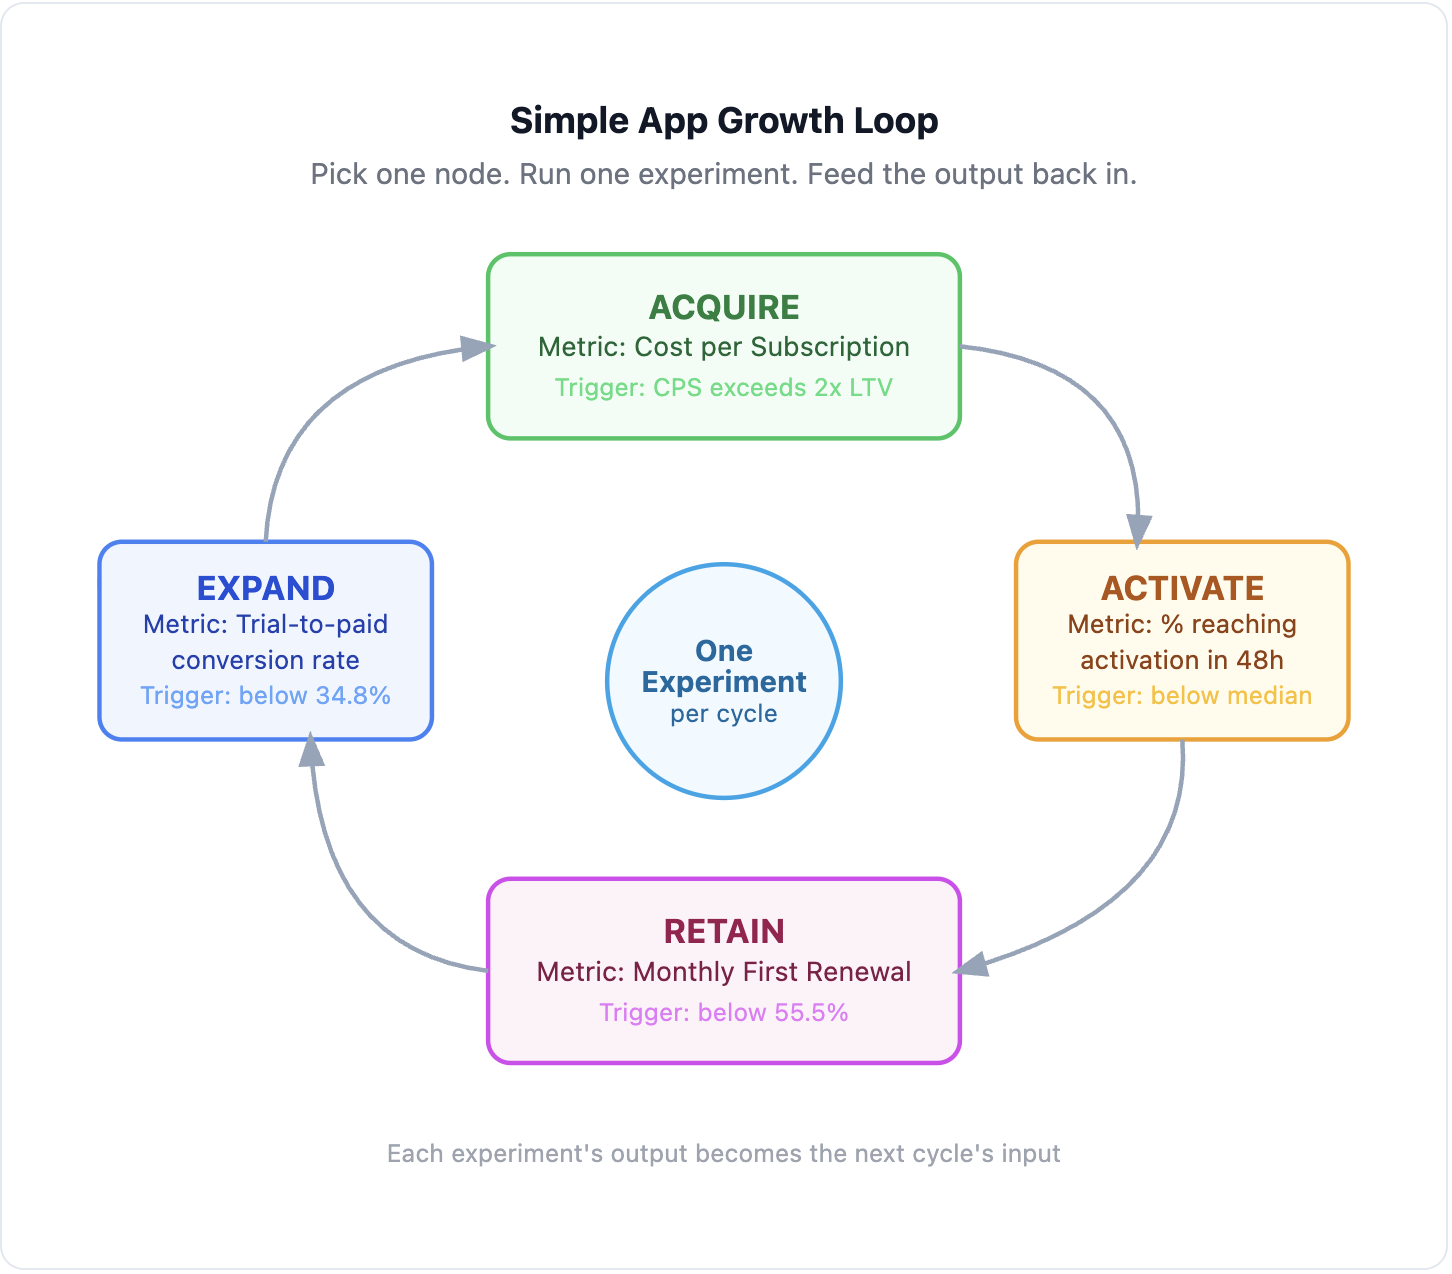
A simple app growth loop has four nodes: Acquire, Activate, Retain, Expand. Each node has one metric, one action threshold, and one experiment.
-
Activation is where most loops break first. The top churn reason for subscription apps is "not enough usage" (37.2% of cancellations), not price and not competition.
-
Experimenting teams generate up to 40x more revenue. The loop is the system that tells them what to test, not intuition and not the metric that looks worst in the weekly report.
-
The loop closes only when acquisition connects to retention. If you can't see which channels produce subscribers who stay, the Acquire node is running blind.
Why Your Subscription App Has Data But No Clear Next Action
Why dashboards answer the wrong question
Adding a fifth analytics tool doesn't solve this. The problem isn't missing data. It's missing structure. Data without a decision framework produces more uncertainty, not less. Most early-stage apps already have more than enough data.
A growth loop is a repeatable system that connects each metric to a specific action, cycling continuously so each experiment's output becomes the input for the next cycle. That structure is what converts a reporting habit into a growth habit.
The Four-Node App Growth Loop: Acquire, Activate, Retain, Expand
The simplest growth loop for subscription apps has four nodes. You don't need to run all four at once. Start with the one that's leaking most.
| Loop Node | Primary Metric | Action Threshold | Example Experiment |
|---|---|---|---|
| Acquire | Cost per Subscription (CPS) | CPS exceeds 2x LTV target | Test new creative format on best-performing channel |
| Activate | % users reaching activation event in 48h | Below your category median | Move paywall or key action earlier in onboarding |
| Retain | Monthly plan first renewal rate | Below 55.5% median | Add re-onboarding push at Day 3 for low-usage subscribers |
| Expand | Trial-to-paid conversion | Below 34.8% median | Test 14-day trial vs 7-day trial on paywall |
All thresholds are all-category medians (RevenueCat State of Subscription Apps 2025). Category benchmarks vary: Health & Fitness monthly renewal runs near 45%, Productivity near 70%.
If you don't know your category median, the gap between your top cohort and your median cohort is the more useful signal.
1. Acquire: Why cost per subscription (CPS) beats cost per install (CPI)
Cost per Install (CPI) is the most commonly tracked metric in the Acquire node. It is also the least useful for subscription apps.
Imagine a $1 CPI from TikTok versus a $4 CPI from Meta. If the Meta user has 3x the retention rate, both channels produce identical subscription revenue. The metric that matters in the Acquire node is Cost per Subscription (CPS), not Cost per Install. CPS connects your ad spend directly to the output that generates revenue. CPI does not.
If your only acquisition data is CPI by channel, you're optimizing the wrong number. Refocus the Acquire node on which channel produces subscribers, not which channel produces the cheapest installs.
2. Activate: What the activation sequence looks like in a subscription app
82% of trials start on Day 0 (RevenueCat State of Subscription Apps 2025). Your paywall and your onboarding are not separate decisions. They are part of the same activation sequence. If users are not reaching the paywall in their first session, the Activate node is leaking before it starts.
Build your activation metric around the user behavior that predicts 30-day retention for your specific app. "Completed onboarding" is too generic. The activation event needs to be tied to a specific instance of value delivered: a workout logged, a language lesson completed, a report generated.
Failed activation is what later shows up as "not enough usage" cancellations, the same 37.2% cited in the Retain node data. When users churn for that reason, the fix belongs here in Activate, not in a win-back campaign.
3. Retain: How to find your dominant churn reason before building a retention system
Before investing in push notification sequences, engagement" class="glossary-link" title="Re-engagement">re-engagement emails, or win-back campaigns, identify which churn reason dominates your app.
37.2% of subscription app cancellations are driven by "not enough usage" (RevenueCat State of Subscription Apps 2025). Cost-related churn comes second at 34.6%. These two reasons require completely different fixes. Usage churn means the product is not habit-forming enough. Lifecycle discounts won't fix it. Cost churn can sometimes be addressed with offer timing and plan restructuring.
Running a discount campaign against a usage churn problem burns budget on the wrong experiment. One cancellation survey question ("Why did you cancel?") tells you which node to fix first. For subscription app retention benchmarks by category, see our full data guide.
4. Expand: How subscription apps grow revenue through structured experiments
Expansion means increasing revenue per user: longer subscription periods, better trial-to-paid conversion, or higher plan defaults.
Apps that actively experiment on pricing and paywall setup earn nearly 40x more revenue than apps that don't (Adapty State of In-App Subscriptions 2026). The average experimenting app runs 14.7 experiments per year (Adapty State of In-App Subscriptions 2026), roughly one experiment every three weeks. Across 75,000+ apps, the top 10% of subscription apps generate 6x+ the revenue per install compared to the median (RevenueCat State of Subscription Apps 2025). The difference is not their tech stack. It is their cadence of deliberate improvement.
Apps with longer trial windows (17-32 days) reach a median trial-to-paid conversion of 45.7%, versus 26.8% for short-window trials, making trial length one of the highest-leverage experiments in this node. See trial-to-paid conversion benchmarks by category.
Want to see how App growth loop for subscription apps works with your data?
Get hands-on with Airbridge and see real results.
Try It Free →How to Run Your First App Growth Loop Cycle in 3 Steps
1. How to find your leakiest growth node
Look at your metrics and find the node with the largest gap between your current number and the category benchmark. If your trial-to-paid conversion is below 34.8% (the all-category median per RevenueCat State of Subscription Apps 2025), the Expand node is the priority. If your monthly plan first renewal is below 55.5%, Retain needs attention first.
Once you have identified the leakiest node, drill into the dominant sub-signal within it before writing your hypothesis. If Retain is the priority, run a cancellation survey first: usage churn and cost churn require different experiments. If Activate is the priority, confirm whether users are reaching the paywall in their first session before building any lifecycle sequences.
Pick the worst one. Everything else waits. Trying to fix multiple nodes simultaneously splits your team's attention and makes it impossible to learn what worked.
2. How to write a testable growth hypothesis
"We are adding a Day 3 push notification because low-usage subscribers are churning before they reach the core value moment, and a personalized reminder should pull them back into the product."
Run one experiment per cycle. Two simultaneous changes to the same node make it impossible to attribute any improvement to a specific cause.
3. How to feed experiment results back into the loop
After the experiment concludes, the output becomes the input for the next cycle. If the Day 3 push improved monthly plan first renewal from 40% to 46%, ask: which user segment responded? Which platform? Which onboarding cohort?
That specific answer shapes the next experiment. Each cycle produces a more precise question than the last. For more on structuring these experiments, see our app marketing resource library.
Three Mistakes That Stall Your App Growth Loop
-
Optimizing for CPI instead of CPS. CPI is disconnected from subscription revenue. Scaling spend without knowing which channels produce paying subscribers generates no LTV. Track Cost per Subscription instead. The Acquire node must connect to the Retain node or it is not a loop.
-
Running more than one experiment at a time. Two simultaneous changes to the same node make it impossible to know what moved the metric. One experiment per cycle is a constraint that produces learning, not a limitation that slows growth.
-
Skipping the Activate node entirely. Most teams focus on Acquire (more spend) and Retain (reduce churn), and ignore the sequence between install and first subscription. That sequence is where retention is decided. If users never reach the value moment, no lifecycle campaign will recover them.
From Weekly Reports to Weekly Actions: Make App Growth a Habit
Every subscription app has reports. The ones that compound have a loop. The difference is not the quality of the data. It is the structure you bring to it.
Pick one leaky node this week. Write one hypothesis. Run one experiment. Six months from now, the question will no longer be "what do all these reports mean?" It will be: "which hypothesis are we testing next?"


Ready to transform your mobile growth?
Learn how Airbridge helps leading brands measure and optimize every touchpoint.