CPI, Cost per Trial, Cost per Subscription: The Three Metrics That Actually Measure Fitness App UA
You run two channels for your fitness app. Same monthly budget.
-
Channel A: CPI $2. Install-to-trial rate 10%. Trial-to-paid rate 20%. Cost per subscriber: $100.
-
Channel B: CPI $5. Install-to-trial rate 40%. Trial-to-paid rate 50%. Cost per subscriber: $25.
CPI says Channel A is 2.5x more efficient. Cost per subscription says Channel B delivers subscribers at 4x lower cost. If you allocate budget based on CPI, you are overspending on the wrong channel.
This is not a hypothetical. Most fitness app teams report CPI because every ad platform calculates it automatically. But CPI measures the cheapest, shallowest part of the funnel — and tells you nothing about what happens after the install.
Key Takeaways
-
CPI is the only UA metric with standardized benchmarks — and the worst predictor of fitness app UA success. Facebook CPI $2–$5.50, Google $1.50–$4.50, TikTok $1.75–$4.00. None of these numbers tell you whether those installs become subscribers.
-
Cost per trial (CPT) is the middle metric most fitness app teams skip. Healthy blended CPT: $20–$40 for most subscription apps. But no standardized benchmark exists because CPT requires attribution infrastructure most teams lack.
-
Cost per subscription (CPS) is the metric that actually measures UA success — but almost no one tracks it by channel because it requires attribution + billing integration.
-
Terminology trap: "CPT" means different things in different contexts. Apple Search Ads uses CPT for "cost per tap" (global median $0.92). Subscription app teams use CPT for "cost per trial" ($20–$40 range). Do not confuse the two.
-
Airbridge Core Plan connects CPI to trial to subscription by channel — so you can calculate CPT and CPS per channel without custom data pipelines. Start with 15K free attributed installs.
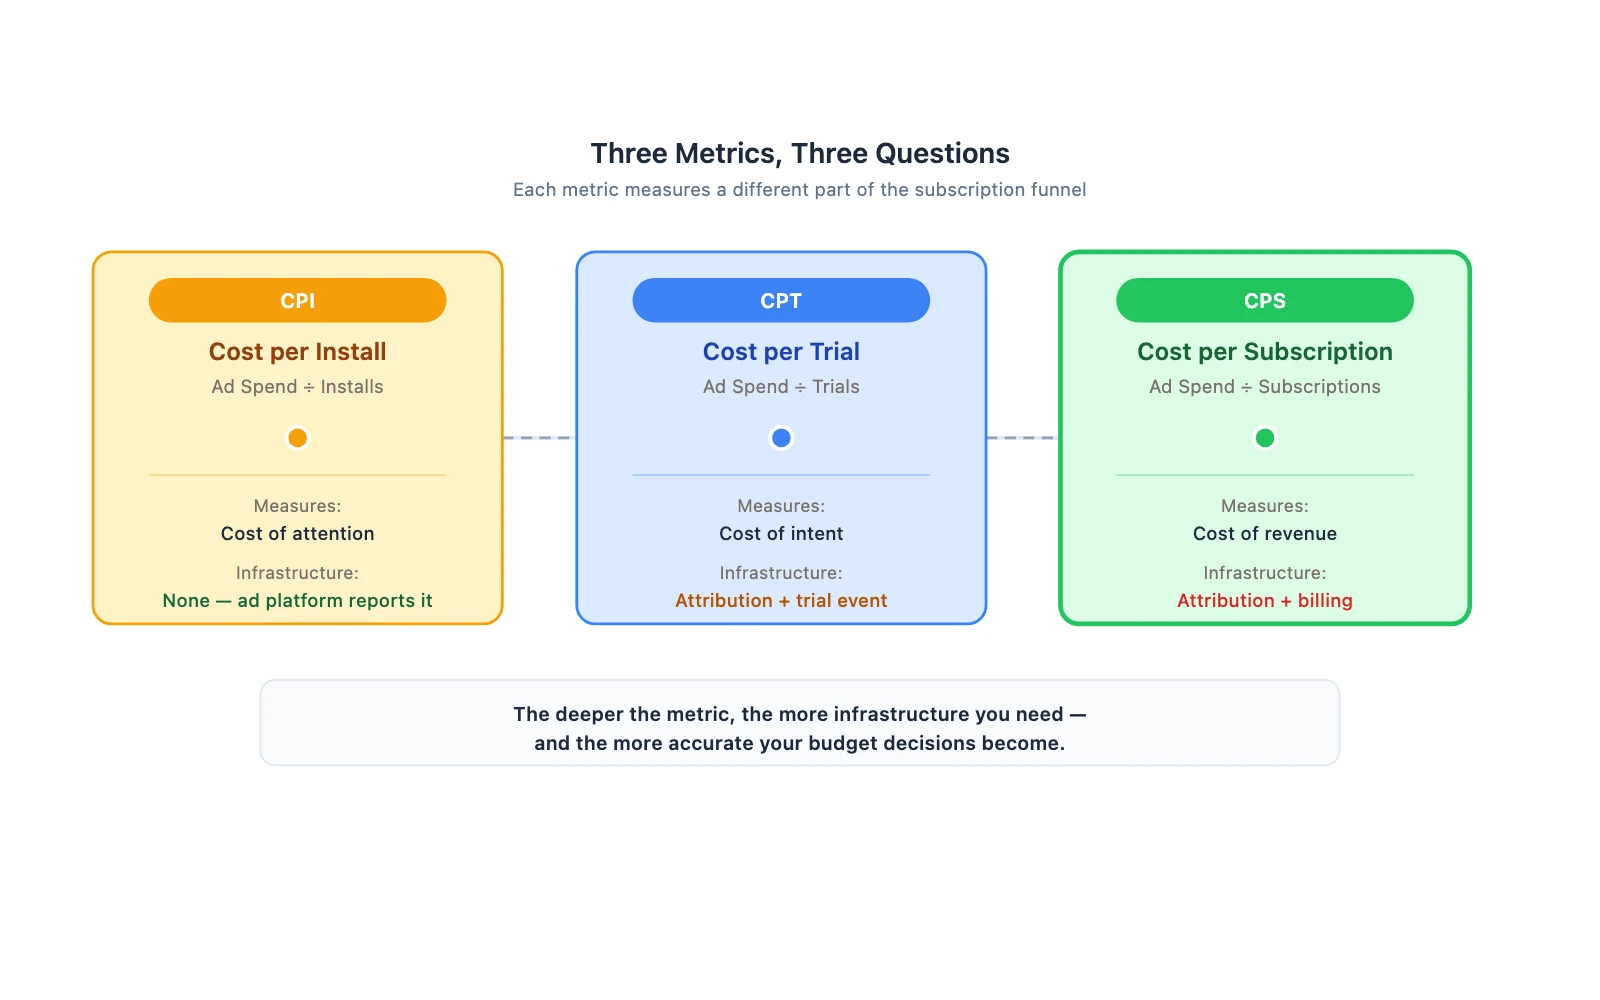
Three Metrics, Three Stories
Every fitness app UA metric answers a different question. The problem is that most teams only measure the first one.
CPI: Cost per Install — What Everyone Measures
Formula: Total ad spend ÷ number of installs.
CPI is universal. Every ad platform reports it. Industry benchmarks are widely published:
| Platform | CPI Range |
|---|---|
| Facebook Ads | $2.00–$5.50 |
| Google Ads | $1.50–$4.50 |
| TikTok Ads | $1.75–$4.00 |
| Apple Search Ads (US) | $4.06 median |
CPI is useful for one thing: measuring the cost of getting a user to download your app. For fitness apps, that is the least important step. An install is not a trial. A trial is not a subscriber. A $2 install from someone who never opens the app costs infinitely more than a $5 install from someone who subscribes to your workout plan.
The trap: because CPI benchmarks exist, teams use them to compare channels. But CPI comparisons alone are insufficient for fitness apps — they measure acquisition efficiency without capturing what happens after the install.
Cost per Trial: The Metric Most Teams Skip
Formula: Total ad spend ÷ number of trial starts.
Cost per trial (CPT) tells you how much you pay to get a user to start a free trial — the first real signal that someone is considering your workout plan or meditation program.
Shamanth Rao's analysis puts healthy blended CPT at $20–$40 for most subscription apps, with trial-to-paid conversion of 45–50%. A target below $12 is "incredibly aggressive — no app I know of has attained this at meaningful scale." For fitness apps, where impulse trial starts are common, CPT is especially important — it reveals how much you pay for genuine interest versus motivation-spike downloads.
Why most teams skip CPT: ad platforms do not report it. Calculating CPT by channel requires an attribution system that connects ad spend to in-app trial events. Without this, CPT is invisible — teams see CPI (from the ad platform) and trial volume (from their app analytics) but cannot connect the two by channel.
Terminology warning: Apple Search Ads uses "CPT" to mean "cost per tap" — their click metric, with a global median of $0.92. This is not cost per trial. When you see "CPT" in an Apple Ads context, it means the cost of a tap on your ad, not the cost of a trial start. In this article, CPT means cost per trial.
Cost per Subscription: The Metric That Actually Matters
Formula: Total ad spend ÷ number of paid subscriptions.
Or equivalently: CPS = CPI ÷ (install-to-trial rate × trial-to-paid rate).
CPS is the true unit economics metric for subscription-model fitness apps. It tells you how much you paid to acquire a paying subscriber — the primary driver of recurring revenue.
Why no benchmarks exist: CPS depends on two conversion rates that vary enormously. Health & Fitness apps convert trials to paid at 39.9%, while the global average is 25.6%. Install-to-trial rates vary from 5% to 40%+ depending on onboarding, paywall design, and channel quality. Multiply these variables together, and no universal CPS benchmark is meaningful.
Why no CPS benchmarks exist — and why CPT benchmarks barely exist either — comes down to infrastructure, not importance:
-
CPI: The ad platform calculates it automatically. Every team has this number.
-
CPT: Requires connecting ad spend to in-app trial events via attribution. The ad platform sees the install; your app sees the trial — without attribution, no one sees both by channel.
-
CPS: Requires attribution + billing integration. Three systems need to talk: ad platform → attribution → billing (RevenueCat, Adapty).
Each step deeper requires one more system connection. The metric gets harder to measure — not less important.
Start measuring what matters — for free
Airbridge Core Plan gives growing teams real attribution, deep linking, and audience tools at no cost.
Get Started Free →The CPI-to-CPS Calculator: See What Your CPI Actually Costs
The intro showed the principle — cheap CPI can mean expensive CPS. Here is how to calculate it with real benchmark ranges.
CPS = CPI ÷ (install-to-trial % × trial-to-paid %)
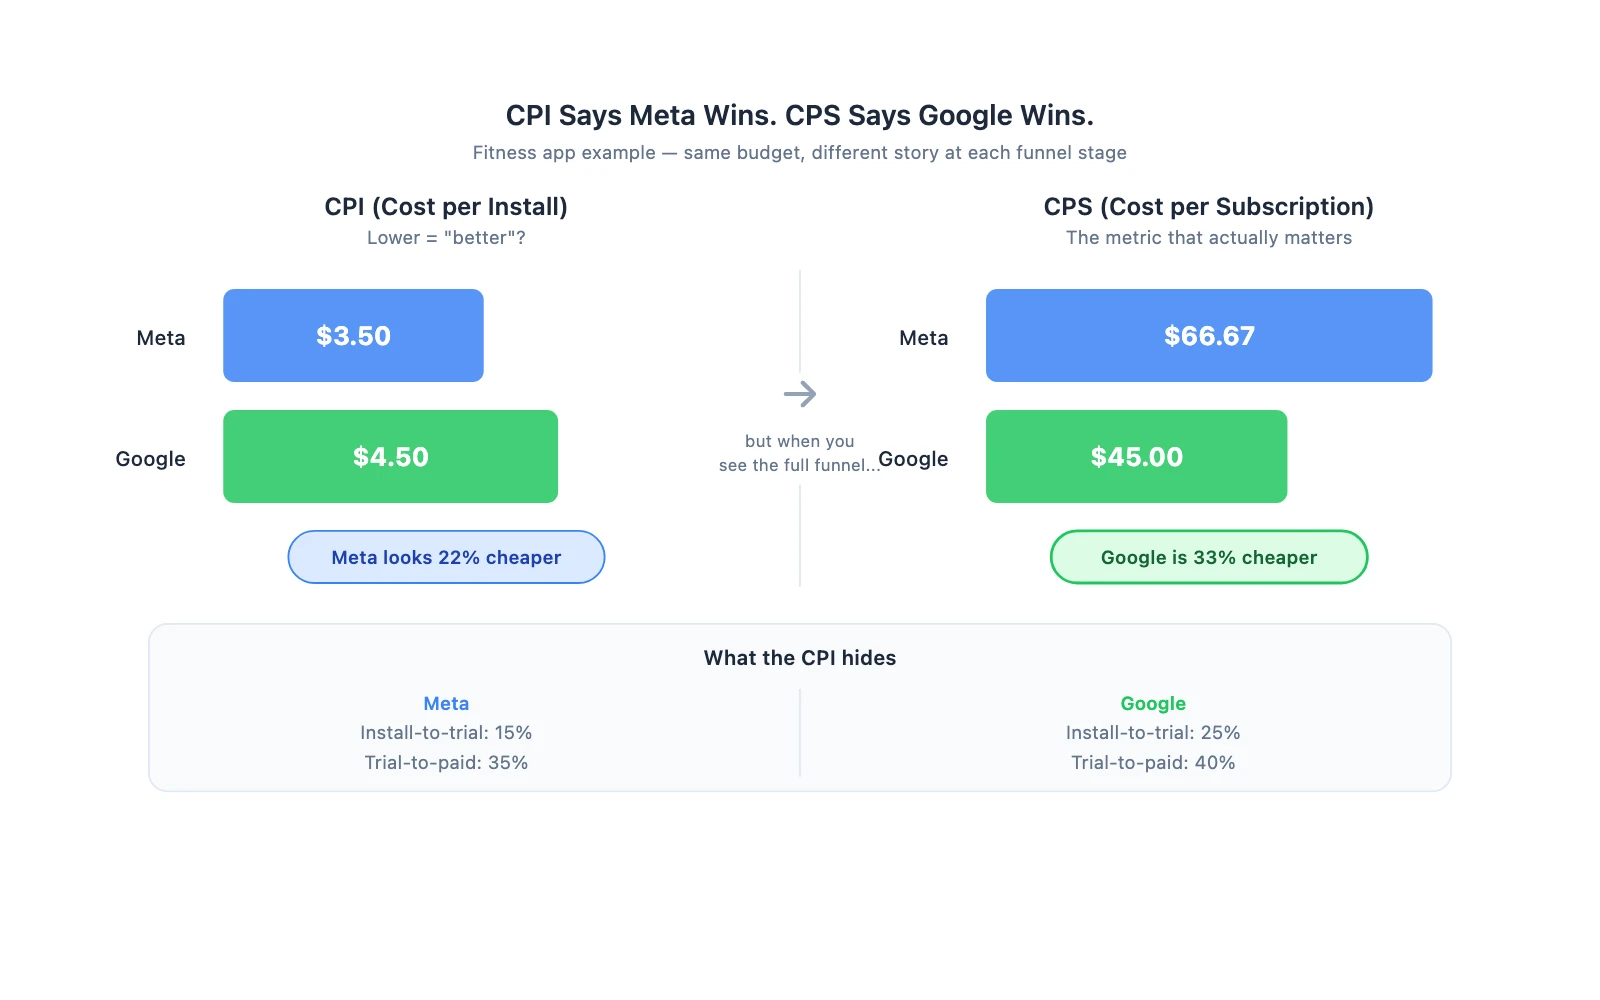
Worked Example: Fitness App on Meta vs Google
| Meta | ||
|---|---|---|
| CPI | $3.50 | $4.50 |
| Install-to-trial rate | 15% | 25% |
| Trial-to-paid rate | 39.9% (H&F benchmark) | 40% |
| CPT (CPI ÷ install-to-trial) | $23.33 | $18.00 |
| CPS (CPI ÷ install-to-trial ÷ trial-to-paid) | $58.48 | $45.00 |
CPI says Meta is 22% cheaper. CPS says Google delivers subscribers at 23% lower cost. Allocating more budget to Meta based on CPI alone increases blended CPS — the opposite of what the team intended.
What Changes When You Optimize for CPS
-
Budget allocation flips. Channels that look expensive on CPI may be the cheapest on CPS.
-
Creative testing changes. The winning creative is not the one with the lowest CPI — it is the one with the lowest CPS.
-
Channel evaluation changes. A channel with $5 CPI and 50% trial-to-paid rate beats a channel with $2 CPI and 10% trial-to-paid rate — by 2.5x on CPS.
How to Track CPI, CPT, and CPS by Channel
What You Need for Each Metric
| Metric | Data Source | Infrastructure Required |
|---|---|---|
| CPI | Ad platform dashboard | None — reported by default |
| CPT | Attribution + trial event | Attribution system with in-app event tracking |
| CPS | Attribution + subscription event | Attribution system + billing platform integration |
CPI is free. CPT requires attribution. CPS requires attribution + billing. This is why most teams stop at CPI — not because CPT and CPS are less important, but because they need more infrastructure.
How Airbridge Core Plan Connects Install to Trial to Subscription
Core Plan tracks Install, Start Trial, and Subscribe as standard events with attribution across Meta, Google, Apple Search Ads, and TikTok. The Actuals Report shows conversion rates at each funnel stage by channel — so you can calculate CPT and CPS per channel without building custom data pipelines.
With native RevenueCat and Adapty integration via S2S, subscription events flow into attribution automatically. CPI from the ad platform, trial events from your app, subscription events from your billing system — all connected by channel in one report.
Airbridge Core Plan vs Traditional MMP
| Capability | Traditional MMP (Typical) | Airbridge Core Plan |
|---|---|---|
| CPI by channel | Available by default | Available by default |
| CPT (cost per trial) by channel | Available, but may require premium tier for full funnel | Standard events with full funnel attribution |
| CPS by channel | Available with configuration, often behind add-on pricing | Actuals Report with event breakdown |
| Billing platform integration | Native integrations available (RevenueCat, Adapty supported) | Native RevenueCat/Adapty via S2S |
| Onboarding focus | General-purpose | Subscription-app focused onboarding |
| Pricing model | Annual contract + add-ons | Pay-as-you-go, $0.05/install |
| Free tier | Limited or none | 15K free attributed installs. All features included |
CPI Measures Attention. CPS Measures Revenue.
CPI tells you the cost of getting someone to download your app. Cost per trial tells you the cost of getting someone to consider paying. Cost per subscription tells you the cost of getting someone to actually pay.
Most fitness app teams only measure CPI — and make budget decisions on incomplete data. The fix is not picking one metric over another. It is measuring all three by channel — so you can see where CPI is cheap but CPS is expensive, and reallocate accordingly.


Ready to see what Core Plan can do?
Free attribution, deep linking, and audience tools — built for teams that are ready to grow.