How to Ask "How Did You Hear About Us?" in Your App the Right Way

You added a "how did you hear about us?" screen to your onboarding. Users are answering. Half say Instagram. You increase your Meta budget. Three months later, your cost per subscription is up and your ROAS is down.
The problem was not the channel. The problem was the question.
Self-reported attribution (asking users directly where they first heard about your app) surfaces signal that no ad platform or attribution tool can give you. Done wrong, it floods your dashboard with noise that steers every budget decision in the wrong direction.
This guide covers how to design the question, where to place it, how to read the data, and when to stop relying on it.
Key Takeaways
-
Self-reported data fills an iOS attribution gap that probabilistic methods cannot close. When platforms like Meta and TikTok under-attribute through AEM or ADC, asking users directly is one of the few reliable cross-checks available to app marketing teams.
-
Question design and placement determine data quality. The same "how did you hear about us?" question placed at different points in onboarding produces significantly different results, with different biases baked in.
-
Survey data reflects perceived influence, not causal attribution. Users pick the most familiar option, not necessarily the true source. This distinction matters when you act on the data.
-
HDYHAU works best when your media mix is simple. It becomes misleading with demand-side platforms and channels users cannot easily name by brand.
-
The real value comes from comparing survey data against subscription revenue, not just against install counts.
Why Self-Reported Attribution Matters for Mobile App Marketing
The iOS Attribution Problem
iOS is the primary revenue pipeline for most subscription apps. Among 75,000+ subscription apps analyzed, 67-76% earn 80%+ of their revenue from iOS. Across the broader market, iOS generates 5.6x more subscription revenue than Android and converts annual plans at 3.6x the Android rate.
But iOS is also where attribution data is hardest.
Apple's App Tracking Transparency (ATT) limits cross-app data collection. SKAdNetwork (SKAN) delivers postbacks with 24-72 hour delays and no user-level identifiers. Probabilistic methods like Meta's AEM and TikTok's ADC fill part of the gap, but systematically under-attribute.
What Under-Attribution Costs You in Practice
An app spending five figures per month on Meta might see 200 subscriptions reported by its attribution tool. The actual number, verified through self-reported data, can be closer to 350 — 3,000 untracked installs per month at a 5% conversion-rate" class="glossary-link" title="Conversion Rate">conversion rate. (Source: David Vargas, RevenueCat, 2025)
Self-reported attribution is not a replacement for your attribution tool. It is a cross-check — telling you which channels are under-attributed and by how much, without depending on probabilistic models or device identifiers. The "how did you hear about us app" question is the simplest form of zero-party data available to app marketers.
How to Design an HDYHAU Survey Question That Gets Honest Answers
Most HDYHAU questions fail because they are designed to be convenient for the team, not honest for the user.
The difference between a question that collects real signal and one that collects noise comes down to four factors: timing, answer options, order, and context.
1. When to Show the HDYHAU Question: Best Placement in Your Onboarding Flow
The best moment to ask is right after the user completes a meaningful action: immediately after onboarding, after starting a free trial, or after their first purchase. Top-performing brands see 45-85% completion rates when surveys are timed to post-conversion moments, up to 10x higher than the same question delivered by delayed email or SMS.
Avoid asking before users understand what your app does. Pre-onboarding answers are rushed and low-quality.
For subscription apps, the strongest placement is post-paywall, right after a trial start or first purchase. Users who have converted give more intentional answers because their recall is tied to an actual decision.
2. Which Answer Options to Include in Your HDYHAU Survey
Each active paid channel needs its own option. Bucketing them as "social media" destroys the attribution signal you are trying to capture.
A practical option list for a subscription app running standard paid UA channels:
| Option | When to Include |
|---|---|
| Instagram / Facebook | Always, if running Meta campaigns |
| TikTok | Always, if running TikTok campaigns |
| Google / YouTube | Always, if running Google Ads |
| Apple Search Ads | If running ASA campaigns |
| Friend or family recommendation | Always (word-of-mouth signal) |
| Podcast / newsletter | If you run any content channels |
| Other (please specify) | Always, as a catch-all with optional text input |
Do not add options for inactive channels — they invite noise. Include "Other" with a text field as a catch-all; it captures unanticipated sources and gives early signal when a new channel starts working.
3. How to Order Survey Options to Reduce Anchoring Bias
Peer-reviewed research on survey question-order effects confirms that respondents systematically favor options that appear first, regardless of whether those options reflect their true answer.
Randomize your answer order for each user. This distributes selection bias evenly across options and makes your aggregate data more accurate over time. The impact on any individual response is small, but across thousands of responses it removes a systematic skew.
One exception: put "Other" last. Users who select "Other" are actively overriding the offered options. Placing "Other" first changes what it captures.
4. What to Tell Users Before They Answer
A single-sentence explanation ("This helps us know which channels are working so we can improve them") meaningfully improves completion. Research confirms that stating your purpose builds trust and encourages considered answers. Keep it to one sentence — longer reads as defensive.
Want to see how How did you hear about us works with your data?
Get hands-on with Airbridge and see real results.
Try It Free →How to Analyze Your "How Did You Hear About Us?" Survey Data
Collecting the data is the easy part. Interpreting it correctly is where most app marketing teams go wrong.
How to Use HDYHAU Data to Spot Under-Attribution
Compare your HDYHAU responses against what your attribution tool reports by channel. If the tool credits Meta with 200 subscriptions but HDYHAU shows 350 users selecting "Instagram" or "Facebook," you have a 1.5x correction factor to apply to your CAC calculation.
David Vargas at RevenueCat documented exactly this scenario: the gap drops an official CAC of $50 to roughly $29, and moves the profitability breakeven against LTV from day 90 to day 60. For a subscription app where cash flow determines scaling speed, that difference is not cosmetic. (Source: David Vargas, RevenueCat, 2025)
Brand-Familiarity Bias and Where It Breaks (DSPs)
HDYHAU surveys do not capture causal attribution. They capture perceived influence.
When users answer, they are asking themselves: "Where do I remember encountering this app?" Meta, Google, and TikTok benefit from this bias because they are culturally dominant — even users who found your app through an influencer, podcast, or DSP will often select the most familiar platform option.
Demand-side platforms (DSPs) are where this breaks down most visibly. DSPs buy inventory across thousands of apps and placements: games, utility apps, waiting screens. When users encounter your ad in a game and convert, they will not report the channel that served it. They will report Meta or Google. If you spend on DSPs and rely solely on HDYHAU, you will likely credit DSP-driven conversions to your standard social campaigns — making DSP appear to under-perform and social appear to over-perform until DSP spend gets cut.
This is not a flaw in the data as much as a known limitation: it measures brand familiarity, not causality. Knowing the distinction prevents you from making the wrong cut when a new channel fails to appear in your survey results.
How to Use the "Other" Response as an Early Channel Signal
When you launch a new channel, you will not see it in your HDYHAU options yet — but you will see a rise in "Other" responses. Monitor "Other" as a percentage of total responses after each new channel activation. A sustained rise that coincides with new spend is directional evidence the channel is generating awareness before you can name it explicitly.
When HDYHAU Surveys Are Reliable (and When They Mislead You)
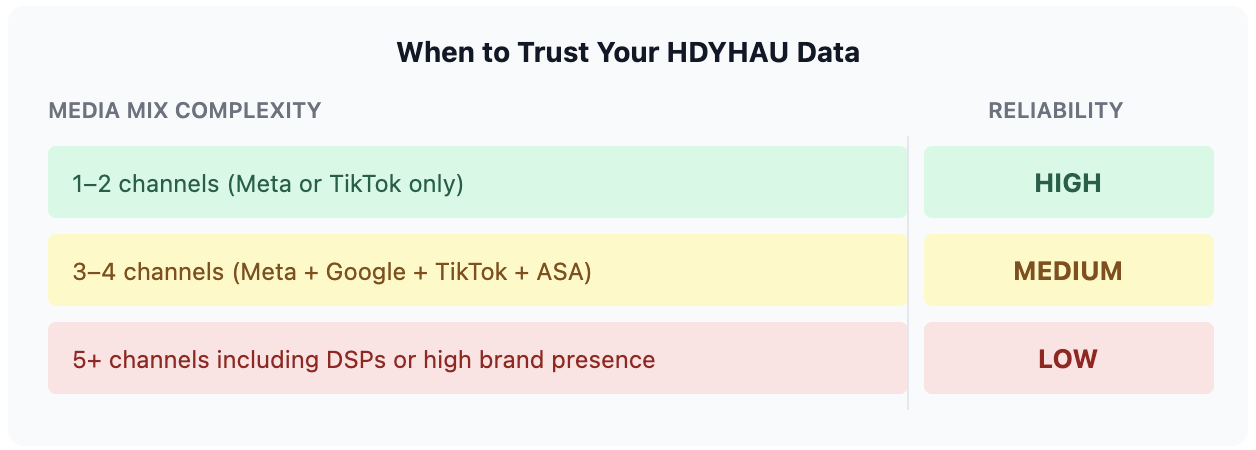
Its usefulness depends directly on how complex your media mix is.
| Scenario | HDYHAU Reliability | Why |
|---|---|---|
| 1-2 social channels (Meta or TikTok only) | High | Options map cleanly to user experience; minimal confusion |
| 3-4 standard channels (Meta, Google, TikTok, ASA) | Medium | Some cross-channel confusion, but still directional |
| 5+ channels including DSPs | Low | Users cannot distinguish DSP inventory from social; brand familiarity dominates |
| High-spend apps with broad brand presence | Low | Users "see you everywhere" and select the most familiar platform |
Reliability tiers are heuristic, based on Vargas (RevenueCat, 2025) and practitioner analysis across subscription app campaigns. Your threshold will vary with brand awareness and channel mix.
What to Use Instead When You Run More Than Three Paid Channels
Once self-reported attribution starts masking channel-level differences, pair it with methods that measure causality, not recall.
The three most practical options: incrementality tests (hold a region or segment out of a campaign and measure the conversion-rate difference — most reliable for validating new channels); Ads ON/OFF tests (pause one channel while holding others flat and watch whether volume drops); and budget ramp tests (scale a new channel from minimal spend while holding others flat and track whether baseline conversion rises). All three are slower than a survey, but they measure whether a channel actually causes subscriptions — the question that matters for budget decisions.
Self-reported data remains useful alongside these methods for qualitative context: which channels are building familiarity, where users think they came from, and which "Other" categories are growing.
How to Connect HDYHAU Data to Subscription Revenue
Grouping Users by Survey Response
Group users by their HDYHAU response ("Instagram users," "Google users," "Friend recommendation users") and compare trial-to-paid conversion rates, trial lengths, and 12-month retention. The picture looks very different from installs alone.
Industry data shows that paid users tend to churn at a higher rate than organic ones, making word-of-mouth acquisition more durable than its raw install count suggests. If "Friend or family" starts growing as a share of your HDYHAU responses, treat it as a high-value cohort signal worth tracking separately. (Source: RevenueCat, 2026)
Your Next Steps with Self-Reported Attribution
The question only earns its place in onboarding if the data changes a decision. Three steps to make that happen:
-
This week: Audit your current HDYHAU placement against the four design factors above. Is it post-conversion? Does each active paid channel have its own answer option? Is answer order randomized?
-
This month: Cross-check your top-channel HDYHAU responses against your attribution-tool numbers to compute a correction factor. If HDYHAU shows 1.5x the subscriptions your tool credits to a channel, that ratio is your working adjustment for CAC.
-
Next quarter: If you are running 3 or more paid channels, schedule a single-channel holdout test to measure causal lift. Survey responses tell you where users think they came from; a holdout test tells you whether the channel is actually responsible.

Ready to transform your mobile growth?
Learn how Airbridge helps leading brands measure and optimize every touchpoint.