Weekly vs Annual Subscription Apps: How the 2026 Revenue Split Is Shifting

The short answer: Weekly plans now generate 55.5% of all in-app subscription revenue, up from 43.3% in 2023. Monthly lost nearly half its share. Annual still dominates Health and Fitness. The right plan type for your app depends on category, not the global average.
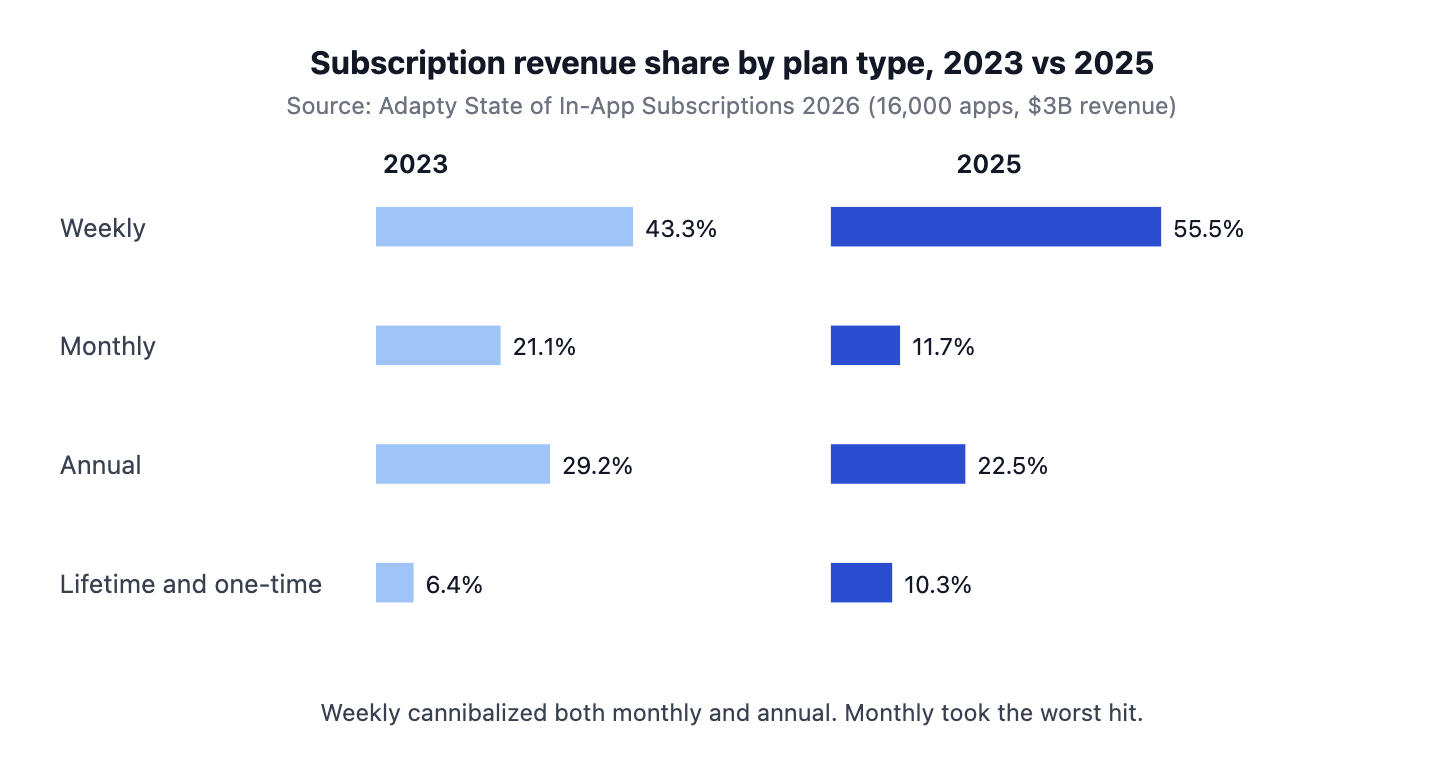
Two years ago, weekly plans generated 43.3% of all app subscription revenue. By 2025, that figure had climbed to 55.5%, according to Adapty's State of In-App Subscriptions 2026, which analyzed 16,000 apps and over $3B in subscription revenue. Monthly plans lost nearly half their share in the same window, falling from 21.1% to 11.7%. Annual slipped from 29.2% to 22.5%.
The subscription app market is reorganizing around shorter billing cycles, but the shift is not uniform. Health and Fitness doubled down on annual. Photo and Video abandoned monthly almost entirely. The plan type that works for your app depends on your category, your paywall, and how fast users can find value. Treating "weekly by default" as a universal rule is the fastest way to leave revenue on the table.
Key Takeaways
-
Weekly plans now generate 55.5% of all in-app subscription revenue, up from 43.3% in 2023. Monthly share has collapsed to 11.7%.
-
Weekly converts 1.7 to 7.4x better than annual across every price tier, but Day 380 trial-cohort retention sits at just 5.5% versus 19.9% for annual.
-
Weekly plus a free trial produces the highest 12-month LTV of any setup at $49.27. The economics rely on volume, not loyalty.
-
Health and Fitness is the only category where annual dominates, at 60.6% of category revenue. Utilities is the opposite, with 73.6% from weekly.
-
Monthly is in structural decline. It is the most price-sensitive plan type and rarely the optimal lead in 2026.
-
There is no universal default. Match plan type to category, validate with tests, and treat any blog-wide recommendation with skepticism.
Subscription App Revenue Share by Plan Type: 2023 vs 2025
The headline numbers from the 2026 in-app subscription benchmarks are blunt. Across 16,000 apps and over $3B in tracked subscription revenue, the share of dollars flowing through weekly billing cycles has crossed the majority threshold. Two years ago, weekly was the largest of three roughly comparable shares. Today, it is bigger than monthly and annual combined.
| Plan type | 2023 revenue share | 2025 revenue share | Change |
|---|---|---|---|
| Weekly | 43.3% | 55.5% | +12.2pp |
| Monthly | 21.1% | 11.7% | -9.4pp |
| Annual | 29.2% | 22.5% | -6.7pp |
| Lifetime and one-time | 6.4% | 10.3% | +3.9pp |
Source: Adapty State of In-App Subscriptions 2026.
The pattern is hard to read as anything other than a structural shift. Weekly did not just outgrow its peers, it cannibalized them. Monthly took the worst of it, losing nearly half its share in 24 months. Annual gave up ground too, although less.
A second number explains why this is happening. Across all price tiers and most categories, weekly plans convert at 1.7 to 7.4 times the rate of annual plans on the same paywall. When the same screen sells two products and one converts seven times better, that product wins. Layer in payment accessibility, anchoring effects, and an audience wary of long commitments, and weekly's dominance starts to look like a baseline.
The weekly vs annual subscription app revenue trends emerging in 2026 are clear in direction. The harder question is whether they apply to your subscription app at all.
Best Subscription Plan Type by App Category
Industry-wide averages mask the real story. Plan type performance varies sharply by app category. In some verticals, weekly is now the default to beat. In others, it is the wrong answer.
Utilities apps generate 73.6% of their revenue from weekly plans. Entertainment is similar. These categories share a trait: users want access at low commitment, repeatable in nature, with immediate value. The pitch is "stream this now" or "use this tool to finish this task," not "invest in your year."
Health and Fitness is the visible exception. Annual plans dominate the category, up from 51% revenue share in 2023. Fitness is aspirational, so signing an annual commitment matches the framing users bring to the purchase. The same data set shows Health and Fitness has the highest trial-to-paid conversion of any category at 35%, paired with the lowest first-renewal retention at 30.3% (Adapty SOIS 2026). Users commit fast and churn fast. Annual locks in revenue before motivation fades.
| Category | Dominant plan | Notes |
|---|---|---|
| Utilities | Weekly (73.6%) | Highest 12-month trial-cohort LTV at $68.90 |
| Entertainment | Weekly | Heavy weekly share, refund spikes in APAC |
| Photo and Video | Weekly | Declining concentration as AI tools enter |
| Gaming | Weekly | RevenueCat reports gaming weekly share at 77% |
| Health and Fitness | Annual (60.6%) | Only category where annual share increased since 2023 |
| Productivity | Mixed | Direct buyers worth $56.95 vs $49.13 for trial users |
| Lifestyle | Mixed | Trials reduce 12-month LTV by 21.2% |
| Education | Annual or weekly | Annual LTV around $43 is solid, weekly competitive |
Source: Adapty SOIS 2026, except where noted.
Two patterns are worth pulling out:
-
Regional skew matters. RevenueCat's analysis of weekly plan adoption shows India, Southeast Asia, the Middle East, and parts of Latin America skew heavier toward weekly than North America does. The driver is payment infrastructure and disposable-income patterns more than user preference.
-
Lifestyle is the rule-breaker. It is the only category where adding a free trial actively reduces 12-month LTV (down 21.2%). If you are running trial-heavy acquisition for a Lifestyle app, the data argues you are systematically pulling in lower-quality subscribers.
Want to see how Weekly vs annual subscription apps works with your data?
Get hands-on with Airbridge and see real results.
Try It Free →Subscription App LTV by Plan Type: Why $49.27 Weekly Beats $36.51 Annual
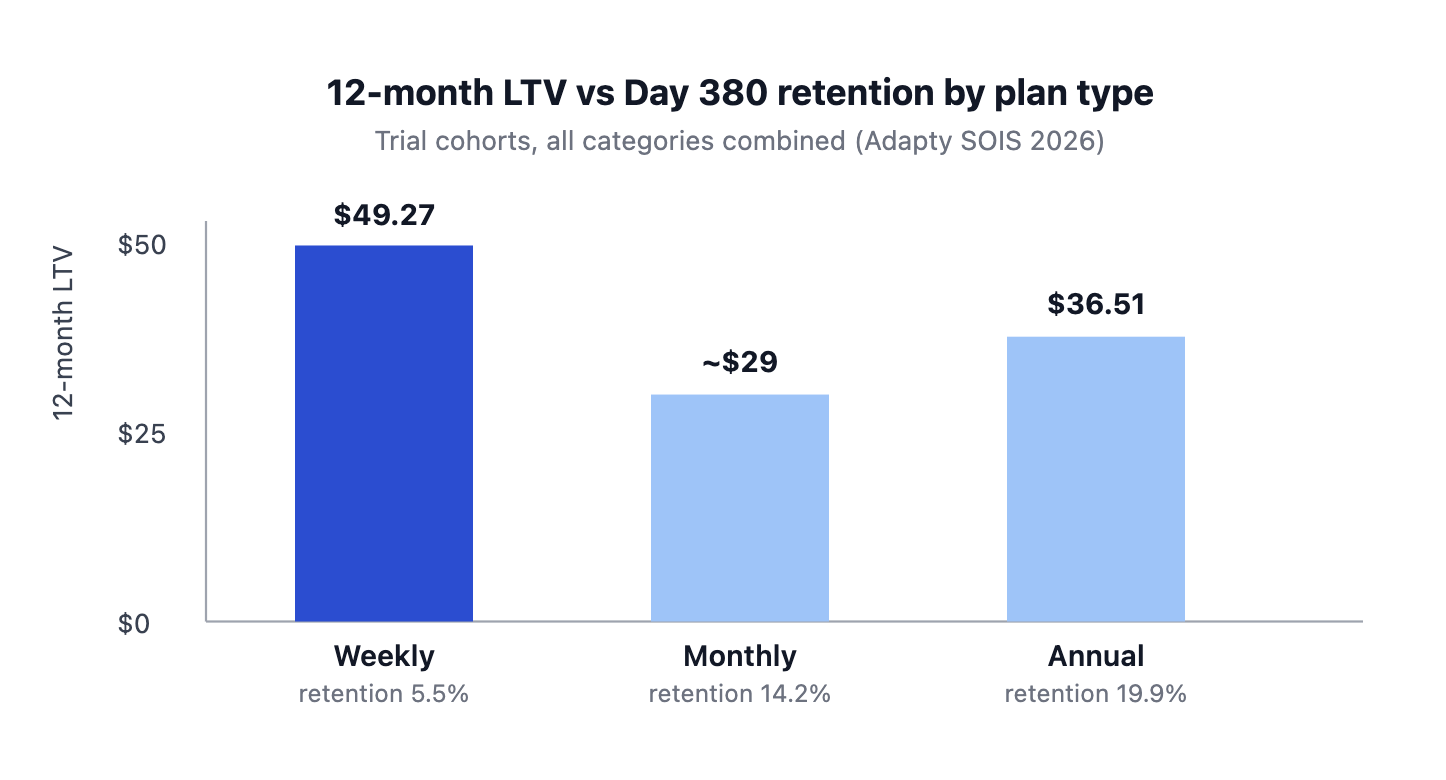
Weekly wins on conversion. Annual wins on retention. The interesting question is which one wins on lifetime revenue.
| Plan type | 12-month LTV (trial-starting cohort) | Day 380 trial-cohort retention | First-renewal rate |
|---|---|---|---|
| Weekly + trial | $49.27 | 5.5% | ~74 to 81% |
| Monthly + trial | ~$28 to $30 | 14.2% | 48 to 58% |
| Annual + trial | $36.51 | 19.9% | 66.3% |
Source: Adapty State of In-App Subscriptions 2026 (trial-starting cohorts).
Why Weekly Plus Trial Wins on 12-Month LTV
Across all categories combined, weekly plus a free trial produces the highest 12-month LTV at $49.27 per user, ahead of annual plus trial at $36.51. The mechanism is volume. Day 0 LTV on a weekly plan is the lowest of any configuration: you collect $7 to $9 upfront instead of $38 to $54 on annual. But the repeated short renewal cycles compound, and when paired with a trial, the renewal rate at the first weekly checkpoint stays above 70% on average.
The Retention Catch
Only 5.5% of weekly trial-starting subscribers are still active at Day 380. Annual trial subscribers retain at 19.9% at the same checkpoint, monthly at 14.2%. Weekly LTV depends entirely on a meaningful share of cohorts surviving the first six renewals. If first-week retention slips below the mid-teens, the math collapses fast.
How Annual Plays a Different Game
Annual offers lower conversion volume, much higher per-user value, and a long retention runway. The churn pattern for annual is also unique: users tend to stay through the full 12-month cycle because they have already paid, then churn in the renewal window. Your retention efforts around month 10 to 11 matter more than anything you do in the first month.
One more counterintuitive note from the same data set: weekly plans are the least price-sensitive of any plan type at renewal. Weekly first-renewal stays in a tight 74 to 81% band across every price tier in the Adapty cut. If you are on weekly today, raising your price is lower risk than your instinct suggests.
Why Monthly Subscription Plans Are in Structural Decline
Monthly used to be the safe middle. In 2025, it is the worst seat at the table for most categories. It converts worse than weekly, retains worse than annual, and gets squeezed harder than either when prices move.
What Changed: Monthly Lost Nearly Half Its Revenue Share
Two years ago, monthly plans collected 21.1% of all subscription revenue. In 2025, that share is 11.7%. The drop is steeper than annual's decline in the same window, and it shows no sign of reversing. Per the Adapty SOIS 2026 dataset, the decline is broad-based, hitting most categories rather than a single vertical.
Why Monthly Is the Most Price-Sensitive Plan Type
The price-sensitivity data is the clearest signal that monthly's middle position is failing. Three points stand out:
-
First-renewal rates on monthly plans drop 8 to 10 percentage points as price moves from the cheapest tier to the most expensive.
-
Weekly first-renewal stays in a tight 74 to 81% band across price buckets. Price barely moves the needle.
-
Annual varies by category but never as steeply as monthly.
Whatever buffer monthly used to have between low-commitment users and high-commitment ones has eroded. Users either want the lowest commitment they can find (weekly) or are willing to commit for the full value cycle (annual).
Where Monthly Still Wins: Lifestyle Apps
There is one category where monthly still earns its place as a lead plan: Lifestyle. What makes Lifestyle different is its trial behavior. It is the only category where adding a free trial reduces 12-month LTV by 21.2% (direct buyers at $42.80 versus trial starters at $33.80, per Adapty SOIS 2026). The combination of solid monthly economics and trial-hostile dynamics makes "monthly without trial" a defensible default for Lifestyle apps. That pattern does not transfer to other categories.
European Monthly Plans Carry Extra Price-Sensitivity Risk
European monthly subscribers are unusually price-sensitive at renewal. Low-priced European monthly apps see roughly 40% higher first-renewal rates than high-priced ones. If you are running monthly in Europe, pricing decisions carry more downside risk than anywhere else in the dataset.
How to Use Monthly in 2026: As an Anchor, Not a Lead
For everyone outside Lifestyle, monthly works best as an anchor option on a three-plan paywall, not as the primary offer. Two reasons:
-
Anchoring lifts the surrounding plans. Showing weekly, monthly, and annual together generally outperforms single-plan paywalls. Annual makes monthly look fair. Monthly makes weekly look accessible.
-
Leading with monthly starts you in a worse position. Conversion is below weekly and retention is below annual. The category-level data does not support monthly as a lead choice in 2026.
How to Choose the Right Subscription Plan Type for Your App in 2026
The temptation when reading data like this is to swap weekly into the default slot and ship it. The data does not actually support that move. What it supports is a category-driven decision, validated with structured tests against the cohorts you already have.
A practical decision framework, distilled from the Adapty SOIS 2026 dataset:
-
Start from your category, not the global average. Health and Fitness, Education, and Travel skew annual. Utilities, Entertainment, Gaming, and Photo and Video skew weekly. Productivity and Lifestyle are split.
-
Match plan duration to value frequency. If users get value in a single session, weekly is plausible. If value compounds over weeks, annual with a trial usually beats weekly.
-
Audit the trial-vs-direct LTV gap in your category. In Productivity ($56.95 direct vs $49.13 trial) and Lifestyle ($42.80 vs $33.80), direct buyers are more valuable than trial users. Adding a trial there may quietly lower subscriber quality.
-
Price up before changing plan duration. High-priced apps generate 3x the LTV of low-priced apps in most categories. In Health and Fitness, expensive annual plans generate 4.5x the LTV of cheap ones. Pricing is usually the lever, not duration.
-
Test, do not adopt by default. Apps that run 50 or more paywall experiments earn 18.7x more revenue than apps that run just one. The win is in the testing process, not the choice of plan type.
Subscription App Plan Strategy: What to Watch Next
If you are a Utilities or Entertainment app still leading with monthly, you are leaving the majority of category revenue to weekly-led competitors. If you are a Health and Fitness app defaulting to weekly, the data argues you are burning the annual ceiling.
The next twelve months will tell whether weekly's share crests above 60% or whether the rebalance has overshot. Watch the 2027 Adapty cut for the inflection. In the meantime, pick the plan your category supports, validate with structured tests, and re-check as activation matures.

Ready to transform your mobile growth?
Learn how Airbridge helps leading brands measure and optimize every touchpoint.