Your Marketing Dashboard Is Missing the Only Metric That Matters — Cost Per Subscriber by Channel
A fitness app growth team runs Meta, Google, and Apple Search Ads campaigns. Meta Ads Manager reports 4,200 installs at $2.38 CPI. Google shows 2,800 installs at $3.10 CPI. RevenueCat logs 189 paid subscribers for the month. But no single dashboard connects those 189 subscribers back to the channel that drove them.
The team knows total subscriber count. They know total ad spend. What they cannot see is cost per subscriber by channel, which means every budget reallocation is based on install volume, not subscription revenue. For a fitness app spending $15,000 per month on paid acquisition, optimizing for CPI instead of CPS (Cost per Subscription) can mean scaling the channel that produces the cheapest installs while starving the one that produces the most paying subscribers.
Key Takeaways
- Marketing dashboards show installs, not subscribers. Ad platforms track clicks and installs but have no visibility into subscription events that happen days or weeks later.
- CPI and CPS often point in opposite directions. The channel with the lowest cost per install frequently has the highest cost per subscriber, making install-based optimization counterproductive for subscription apps.
- The gap exists because subscription data lives in a separate system. RevenueCat or Adapty tracks who subscribed, but that data never connects back to the ad platform natively.
- Health and fitness apps face compounding seasonal distortion. January resolution spikes inflate install numbers while March churn erodes subscriber counts, making channel-level CPS even harder to track without attribution.
- Airbridge Core Plan connects ad spend to subscription revenue in one view. With native RevenueCat and Adapty integrations, it surfaces cost per subscriber by channel without requiring custom data pipelines.
Why Marketing Dashboards Hide Cost Per Subscriber
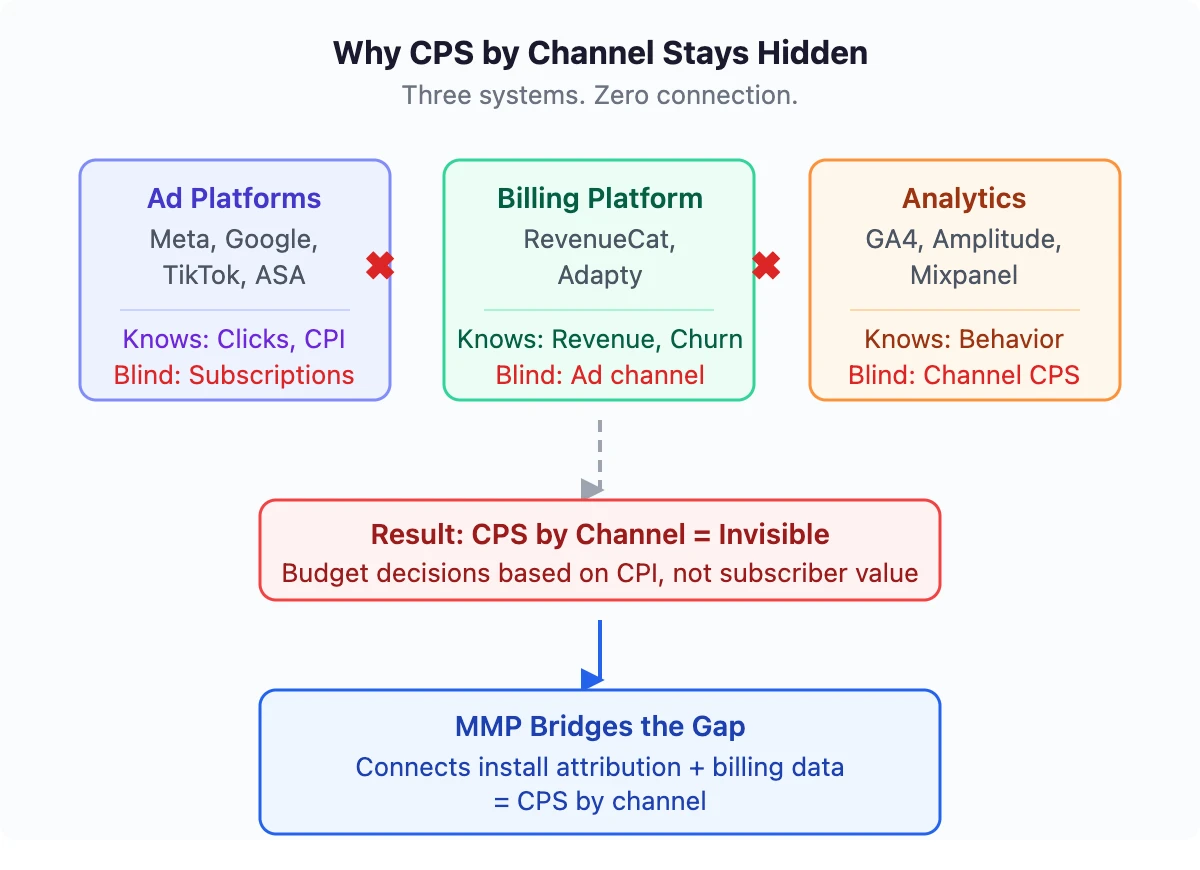
A marketing dashboard that only shows CPI creates a structural blind spot for subscription apps. The problem is not a feature missing from one tool. It is an architectural gap between three systems that were never designed to talk to each other.
1. Ad Platforms, Billing Systems, and Analytics Operate in Silos
When a user subscribes, the payment is processed by Apple or Google, not by the ad platform that drove the install. RevenueCat, Adapty, or the App Store tracks who subscribed, renewed, or churned. Meta and Google know nothing about this.
This creates three disconnected data layers:
| System | What It Knows | What It Cannot See |
|---|---|---|
| Ad platforms (Meta, Google, TikTok) | Clicks, installs, CPI | Trial starts, subscriptions, renewals |
| Billing platforms (RevenueCat, Adapty) | Subscribers, revenue, churn | Which ad or channel drove each subscriber |
| Analytics tools (GA4, Amplitude) | In-app behavior, sessions | Channel-level subscription attribution |
Without a Mobile Measurement Partner (MMP) bridging these layers, CPS by channel remains invisible.
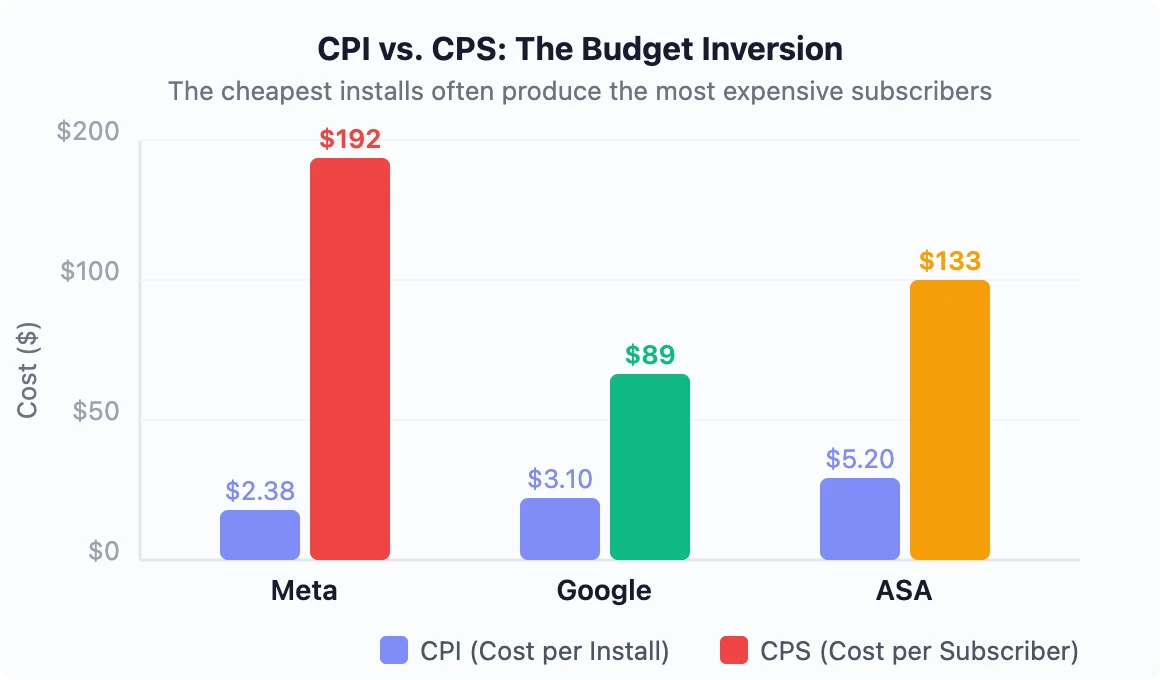
2. The CPI vs. CPS Inversion Problem
The disconnect creates a measurable budget risk. Consider this fitness app scenario:
| Channel | Installs | CPI | Subscribers | CPS | Budget Signal |
|---|---|---|---|---|---|
| Meta Ads | 4,200 | $2.38 | 52 | $192 | Reduce |
| Google Ads | 2,800 | $3.10 | 98 | $89 | Scale |
| Apple Search Ads | 1,000 | $5.20 | 39 | $133 | Optimize |
A dashboard showing only CPI would scale Meta ($2.38 CPI) and cut Apple Search Ads ($5.20 CPI). But the subscription data tells the opposite story: Google produces subscribers at nearly half the cost of Meta. Without CPS visibility, the team systematically scales the most expensive subscriber channel while cutting efficient ones.
This is not a hypothetical risk. According to the RevenueCat State of Subscription Apps 2025 report, the median Health & Fitness app trial-to-paid conversion-rate" class="glossary-link" title="Conversion Rate">conversion rate is 39.9%, but this rate varies dramatically by acquisition channel. Teams that cannot measure channel-level conversion are optimizing blind.
3. Algorithm Optimization Without CPS Feeds the Wrong Signal
Meta's Advantage+ campaigns, Google's App Campaigns, and TikTok's Smart Performance Campaigns all use machine learning to find users most likely to complete a target event. If that target event is "install," the algorithm optimizes for users who download quickly, not users who subscribe.
This creates a compounding problem. The algorithm learns from install signals, finds more install-prone users, and reports declining CPI as proof of efficiency. Meanwhile, the trial-to-subscription conversion rate silently declines because the new users were never high-intent subscribers. The marketing dashboard shows improving CPI while actual CPS climbs.
Without feeding subscription events back through an MMP, the growth team has no way to detect this signal degradation. They see a "healthy" dashboard and keep scaling spend into an algorithm that is optimizing for the wrong outcome.
4. Seasonal Spikes Amplify the Problem for Fitness Apps
Health and fitness apps face a unique attribution challenge. January resolution campaigns generate massive install spikes, but most subscription conversions happen 7 to 30 days after install, well past the resolution window. By March, churn accelerates and the true subscriber value of each January channel is buried under aggregate numbers.
The RevenueCat State of Subscription Apps 2025 report shows that Health & Fitness has one of the highest trial-to-paid rates (39.9% median), yet this metric varies sharply by acquisition source. A channel that drives 10,000 resolution installs in January may produce only 200 subscribers by March. A smaller channel with 2,000 installs may produce 300 subscribers who remain active through June. Without CPS by channel, the seasonal noise hides the signal.
This is especially damaging for fitness apps because the AppsFlyer 2026 State of Subscriptions report found that Health & Fitness UA budget concentration among top apps increased from 54% to 73%. In a market where the biggest spenders dominate, smaller teams cannot afford to waste budget on high-CPI-low-CPS channels.
Growth teams that measure only aggregate subscriber count across all channels lose the ability to make channel-specific budget decisions during the highest-stakes period of the year.
Start measuring what matters — for free
Airbridge Core Plan gives growing teams real attribution, deep linking, and audience tools at no cost.
Get Started Free →How to Build a Unified Marketing Dashboard for Subscription Revenue
The CPS visibility gap is solvable. It requires connecting attribution data to billing data so that every subscriber traces back to the channel, campaign, and creative that drove the original install.
General Approaches to Unifying Dashboard Data
Growth teams can take immediate steps to close the CPS gap, regardless of their current tooling:
- Align attribution windows across all ad platforms. Set Meta, Google, and TikTok to the same click and view-through lookback periods so comparisons are apples-to-apples.
- Export RevenueCat subscriber data and join it with install-level attribution data in a spreadsheet. Manual but possible for teams under 5,000 monthly installs.
- Set up UTM parameters for web-to-app flows to track which landing pages contribute to subscriptions.
- Build a weekly CPS-by-channel report using combined exports from your ad platforms and billing system. Even a manual process forces the team to look at subscriber acquisition cost, not just install cost.
These steps improve CPS visibility but remain manual, error-prone at scale, and disconnected from real-time decisions.
How Airbridge Core Plan Unifies Cost Per Subscriber Tracking
Airbridge Core Plan was designed to answer one question: "Are paid users converting into subscriptions, and which channels are driving value?"
Instead of requiring growth teams to stitch together data from three separate systems, Core Plan connects attribution signals directly to subscription billing data. This is how it works for subscription apps:
1) Attribution across GMAT channels. Core Plan integrates natively with Meta, Google, Apple Search Ads, and TikTok (the four Self-Attributing Networks that represent 80 to 90% of early-stage paid acquisition spend). Every install is attributed to the channel, campaign, and creative that drove it.
2) Subscription billing integration. Native RevenueCat and Adapty integrations bring subscription events (Start Trial, Subscribe, Unsubscribe) directly into the attribution pipeline. No custom backend work required.
3) Six built-in reports that surface CPS. The Revenue report attributes subscription revenue by channel. The Funnel report shows where users drop off between install, trial, and subscription. Together, they surface cost per subscriber by channel in one view.
| Capability | Enterprise MMP | Airbridge Core Plan |
|---|---|---|
| Billing integration (RevenueCat, Adapty) | Native (included in higher tiers) | Native (included in base) |
| CPS by channel report | Available (requires configuration) | Built into Revenue report |
| Minimum contract | Annual, $10K+ | Pay-as-you-go, 15K free installs |
| Setup guidance | General-purpose | Subscription-app focused |
| Event configuration | Predefined + custom events | 25 subscription-optimized standard events |
| Unnecessary features | Fraud detection, raw export, agency access | Intentionally removed |
Core Plan does not support custom events or non-SAN ad networks. These are intentional design decisions. The 25 standard events cover the subscription funnel (Install, Sign-up, Start Trial, Subscribe, Unsubscribe), and GMAT channels cover the platforms where most subscription apps concentrate spend. Two third-party integrations (such as RevenueCat + Amplitude) keep the stack focused. The result is fewer setup decisions and faster Time-to-Value.
For teams spending $5,000 to $20,000 per month on paid UA, the pricing removes the cost barrier: 15K free attributed installs, then $0.05 per install. No annual contracts. No minimum commitments. Compared to enterprise MMPs that require $10K+ annual agreements before usage costs begin, Core Plan lets fitness app teams start measuring CPS by channel without adding a fixed cost line to their budget.
If you currently export data from Meta Ads Manager, Google Ads, and RevenueCat into separate spreadsheets to calculate CPS manually, Core Plan replaces that workflow with a single attribution pipeline that connects the install event to the subscription event automatically.
If your current marketing dashboard shows CPI but not CPS by channel, see how Airbridge Core Plan connects installs to subscription revenue.
FAQ: Marketing Dashboards and Subscription Attribution
How does CPS differ from CPI for subscription app budget decisions?
CPI (Cost per Install) measures what you pay to acquire a download. CPS (Cost per Subscription) measures what you pay to acquire a paying subscriber. For subscription apps, CPI alone is misleading because a channel with cheap installs may produce very few subscribers. Budget decisions based on CPI can scale the wrong channels and waste 30 to 50% of ad spend on non-converting traffic.
When should a subscription app move from manual CPS tracking to an MMP?
Manual CPS tracking (spreadsheets combining ad platform and RevenueCat exports) works at low volume but breaks above roughly 5,000 monthly installs across 2 or more channels. At that scale, attribution windows, deduplication, and the delay between install and subscription make manual reconciliation unreliable. An MMP automates this connection and provides real-time CPS visibility.
Can GA4 replace an MMP for measuring cost per subscriber by channel?
GA4 tracks in-app behavior and can report subscription events, but it uses a session-based attribution model that does not deduplicate across Self-Attributing Networks (SANs). When Meta and Google both claim credit for the same install, GA4 has no mechanism to resolve the conflict. For channel-level CPS, an MMP provides the deterministic attribution that GA4 cannot.
The Dashboard Metric That Decides Where Your Next Dollar Goes
Every dollar your growth team cannot trace from ad click to paid subscriber is a dollar allocated by assumption, not evidence. For subscription apps running paid UA across Meta, Google, and Apple Search Ads, the gap between what your dashboard shows (installs) and what your business needs (subscriber acquisition cost by channel) is not a reporting inconvenience. It is the structural reason budgets flow to the wrong channels.
Start Free with Airbridge Core Plan and see cost per subscriber by channel with 15K free attributed installs.


Ready to see what Core Plan can do?
Free attribution, deep linking, and audience tools — built for teams that are ready to grow.