How to Spot Users Who Are About to Churn Before They Leave

App churn doesn't announce itself. By the time a subscriber cancels, the decision was made weeks earlier. Their sessions grew shorter, core features went untouched, and eventually they stopped opening the app.
The data to detect this is already in your product. "Not Enough Usage" is the single leading cause of subscription cancellations, accounting for 37.02% of all churn. That decline in usage happens before the cancellation event. The early churn signals subscription app teams overlook are already visible in your analytics. The challenge is knowing which ones to track and when they become actionable.
Key Takeaways
-
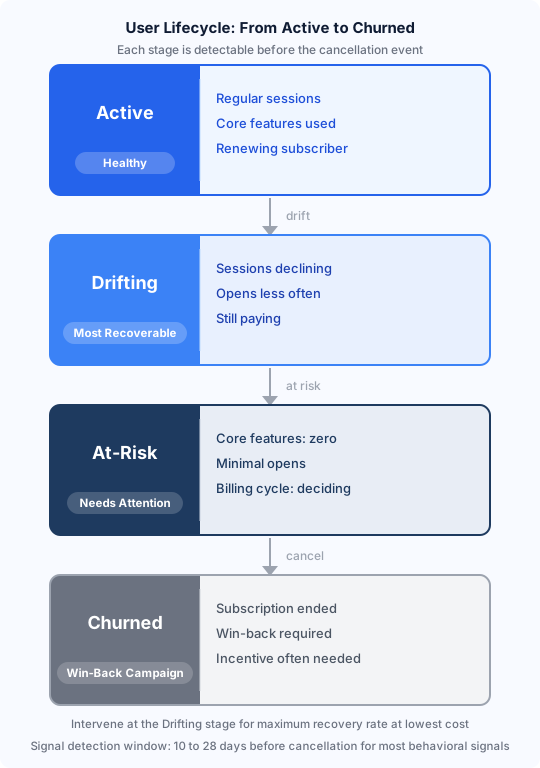
Churn is a staged process, not a sudden event. Users move from Active to Drifting to At-Risk before canceling. Each stage is visible in behavioral data if you track the right metrics.
-
The first renewal window is your highest-risk moment. Nearly 30% of annual subscribers cancel within the first month of their subscription.
-
Session frequency decline is the earliest reliable signal. A drop in weekly app opens typically precedes cancellation by 10 to 28 days for most subscription apps.
-
Segment disengaged users before messaging them. Drifting users (still paying, declining usage) need different messaging than at-risk users who haven't opened the app in 30-plus days.
-
Response timing determines recovery rate. The window to recover a disengaged subscriber narrows with each passing day. Behavioral triggers fire when intent is still present.
Why Churn Starts Long Before Cancellation
Most teams measure churn at the point of cancellation. That captures the outcome, not the cause.
1. The drift-to-churn progression
Every user who eventually churns passes through three observable stages before canceling:
-
Drifting. Still subscribed, still paying. Session frequency is declining but not zero. Core feature engagement is decreasing. This is the most recoverable stage, and the one most teams miss entirely.
-
At-Risk. Session frequency has dropped significantly. Core feature engagement is near zero. The user is one billing cycle away from making a deliberate cancellation decision.
-
Churned. Subscription canceled. Recovery now requires a dedicated win-back campaign and, in most cases, a direct incentive.
Drifting users are recoverable with relevance and timing. Waiting until the At-Risk stage requires a heavier intervention. Waiting until Churned makes recovery costly and statistically unlikely.
2. Why the first renewal window is the highest-risk moment
Nearly 30% of annual subscriptions are canceled in the first month. For monthly subscribers, the median 12-month retention rate is 17.0%. More than 4 in 5 monthly subscribers have churned within a year of their first payment.
The first renewal is when users make a conscious re-evaluation: is this app still worth continuing? If they haven't experienced your core value by that point, the decision is already formed. Detecting disengagement before that evaluation window is where interventions carry the most leverage.
Further reading: Why Subscription Churn Happens: Top 5 Cancellation Reasons Forecast for Mobile Apps in 2026 — a deeper look at the underlying reasons subscribers cancel, with forecasts for 2026 across categories and business models.
Want to see how Churn rate works with your data?
Get hands-on with Airbridge and see real results.
Try It Free →5 Early Warning Signals of App Churn
Pre-churn signals fall into two categories: behavioral (what users do in-app) and transactional (how they interact with billing). Both appear before cancellation. Both are trackable today.
1. Session frequency decline
The most reliable early indicator of impending app churn. Many subscription teams observe session counts starting to decline 10 to 28 days before subscribers cancel. That window is large enough to intervene.
Set a session frequency baseline for each user cohort during their first 30 days. When a user's weekly session count drops below 50% of that baseline, flag them for re-engagement. Track opens per week, not session duration. A user can open your app briefly and still be drifting. Frequency is a more forward-looking predictor than time-on-app.
2. Core feature disengagement
Not all features are equal predictors of retention. Identify the one or two features that your highest lifetime value (LTV) subscribers engage with consistently. When a user stops using those features, that is a stronger churn signal than general inactivity.
Retained users have built a habit around a specific workflow in your app. A break in that habit pattern predicts drift more precisely than aggregate engagement scores alone. This includes not completing a workout, not logging a session, or not reviewing a document. This behavior is your activation metric: the single action that most reliably separates churners from retainers.
3. Billing friction and payment failures
Not all app churn is voluntary. Payment failures from expired cards or declined transactions drive a meaningful share of involuntary cancellations. Apple's iOS billing grace period is opt-in and must be activated in App Store Connect. Google Play has grace period enabled by default, but you should verify the length (3 days by default) and ensure account hold is also configured. If iOS grace period is not active in your app, you are losing paying subscribers to billing failures who would otherwise have renewed.
Monitor billing error events in real time. A proactive notification sent within hours of a payment failure recovers materially more users than one sent 48 hours after the event.
4. Negative sentiment signals
Users who are about to churn often express dissatisfaction before they act on it. An uptick in 1 to 2 star app store reviews is a leading indicator of subscriber dissatisfaction. These reviews typically surface before users reach the cancellation screen. Monitor review sentiment on a rolling basis, not just at launch or after major updates.
If you run an in-app NPS survey, segment detractors (scores 0 to 6) immediately. These users represent your highest churn-risk cohort. A personalized outreach within 24 hours of a detractor score gives you a recovery window before they reach the cancellation screen. For a broader view of how lifecycle marketing sequences map to each engagement stage, that context helps you design the right follow-up for each signal type.
5. Plan downgrade intent
A user who navigates to their subscription settings, views downgrade options, and exits without completing the action is signaling cost sensitivity or value uncertainty. Track these downgrade intent events in your analytics tool. They require a different response than passive drift. The underlying issue is usually perceived value, not product failure, and a well-timed feature highlight, plan pause option, or concierge outreach can address it before the user takes action.
| Early Warning Signal | What to Monitor | Typical Window Before Cancellation |
|---|---|---|
| Session frequency drop | Opens per week vs. cohort baseline | 14 to 21 days |
| Core feature abandonment | Activation metric engagement | 10 to 21 days |
| Payment failures | Billing error events | Same day |
| Negative sentiment | App store ratings, NPS detractor scores | Before action is taken |
| Downgrade intent | Plan change intent events | Immediate |
How to Act on Pre-Churn Signals
Detecting a signal without a response system in place is an incomplete loop.
1. Segment before messaging
Send different messages to different disengagement stages. A user who hasn't opened your app in 10 days is in a different state than one who hasn't opened it in 45 days.
Drifting users respond well to personalized re-engagement: where they left off, a feature they haven't tried, a milestone they are close to. At-risk users often need a more direct offer: a pause option, a plan adjustment, or a short-term discount targeted to this segment. Sending a discount to a drifting user who would re-engage without one trains future users to expect discounts before reactivating.
2. Time your response precisely
The highest-leverage moment is immediately after a disengagement signal fires, not several days later. A push notification sent within minutes of a cancellation-intent behavior converts at meaningfully higher rates than one sent 48 hours after the event.
Tie your re-engagement cadence to natural product use cases. A wellness app should nudge during morning routines. A productivity app should nudge at the start of the work week. Mistimed notifications train users to ignore them. For teams running paid UA, understanding how attribution windows affect cohort timing helps you read churn patterns by acquisition source more accurately.
Stop Guessing. Know Which Campaigns Drive Your Churn.
App churn is measurable when you track the right signals. Session frequency, core feature engagement, billing errors, NPS scores, and downgrade intent all appear in your product analytics before a subscriber cancels. The gap most teams face is not in the data itself — it is in connecting those behavioral signals back to the acquisition sources that created those users in the first place.
Understanding which paid UA channels produce high-churn cohorts, not just high-install numbers, is where the picture becomes complete. Airbridge Core Plan connects your Meta, Google, Apple Search Ads, and TikTok campaigns to subscription lifecycle events including Unsubscribe, so you can see which acquisition sources drive subscribers who renew versus those who cancel within 30 days. Start free with 15K attributed installs.

Ready to transform your mobile growth?
Learn how Airbridge helps leading brands measure and optimize every touchpoint.