How to Set Your First 30-Day Paid UA Plan for Subscription Apps

You have the idea to advertise your subscription app. But when you open Meta or Google Ads, you're faced with endless options: channels, budgets, audiences, creatives, placements. Without an execution plan, most early-stage founders either freeze or spend money inefficiently. The result is burned budget with minimal learning.
The difference between a founder who wastes $10K and one who turns it into a profitable playbook isn't luck — it's structure. This guide gives you a step-by-step plan to spend your first $10K–$50K with intention, learn fast, and build the foundation for sustainable growth.
Key Takeaways
-
Unit economics come before budget. Know your LTV (Lifetime Value) and CAC (Cost to Acquire a Customer) target before you set daily spend. Otherwise you're guessing at a number with no basis.
-
Start with one channel. Meta, Google, or TikTok. Prove one works before you diversify. Spreading budget thin across all channels kills both reach and learning.
-
Structure your 30 days as three phases. Week 1 is learning (spend 30% of budget). Weeks 2–3 is testing and scaling (50%). Week 4 is validation (20%).
-
Measure cohorts, not actuals. Ad networks, your attribution tool, and your app's revenue dashboard all report different numbers. Establish one source of truth before Week 2.
-
Paywall placement matters before ad spend. Fix your onboarding and paywall timing first, then scale acquisition. This single lever affects your CR (conversion-rate) more than any creative.
Phase 1: Calculate Your Unit Economics & Set Up Your Paywall (Days 1–5)
Before you spend a single dollar on ads, you need to know what that dollar should achieve. This phase also includes paywall validation—the strongest lever you control before acquiring users.
1. Know Your LTV (Lifetime Value)
LTV = Average subscription price × Average months a subscriber stays
Quick example: $9.99/month × 8 months = $80 LTV
Adjust upward if:
-
You have upsells (annual plans, add-ons, consumables) per RevenueCat's Hybrid Monetization Guide
-
Targeting high-LTV markets like North America
Industry benchmarks (12-month, per paying user):
| Category | Median | P90 |
|---|---|---|
| Health & Fitness | $27 | $86 |
| Business | $27 | $112 |
| Education | $18 | $75 |
| Gaming | $8 | $32 |
If brand new: Use $15–$25 conservatively. Refine after 100–200 paying users.If you have data: Pull D7, D30, D60 retention from RevenueCat or Adapty and calculate actual LTV.
2. Reverse-Engineer Your CAC Target
A common industry benchmark: LTV should be at least 3–5x your CAC to sustain growth.
If LTV = $20, CAC target = $4–$6 per paying subscriber
Why 3–5x buffer?
-
Ad platform overhead (~15% variance)
-
Not all installs → trials; not all trials → subscriptions
-
Costs rise as you scale
CAC per install vs. CAC per subscriber: Your actual conversion funnel looks like:
| Stage | Rate | Example |
|---|---|---|
| Installs → Trials | 4–12% | 1,000 installs → 60 trials |
| Trials → Paid | 35–45% | 60 trials → 24 subscriptions |
| Total | 1.4–5.4% | 1,000 installs → 24 subs |
If you want $5 CAC per subscriber: $5 ÷ 2.4% = $208 CAC per install needed
Reality check: iOS CPI is $5–$15. Android is $1–$4. If your CAC per install target is high, that's fine. It just means lower trial-to-paid conversion. Fix it with paywall optimization.
Paywall impact: Hard paywalls convert at 12.1% (D35) vs. 2.2% for freemium. That's 5.5x higher. Choose your model first; it determines your budget size.
3. Define Your First 30-Day Goal
Now set a realistic target for the 30-day period.
If you're bootstrapped: Aim for 500–1000 trial starts or 50–150 paying subscribers. At $3 CPI, that's $1,500–$3,000 spend.
If you have seed funding: Aim for 3,000–5,000 trial starts or 300–500 paying subscribers. At $3 CPI, that's $9,000–$15,000 spend.> Your goal is not maximum revenue in 30 days. Your goal is learning which channels, audiences, and creatives work for your app. Revenue is secondary.
4. Validate Your Paywall Before Week 1
82% of free trials start on Day 0. Paywall placement matters more than any creative. Quick checks:
Paywall timing: Does the user see value before hitting the paywall? Hard paywalls see 12.1% D35 conversion versus 2.2% for freemium. That's 5.5x higher.
Trial length: Longer trials (17–32 days) convert at 45.7% vs. shorter trials (3–7 days) at 26.8%. If cash flow is tight, optimize paywall messaging instead of extending trial.
Don't launch ad campaigns until your paywall passes this test: Have 10 friends install your app and count how many hit the paywall without abandoning.
Phase 2: Pick the Platform That Will Win for Your App (Days 5–7)
You have four main options for user acquisition: Meta, Google App Campaigns, TikTok, or Apple Search Ads. Trying all four simultaneously in a first 30-day campaign guarantees confusion.
Choose one. Here's how to decide:
1. Meta (Facebook/Instagram) — Maximum Control & Scale
Best for: First-time marketers, all app categories.
Meta offers the strongest combination of targeting precision and scale for subscription apps. You can target by interest, behavior, lookalike audiences, and detailed demographics. Costs are moderate: $3–$8 CPI depending on category.
Setup: Create Advantage+ Shopping Campaigns (Meta's automated format). Provide 3–5 app install creatives (mix of video and static). Let Meta's algorithm optimize for you.
Timeline: Results typically visible in 3–5 days (varies by budget and category).
Drawback: Saturation in competitive categories (dating, fitness) means higher costs and faster creative fatigue.
2. Google App Campaigns — Algorithmic, Low-Effort Setup
Best for: Apps with clear, differentiated messaging; educators.
Google App Campaigns (UAC) use machine learning to find install-hungry users across Google's entire network (Play Store, YouTube, Admob, Gmail, Google Search). Minimal setup: provide headlines, app descriptions, and a few creatives. Google tests combinations and optimizes.
Setup: Simpler than Meta. Set budget, provide assets, let Google learn.
Timeline: Results typically visible in 5–7 days (varies by budget and category).
Drawback: Less targeting control than Meta. You can't pick specific audiences; you trust Google's algorithm.
3. TikTok Ads — Top-of-Funnel, Younger Audiences
Best for: Apps targeting Gen Z (under 35), trendy categories (fitness, lifestyle, entertainment).
TikTok excels at awareness but has fast creative fatigue. Users expect TikTok-native, authentic-feeling ads (not polished brand content). CPI can be competitive with Meta, though actual costs vary by category and geography.
Setup: Create 5–10 different creative variants (short-form video). Expect to refresh them weekly because users quickly tune out repeats.
Timeline: Results typically visible in 2–3 days (varies by budget and category), but require active management.
Drawback: Burnout. If your app isn't inherently TikTok-native (fitness, lifestyle), it's harder to create enough organic-feeling creatives.
4. Apple Search Ads — High-Intent Users Only
Best for: Apps with strong brand search volume, productivity, utility categories.
Apple Search Ads only show to users actively searching for your app or competitors on the App Store. This is high-intent traffic. CPI is higher ($5–$15) but conversion is strong because users are already in purchase mindset.
Setup: Bid on your brand terms and top 5–10 competitor terms. Set daily budget ($5–$20).
Timeline: Results typically visible in 1–2 days (varies by search volume). Easiest to start; hardest to scale.
Drawback: Only scales if people are searching for your category. Not suitable for awareness or new categories.
Decision Tree
Ask yourself:
-
Are you optimizing for reach and learning? → Start with Meta (biggest audience, best targeting).
-
Do you want hands-off, algorithmic optimization? → Start with Google App Campaigns.
-
Is your target audience Gen Z and is your app trendy? → Start with TikTok.
-
Do users already search for your app or competitors? → Start with Apple Ads.
Our recommendation for 90% of first-time founders: Meta or Google. Both have strong learning curves and moderate costs.
Want to see how 30-day paid UA plan for subscription apps works with your data?
Get hands-on with Airbridge and see real results.
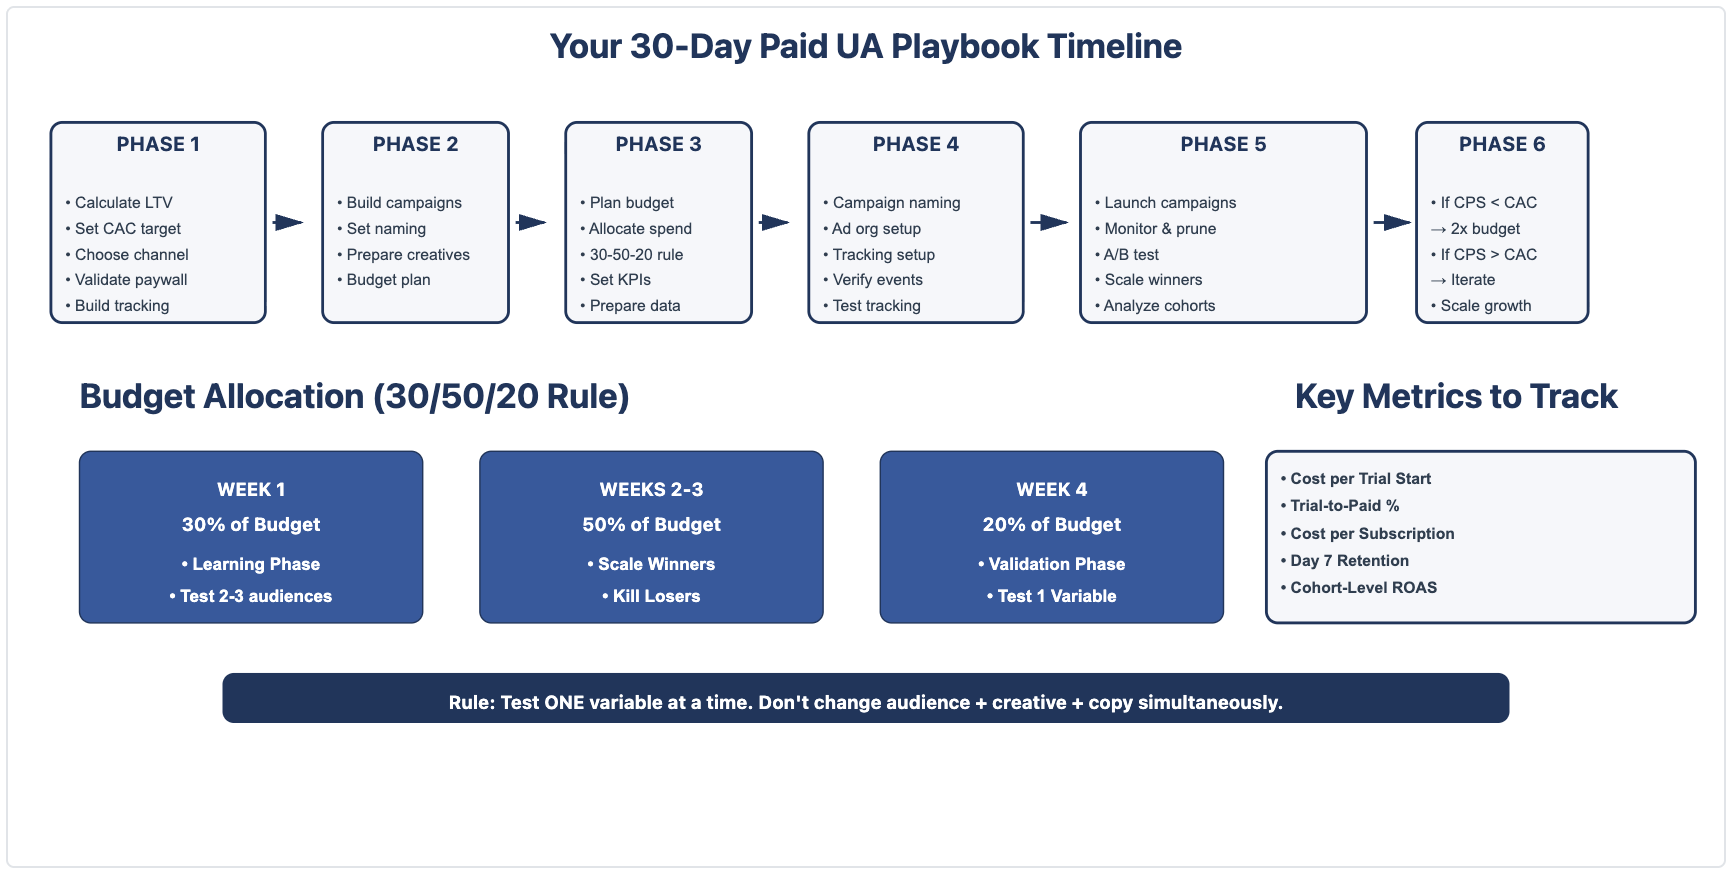
Try It Free →Phase 3: Your First 30 Days: The 30-50-20 Budget Blueprint (Days 7–9)
Don't spend your entire budget in Week 1. Structure it like a scientific experiment: form a hypothesis, test, measure, refine.
Here's a practical starting framework:
Budget Structure for a $30K Plan
| Week | Goal | Budget | Daily Spend | Purpose |
|---|---|---|---|---|
| Week 1 | Learn | $9,000 (30%) | $1,286 | Test 2–3 audience segments, 3–5 creatives |
| Week 2–3 | Scale | $15,000 (50%) | $1,071/day | Identify winners, increase spend on top performers |
| Week 4 | Validate | $6,000 (20%) | $857/day | Hold winners at scale, test one new variable |
For a $10K plan:
-
Week 1: $3,000
-
Week 2–3: $5,000
-
Week 4: $2,000
For a $50K plan:
-
Week 1: $15,000
-
Week 2–3: $25,000
-
Week 4: $10,000
The key principle: Scale winners by 20–30% per week; kill losers immediately.
Don't say, "Let me wait until Week 3 to decide." By Day 4–5 of Week 1, you'll see which audience/creative combinations are driving trials and subscriptions. Double down on those. Kill the bottom 2–3 performers.
Phase 4: Don't Get Lost in the Data: Track What Matters (Days 9–11)
If you don't organize your campaigns now, you'll spend Week 3–4 drowning in data you can't interpret.
Naming Template
Use this structure:
{Channel}_{Product/Offer}_{Audience}_{Creative_Type}_{Date}
Example:
-
META_Trial30d_FitnessEnthusiasts_Video_Jan15 -
GOOGLE_Premium_YogaInterest_Static_Jan15 -
TIKTOK_Freemium_Age1824_UGC_Jan15
Benefits:
-
Automated reporting becomes possible
-
When you look back in Week 4, you instantly see which audiences/creatives worked
-
Cross-channel analysis becomes trivial
Ad Group Organization
Within each campaign, organize by variable you want to test:
Example Meta campaign structure:
-
Campaign:
META_Trial30d_General_Jan15-
Ad Set 1: Audience = Fitness Enthusiasts (age 25–40)
-
Ad Set 2: Audience = Wellness Curious (lookalike of free trial starters)
-
Ad Set 3: Audience = Health App Users
-
Each Ad Set has 2–3 creatives (video, static variant A, static variant B)
-
This structure lets you measure: "Fitness Enthusiasts converted best. Wellness Curious had highest CPI. Let's double Fitness and pause Wellness in Week 2."
Tracking Setup
Connect your app to a consolidated attribution tool and RevenueCat S2S events before Week 1 launches.
Why? Because ad networks report installs, but your revenue dashboard (RevenueCat, Adapty) reports subscriptions. They'll never match perfectly. Establish one source of truth using your attribution tool, which consolidates data from Meta, Google, Apple Search Ads, TikTok, and your subscription platform.
Minimum tracking setup:
-
Mobile app → RevenueCat for subscription events
-
Mobile app → Your attribution tool for cross-channel attribution
-
Verify that "trial start" and "subscription" events fire correctly before launching ads
Phase 5: From Week 1 Launch to Day 30 Victory: Your Action Plan (Days 11–30)
| Timeline | Action | Key Metric |
|---|---|---|
| Days 11–13: Launch | Set campaigns live. Monitor 24–48hrs of data. | Cost per Trial Start |
| Days 14–16: Prune | Kill bottom 2–3 performers. Increase winners by 20%. | Trial-to-Paid %, Audience quality |
| Days 17–24: Test | A/B test one variable (audience, creative, or copy). Test 3–5 creatives only; 500+ installs per creative before deciding. | Cost per Subscription (CPS) |
| Days 25–29: Scale | Double spend on winners. Expect slight cost-per-trial rise as audience saturates. This is normal. | CPS vs. CAC budget |
| Day 30: Analyze | Compare cohorts. Identify winning audience/channel combo. Go/No-Go: Scale (if CPS < CAC budget) or pivot (if CPS > CAC or trial-to-paid < 30%). | Cohort-level metrics |
Critical rule: Test one variable at a time. If you change audience, creative, and copy simultaneously, you won't know what drove the improvement.
Measuring Your Results (Day 30)
Pull cohort-level data, not actuals. A cohort is: "All users who installed Jan 15–21 from Meta, Fitness Enthusiast audience."
For this cohort, track:
-
Install-to-trial %
-
Trial-to-paid %
-
Cost per Subscription
-
Day 7 retention
Go/No-Go decision:
-
Go (Scale): CPS < CAC budget, trial-to-paid > 35%, clear winner identified.
-
No-Go (Pivot): CPS > CAC budget, trial-to-paid < 30%, or no clear winner. Diagnose and adjust one variable for Month 2.
Common Mistakes & How to Avoid Them
Mistake 1: Spreading budget across all channels. Meta + Google + TikTok = $2.5K per channel. Not enough data to optimize anything. Fix: Spend 80% on one channel, 20% on learning.
Mistake 2: Tracking installs instead of subscriptions. You got 1,000 installs for $3K (nice $3 CPI), but only 2% converted to paid. Your real cost per subscriber is $150. Fix: Calculate Cost per Subscription (CPS) from Day 1, not CPI.
Mistake 3: No measurement framework. Facebook reports 300 installs. RevenueCat reports 80 trials. Your analytics say something else. Which is true? Fix: Pick one source of truth (RevenueCat cohorts or Airbridge attribution) and stick with it.
Scale Without Losing Visibility: Automate Your Measurement
As you scale beyond 30 days, manually calculating cohort metrics becomes impossible. Consolidated attribution platforms like Airbridge eliminate manual reporting and catch scaling problems in real-time.
Airbridge connects Meta, Google, Apple Search Ads, TikTok, and RevenueCat in one dashboard. You see cohort-level Cost per Subscription, ROAS, and retention instantly. That saves 5+ hours of analysis per week.

Ready to transform your mobile growth?
Learn how Airbridge helps leading brands measure and optimize every touchpoint.