How to Reduce Wasted App Ad Spend Without Losing Subscription Volume
You're spending $30,000 a month on Meta and Google ads. Installs are coming in. Trials are starting. But subscription revenue isn't moving fast enough, and you have no clear picture of which campaigns are responsible for the users who actually subscribe.
That uncertainty is not a targeting problem. It is a measurement problem. Three forces drive most waste: wrong optimization goals, fatigued creatives, and channels that convert installs but not subscribers. The result is always the same: more spend, same revenue, growing frustration.
Key Takeaways
-
Optimizing for installs is optimizing for waste. Cost per install (CPI) is a vanity metric for subscription apps. The cost per paying user (CPPU) runs 4-5x higher than CPI, meaning your real acquisition cost is far above what your ad platform reports. (RevenueCat State of Subscription Apps 2025)
-
The gap between median and top performers is enormous. Across 75,000+ apps, the median D35 subscription conversion-rate" class="glossary-link" title="Conversion Rate">conversion rate is 1.9%, but top-performing apps (P90) reach 8.5%. A 4x gap driven by optimization decisions, not luck. (RevenueCat State of Subscription Apps 2025)
-
High trial volume can mask low quality. The apps with the highest install-to-trial rates often have the lowest trial-to-paid conversion. Volume is not a signal of intent.
-
Reallocating beats cutting. Splitting budget across 70% proven, 20% optimization, and 10% exploration holds subscription volume while removing waste from the bottom.
3 Reasons Your Subscription App Ad Spend Gets Wasted
Most wasted budget in subscription app campaigns traces to one of three structural problems. Identifying which applies to your campaigns is the starting point.
1. Optimizing for App Installs Instead of Subscriptions
The default conversion event for most app campaigns is the install. Ad platforms give you exactly what you optimize for, with no regard for whether those users ever subscribe. Across subscription app categories, CPPU (cost per paying user) runs 4-5x higher than CPI (RevenueCat State of Subscription Apps 2025). If your Meta CPI is $5 on iOS, your realistic cost per subscriber is closer to $20-30 before accounting for trial drop-off.
When your optimization event is an install, the algorithm finds people who install apps, not people who subscribe. Shifting to trial starts or subscription starts initially reduces volume, but it changes the quality of the audience the platform targets. That distinction is where subscription apps start finding actual leverage.
2. Spreading Budget Across Channels Without Channel-Level CPS Data
"I want to reduce waste, but I'm worried the volume will drop along with it."
This objection stems from a single root cause: no clear picture of which campaigns are profitable at the subscription level.
Without knowing your cost per subscription (CPS) by channel, by audience, and by creative, you cannot cut with precision. You can only cut blindly, which does hurt volume. Running four or five channels without channel-level CPS doesn't run efficient tests — it amplifies losses.
3. Creative Fatigue Drains Budget Even When CPI Looks Fine
Creative fatigue is one of the quieter causes of wasted spend. On TikTok, creative refresh is typically needed weekly as an operational rule of thumb, because audiences cycle through ad content quickly. On Meta, campaigns running against narrow audiences often see frequency spikes that push CPMs up and pull CTRs down within the first two weeks.
When creative fatigues, the algorithm does not pause. It continues spending your budget to reach increasingly poor-fit audiences in order to hit delivery targets. CPI may stay stable or even drop as the algorithm reaches lower-competition audiences. But trial starts and subscription conversions fall.
3 Key Metrics to Identify Wasted App Ad Spend
1. Cost per Subscription (CPS): Your True App Acquisition Metric
CPS is your actual acquisition cost. Your ad platform reports CPI because that is what it can measure directly, without additional setup. But CPI tells you nothing about subscription intent or downstream revenue.
The calculation:
CPS = Total channel spend / Number of new subscribers from that channel
Run this separately for each channel, audience segment, and creative. A Meta campaign generating 200 subscribers at $22 CPS against an annual plan LTV of $40 is profitable. The same CPS against a monthly plan with 17.5% 12-month retention is not, because those subscribers will churn before LTV recovers the acquisition cost (RevenueCat State of Subscription Apps 2025).
Context for calibration: CPPU across subscription categories runs roughly 4-5x CPI (RevenueCat State of Subscription Apps 2025). If your iOS Health and Fitness CPI is around $5.78 (RevenueCat State of Subscription Apps 2025), expect a realistic CPS in the $23-29 range before factoring in your specific trial conversion rate.
2. Trial-to-Paid Conversion Rate by Ad Channel
The median trial-to-paid conversion across 75,000+ subscription apps is 34.8% (RevenueCat State of Subscription Apps 2025). By category: Travel apps convert at 48.7% median, Health and Fitness at 39.9%, Gaming at 19%, and Utilities around 25%. The channel breakdown within your own campaigns is more actionable than any industry benchmark.
Consider this comparison: a campaign generating 500 trials at 20% conversion produces 100 subscribers. A smaller campaign generating 200 trials at 45% conversion produces 90 subscribers, nearly the same output at 60% of the trial volume. That second campaign carries higher purchase intent and will scale more efficiently.
Trial length is a variable that data consistently shows matters independently of channel performance. Apps offering 17-32 day trials convert at a median of 45.7%, compared to 26.8% for shorter trials (RevenueCat State of Subscription Apps 2025). If you're seeing low trial-to-paid rates across channels, trial length and post-trial onboarding may be the culprit before channel targeting is.
3. Revenue per Install (RPI): The Metric That Exposes Ad Channel Waste
RPI normalizes across CPI differences to show actual downstream revenue per install. When you compare RPI by channel alongside CPI by channel, waste becomes visible.
The median D60 RPI across subscription apps is $0.31 (RevenueCat State of Subscription Apps 2025). Health and Fitness apps median at $0.63. North America installs median at $0.57 D60, while installs from India and Southeast Asia run around $0.10. A lower CPI from a geo expansion may still produce worse RPI than a higher-cost North America campaign. The net result is worse subscription revenue per dollar spent.
Top-decile apps (P90) push the D35 download-to-paid rate to 8.5%, a 4x gap above the 1.9% median driven by optimization decisions, not product category.
| Metric | Median (All Apps) | Q3 Threshold (Top 25%) |
|---|---|---|
| Trial Start Rate | 6.2% | 12.4%+ |
| Trial to Paid | 34.8% | 51.5%+ |
| D35 Download to Paid | 1.9% | 4.3%+ |
| D60 Revenue per Install | $0.31 | $0.81+ |
Data: RevenueCat State of Subscription Apps 2025, analysis of 75,000+ subscription apps.
Want to see how Reduce app ad spend waste works with your data?
Get hands-on with Airbridge and see real results.
Try It Free →How to Audit and Eliminate Your Worst-Performing App Ad Spend
Waste hides in three layers: channel, audience, creative. Audit in that order.
1. Run a Trial Funnel Audit Across Your Ad Channels
Pull 30-60 days of data segmented by channel. For each channel, calculate install volume, trial start rate, trial-to-paid conversion, and CPS. Then lay them side by side:
| Channel | CPI | Trial Start Rate | Trial to Paid | CPS | Decision |
|---|---|---|---|---|---|
| Meta Advantage+ | $5.20 | 8.4% | 31% | $19.90 | Scale |
| Google UAC | $4.10 | 6.1% | 21% | $31.90 | Test or pause |
| TikTok | $2.80 | 4.9% | 18% | $31.70 | Refresh creative |
| Apple Search Ads | $8.50 | 9.2% | 44% | $20.90 | Scale |
Example figures for illustration. Run the same audit against your own channel data.
The pattern is instructive: TikTok and Google UAC have nearly identical CPS ($31.70 vs $31.90), but the prescriptions differ. Google UAC's weak trial-to-paid rate (21%) signals a channel-level problem — the audience quality is off. TikTok's similar CPS comes from creative fatigue: refresh the assets before cutting the spend.
The industry-level confirmation: gaming apps have the highest install-to-trial rate (12.2%) of any subscription category, yet the lowest trial-to-paid conversion (19%) (AppsFlyer State of Subscriptions for Marketers 2026). High trial volume can conceal low-quality acquisition.
2. Segment Ad Audiences by Subscription Quality, Not Volume
Within each channel, look at audience-level breakdowns. Common waste drivers at the segment level:
Age segments with high trial volume but low conversion appear frequently. Younger audiences often trial apps freely but convert at lower rates due to lower spending capacity or intent. If Meta is spending heavily on an 18-24 segment that underperforms your 25-35 cohort by 15 percentage points on trial-to-paid, that is a segmentation correction, not a channel cut.
Geographic concentration into lower-CPI regions can look efficient on the install cost side while generating D60 RPI of $0.10 versus $0.57 from your North America base (RevenueCat State of Subscription Apps 2025). The aggregate CPS will quietly degrade without a visible signal in install or trial volume numbers.
Lookalike audiences built from install events, rather than subscription or annual subscriber events, perpetuate the same optimization problem at the audience layer. Rebuilding lookalikes from your paying subscriber list changes the seed audience the algorithm expands from and tends to produce higher downstream conversion even at a higher CPI.
3. Creative Fatigue Drains Budget Even When CPI Looks Fine
Review frequency, CTR trend, and CPM trend together over 14-21 days per active creative. These are operational thresholds, not platform-published rules: frequency above 3.0 within a two-week window, CTR declining more than 20% week-over-week, or CPM rising more than 25% without a corresponding conversion improvement typically signals a fatigued creative.
When these signals appear, the creative is fatigued, not the campaign structure or the audience. Pausing the creative rather than the campaign preserves the algorithm's learned audience data. Replacing the creative refreshes delivery without resetting the learning phase.
How to Cut App Ad Spend Without Losing Subscription Volume
With CPS data by channel, the reallocation is mechanical.
1. Apply the 70/20/10 Budget Reallocation Framework
A practical reallocation framework, sometimes called 70/20/10, splits active budget into three buckets:
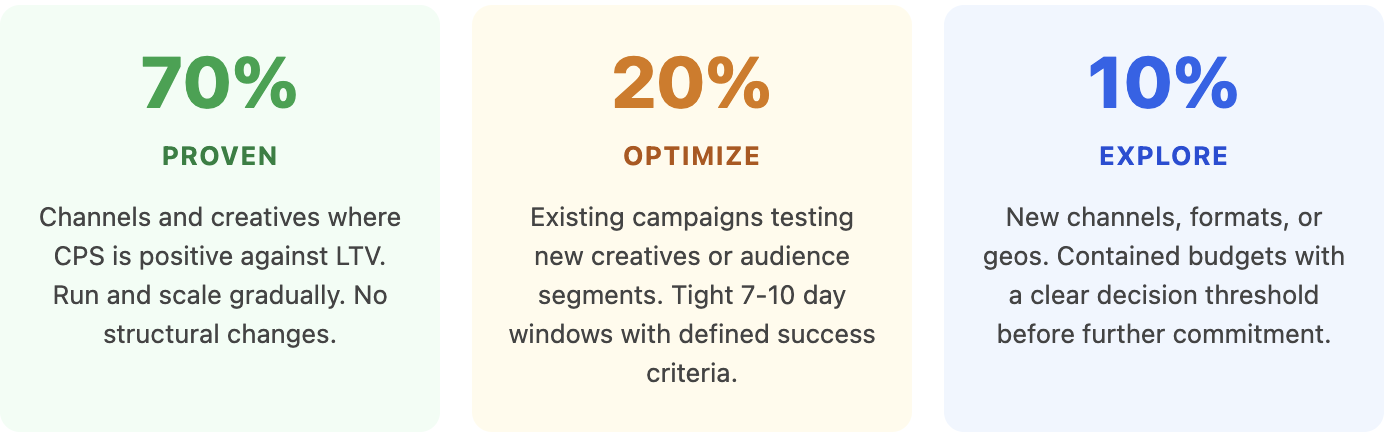
When you cut a losing channel, that budget moves to the 70% bucket first.
Watch out: when trimming a losing campaign, pause the creative first, not the whole campaign. Pausing the campaign resets the algorithm's learned audience data and forces a full rebuild from scratch.
2. Scale Winning Campaigns at 20-30% Budget Increments
One of the most consistent budget mistakes is aggressive scaling when a campaign shows strong results. A campaign performing at $100/day gets jumped to $500/day, the algorithm re-enters a learning phase, and efficiency degrades for 7-10 days. By the time performance recovers, the cohort data has been distorted.
The standard agency convention: increase budgets on winning campaigns by 20-30% at a time, and wait at least five to seven days before the next increment. This preserves the audience signal the algorithm has built while gradually expanding reach.> Watch out: don't cut during the learning phase. Meta's learning phase exits at 50 conversions per week per ad set (Meta Business Help Center). Other platforms have similar thresholds. If CPS is not improving after three weeks at that rate, then cut. Not before.
3. Feed Ad Platforms Subscription Events, Not Just Install Signals
The highest-leverage change for most subscription apps: stop sending installs to the algorithm, start sending subscription events.
When Meta or Google receives subscription start events, it recalibrates targeting toward users with higher purchase intent. The transition temporarily reduces trial volume. But the users the algorithm finds after recalibrating convert at higher rates, which reduces CPS even as CPI may rise.
A practical middle step: keep trial starts as the primary optimization event but simultaneously send subscription start events and subscription revenue data back to the platform as value signals. Meta Conversions API, Google Enhanced Conversions, and TikTok Events API all support this. This builds a richer audience model without fully switching optimization events and disrupting delivery volume.
Stop Wasting App Ad Spend: Measure First, Then Cut
The cut-without-shrink play: measure CPS, trial-to-paid, and RPI by channel. Reallocate on a 70/20/10 split. Feed subscription events back to your ad platforms. Volume doesn't drop. It shifts toward users who actually pay.

Ready to transform your mobile growth?
Learn how Airbridge helps leading brands measure and optimize every touchpoint.