How to Test App Ad Creatives Without Burning Budget

You're running paid UA on Meta or TikTok, and your app creative library is growing. But after weeks of testing, you still can't answer the question that actually matters: which creative is making you money, and which one is wasting your budget?
Most teams run ad creative "tests" without a real system. They change the hook, the copy, and the format all at once, then spend days trying to decode why one version outperformed another. That's not testing. That's guessing with extra steps. Learning how to test app ad creatives for subscription apps the right way means building a repeatable system that produces a clear, learnable answer every single time you run it.
Key Takeaways
-
Creative is the primary performance variable. On Meta and TikTok, the app creative determines whether a user stops, installs, and ultimately subscribes. Algorithms optimize delivery. Creative determines fit.
-
Test one variable at a time. Changing the hook, format, and copy simultaneously makes results unlearnable. One change, one test, one insight.
-
Use win rate to evaluate results. A structured test should produce at least a 5% win rate. Below that, the problem is methodology, not creative quality.
-
False positives are common. A creative that performs well at low spend often collapses when you scale it. Validate every winner in a standalone ad group before promoting it to BAU. Low-spend performance rarely predicts scale performance.
-
CTR is an incomplete signal for subscription apps. Install-to-subscription rate reveals which creatives attract users who actually pay, not just users who install.
Why Most Creative Tests Don't Teach You Anything
App creative testing looks simple: make two ads, run them, pick the winner. In practice, most teams end up with data that can't support a decision.
1. Too Many Variables at Once
You change the hook, the background, and the copy at the same time. When one version outperforms the other, you have no idea what caused it.
This problem is most acute in the first few seconds. Most users decide whether to engage with an ad after just one second. By the three-second mark, half the audience has already scrolled past. Testing the hook separately from the copy, and the copy separately from the format, is the only way to know which element is actually doing the work — and the only way to reproduce that performance across future creatives.
Structured creative testing means isolating one element per iteration:
-
Hook vs. hook: same format, different opening 3 seconds
-
Angle vs. angle: problem-framing vs. transformation-framing, same format
-
Format vs. format: UGC-style vs. motion graphic, same concept
Per Law 44 of the 48 Laws of Subscription App Success: calculate your sample size in advance, test one variable at a time, and run tests to completion before deciding. Changing variables mid-flight wastes money and erases whatever learning was possible.
2. Optimizing for the Wrong Metric
If your Meta campaign optimizes for trial starts, the algorithm delivers your ad to users who start trials, including users who never subscribe.
The gap between median and excellent subscription app performance is almost entirely about traffic quality. Among 75,000+ subscription apps analyzed, the median trial-to-paid conversion-rate" class="glossary-link" title="Conversion Rate">conversion rate is 34.8%. The upper quartile reaches 51.5%. That gap is not product quality alone. It is the quality of users each creative attracts.
The same principle applies at the creative level. A creative with high trial volume but low subscription conversion is producing the wrong traffic. One with fewer trials but higher subscription rates is the actual winner — visible only if you measure at the right funnel step. Adapty's analysis of 16,000+ apps found that experiments improving conversion only 28% of the time still lift LTV (lifetime value) by 46%. Fewer trials from higher-intent users produces better revenue per cohort than more trials from users who churn.
Build Your Creative Testing System
A rigorous testing system starts with production. Before you can identify winners, you need enough creatives to test meaningfully. StartApp School's paid UA curriculum sets a clear production benchmark: aim for approximately 100 different creatives as your initial testing library. That number reflects how many concepts you need to cycle through before conversion patterns become statistically meaningful and before the algorithm has enough material to surface genuine signal.
The priority metric table below is ordered from most to least diagnostic for subscription apps:
| Metric | What It Reveals | Priority |
|---|---|---|
| Install-to-subscription rate | Which creatives attract users who pay | High |
| CAC / Cost-per-acquisition | Whether unit economics are sustainable | High |
| Win rate (% of tests producing a winner) | Whether your testing methodology is working | High |
| Hook rate (3-sec view rate) | Whether the first seconds stop the scroll | Medium |
| Hold rate | Whether users stay engaged past the hook | Medium |
| CTR / IPM | Volume signal, useful but incomplete alone | Low |
Set your baseline from your current best-performing creative. Every new creative is measured against that baseline, not against zero, and not against other untested concepts.
1. Budget, Volume, and What to Expect
Most creative testing guides cite volume and budget figures without sourcing them. The figures below are drawn from StartApp School's paid UA curriculum:
Budget allocation. Allocate 5–10% of your total UA budget specifically for creative testing. Treat this as a learning cost, not a performance budget. Do not hold test campaigns to your standard CAC targets.
Minimum campaign budget. Keep your test campaign budget at least 10x your target CPA. Below this threshold, the algorithm cannot exit the learning phase and results are statistically meaningless.
Ad group size. Run 5–6 creatives minimum per ad group, up to 10. Meta's algorithm prioritizes only 1–2 creatives for the majority of spend. The remaining creatives must be present for the algorithm to make that determination. Do not over-split.
Rotation timing. By week three of any test campaign, refresh your creative lineup actively. Do not wait for explicit performance decline. Creative fatigue develops before it appears in your top-line metrics.
| Daily Budget | Test Structure | Ad Group Size |
|---|---|---|
| Under $500/day | 1 campaign, 1 ad group | 5–10 creatives total |
| $500–$5,000/day | Dedicated test groups + BAU groups | 5–10 per group |
| Over $5,000/day | Multi-campaign, multi-GEO | Isolate false positives per GEO |
At under $500/day, focus on one platform (iOS, US) and one optimization event. Splitting ad groups at this budget level fragments data below what the algorithm can learn from.
At $500–$5,000/day, you can run dedicated test ad groups alongside BAU (Business as Usual) groups, testing new creatives without putting your proven performers at risk.
Want to see how App ad creatives works with your data?
Get hands-on with Airbridge and see real results.
Try It Free →Read Results Without Getting Fooled
Two patterns trip up nearly every team running these tests for the first time.
1. The Win Rate Signal
On Meta and TikTok, the algorithm concentrates spend on whichever creatives in your ad group generate the most optimization events. A creative that earns spend consistently is proving it converts the algorithm's target audience. A creative that receives minimal spend, despite being live in the same ad group, is being deprioritized based on early performance signals.
The minimum threshold for a credible winner: a 5% win rate across your test cohort. Below that, review your testing methodology before drawing conclusions from any individual result.
Before scaling a winner, look below the surface. A creative that shows no overall lift might conceal strong lift for a specific segment: users aged 25–34, iOS vs. Android, or users from a specific acquisition source. Segment your results by device, geography, and onboarding behavior before declaring a creative a loser. Some of the strongest performers in a test cohort are hidden inside aggregate results that look mediocre at the account level.
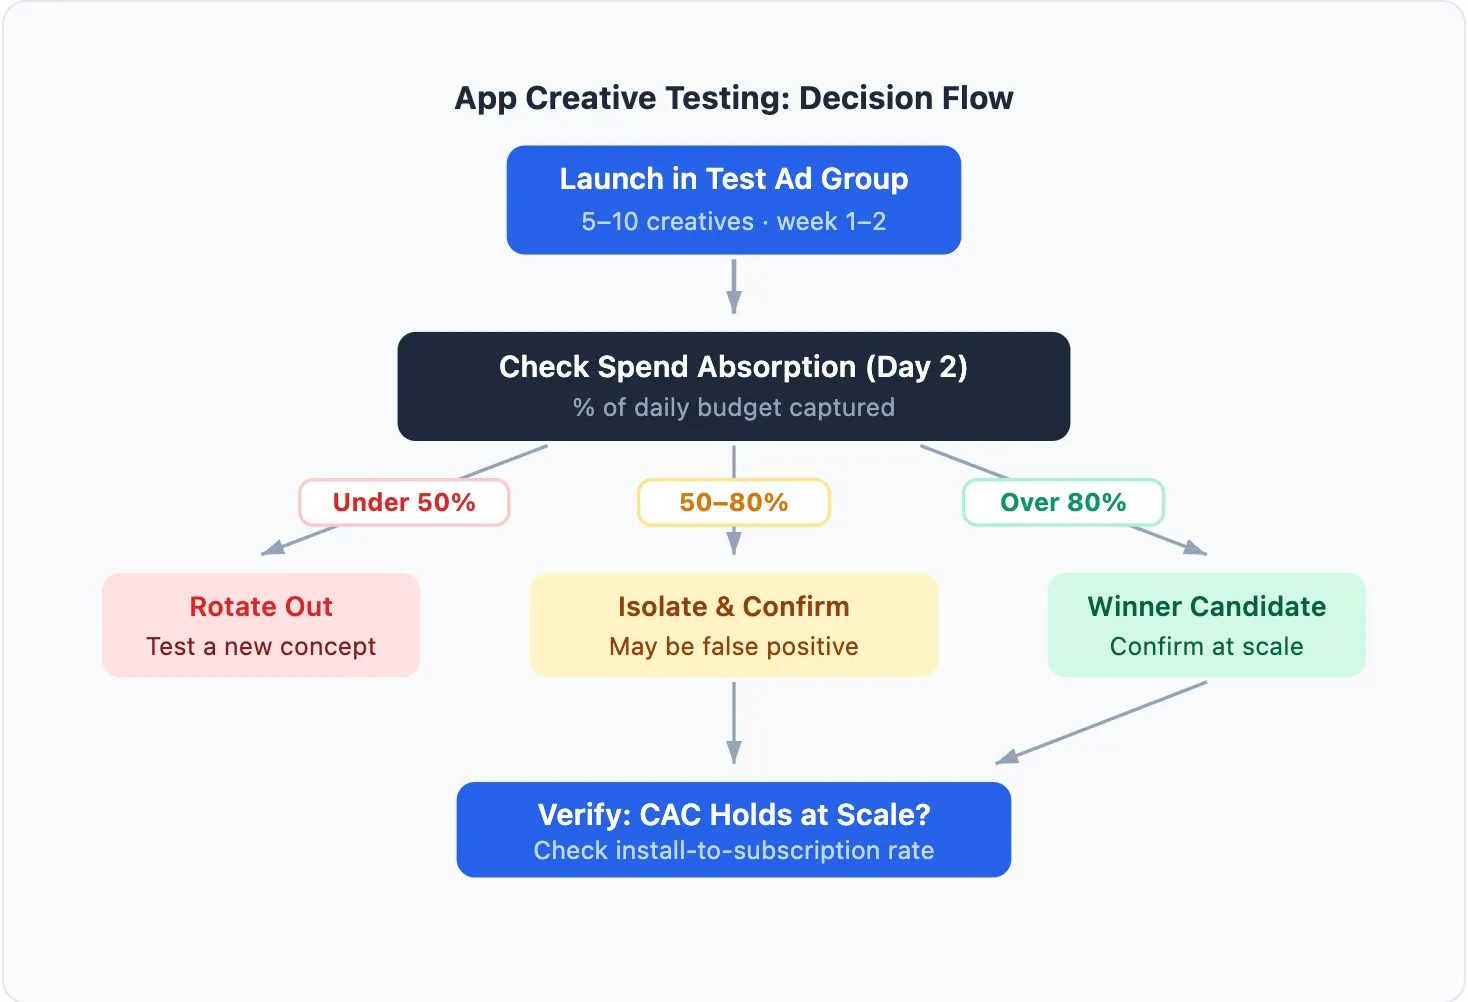
2. Confirming Real Winners vs. False Positives
A false positive is a creative that performs well at low spend, then collapses when you scale it. The algorithm initially found an easy-to-convert micro-segment. That segment is small. When you force more budget onto the creative, performance drops because the algorithm has exhausted the available audience.
The fix: move the candidate creative into a dedicated ad group with a meaningful daily budget. Give it 3–5 days at real spend. If CAC holds, it is a genuine winner. If it collapses, you have avoided the cost of scaling a false positive into BAU.
Why Creatives Convert Differently at the Subscription Level
The install-to-trial rate of a creative tells you whether it attracts curious users. The install-to-subscription rate tells you whether it attracts committed ones. These are not the same thing, and the gap between them is often explained by a single factor: creative promise vs. in-app experience alignment.
Every creative sets a motivation peak — the specific promise that makes a user install. If the paywall appears before the user experiences that promise, they hesitate. If it appears after motivation fades, they leave. StartApp School's Paywall Optimization curriculum is direct on this: timing matters more than copywriting. Contextual paywalls, those appearing after user effort or partial results, outperform paywalls shown immediately after install, not because the paywall design is better, but because the user has already experienced part of what the creative promised.
A fitness app creative that promises "lose 5kg in a month" creates a specific expectation. If the user hits a paywall on the first screen, before experiencing any of the app's capability, the subscription feels premature. The same creative paired with a paywall appearing after the first workout assessment converts at a meaningfully higher rate. The creative did not change. The alignment between promise and paywall timing changed.
This is why two creatives with identical CTR and trial-start rates can produce different subscription outcomes. The creative that attracts users whose motivation peaks earlier in the onboarding sequence converts better at the subscription step, independent of how the paywall looks. Testing creatives in isolation, without accounting for the paywall moment they feed into, produces incomplete results.
For a category-level example of how this plays out in practice, see Creative Testing for Fitness Apps: Install Metrics vs. Subscription Revenue.
Close the Loop at the Subscription Level
Creative testing based on CTR or install-to-trial gives you half the picture. The metric that closes the loop is install-to-subscription rate by creative: which ad concept is actually driving paying users, not just curious installers.
To see this, you need your ad spend data connected to subscription events (Start Trial, Subscribe, Renew) in a single view. That connection also surfaces LTV per creative, ROAS at the subscriber level rather than the install level, and retention signals by acquisition source. These are the signals that determine which creatives generate revenue and which generate churn.
Teams that build this measurement infrastructure compound their advantage over time. Among apps tracked across 16,000+ products, those that run structured experiments consistently, with an average of 14.7 experiment runs among active testers, achieve substantially higher revenue than those that test ad hoc. The mechanism is straightforward: every structured test produces one learnable insight, and those insights accumulate.
Connecting self-attributing network data (Meta, Google, Apple Search Ads, TikTok) to your subscription funnel, across the right attribution window, is what makes this possible. If you want to see which creatives are actually driving paying subscribers, Airbridge Core Plan shows install-to-subscription performance at the creative level across those four channels. Start free with 15K installs.
Further reading: See how subscription-level data changes creative decisions in practice: Creative Testing for Fitness Apps: Install Metrics vs. Subscription Revenue →


Ready to transform your mobile growth?
Learn how Airbridge helps leading brands measure and optimize every touchpoint.