Creative Testing for Fitness Apps: Why the Winner by Installs Loses by Revenue
You tested five creatives last week. One of them crushed it: $2.10 CPI, double the installs of the next best performer. You scaled it. You killed the $4.80 CPI creative that barely hit your install threshold.
The $2.10 creative had a 1.5% trial-to-paid conversion-rate" class="glossary-link" title="Conversion Rate">conversion rate. The $4.80 creative had 9%. You just killed your best revenue driver and scaled your worst. This is not a hypothetical. It is the default outcome when fitness app teams rank creative winners by installs, because CPI is the only creative-level metric most tools show them.
Key Takeaways
-
Your lowest-CPI creative is often your lowest-revenue creative. Flashy hooks drive curiosity installs, not committed subscribers.
-
No single tool shows creative-to-subscriber performance. Ad platforms stop at installs. Creative analytics tools do not integrate with MMPs. Most MMP setups lock creative-level data behind premium tiers.
-
Fitness apps are especially vulnerable. Health & Fitness apps have a median trial-to-paid conversion of 39.9% (RevenueCat, 2025), but the variance by creative is where budget gets wasted.
-
The fix: replace CPI with Cost per Subscriber (CPS) as your creative ranking metric and connect creative IDs to subscription events through your MMP.
-
Airbridge Core Plan connects creative performance to subscription revenue with standard events, native RevenueCat/Adapty integration, and creative-level breakdown in the Actuals Report. Start free with 15K attributed installs.
The CPI Trap: Why Your Best Creative by Installs Loses by Revenue
Creative testing is the core of paid UA for fitness apps. Teams test 5-20 creatives per week across Meta, Google, and TikTok, and the winner gets the budget. The problem is how the winner is chosen.
1. CPI Picks the Wrong Winner
Most teams judge creative performance by CPI because it is the fastest metric available. Within 24-48 hours, you can see which creative drives the cheapest installs. But CPI measures the cost of getting someone to download your app, not the cost of getting someone to subscribe.
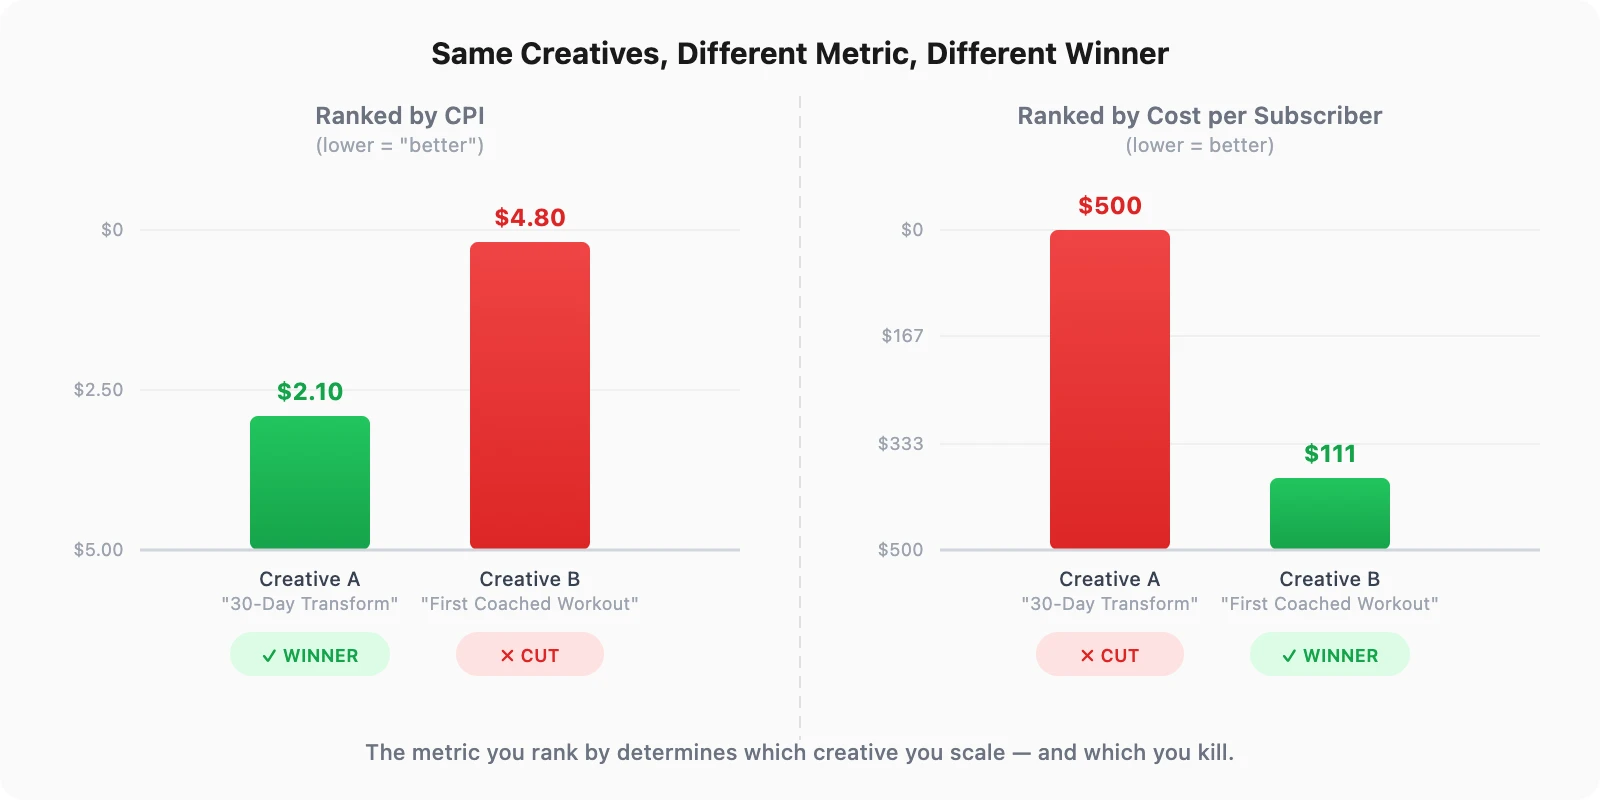
Consider two fitness app creatives running on Meta:
| Creative | CPI | Installs (1K spend) | Trial Starts | Trial-to-Paid | Subscribers | Cost per Subscriber |
|---|---|---|---|---|---|---|
| A: "30-Day Transformation" | $2.10 | 476 | 143 (30%) | 1.5% | 2 | $500 |
| B: "Your First Coached Workout" | $4.80 | 208 | 104 (50%) | 9% | 9 | $111 |
Creative A wins by CPI. Creative B wins by revenue by a factor of 4.5x. If you kill Creative B at the 48-hour CPI check, you never see its subscription performance. The data that matters most arrives after the decision has already been made.
2. Why Fitness Apps Are Especially Vulnerable
The gap between install intent and subscription intent is category-dependent. For a utility app, a user who installs is likely to use it. For a fitness app, a user who installs is often someone who was curious, not someone ready to commit to a $14.99/month workout plan.
RevenueCat's State of Subscription Apps report shows Health & Fitness apps have a median trial-to-paid conversion of 39.9%. But this is the median across all users. The variance by creative is where the real story lives. A transformation before/after creative attracts aspirational browsers. A structured workout preview attracts people who already exercise. Both install the app. Only one type subscribes.
Fitness app creatives that perform best by CPI tend to target the widest emotional trigger, which also attracts the least committed users. This is the CPI trap: optimizing for volume instead of value.
3. No Single Tool Connects Creative to Subscriber
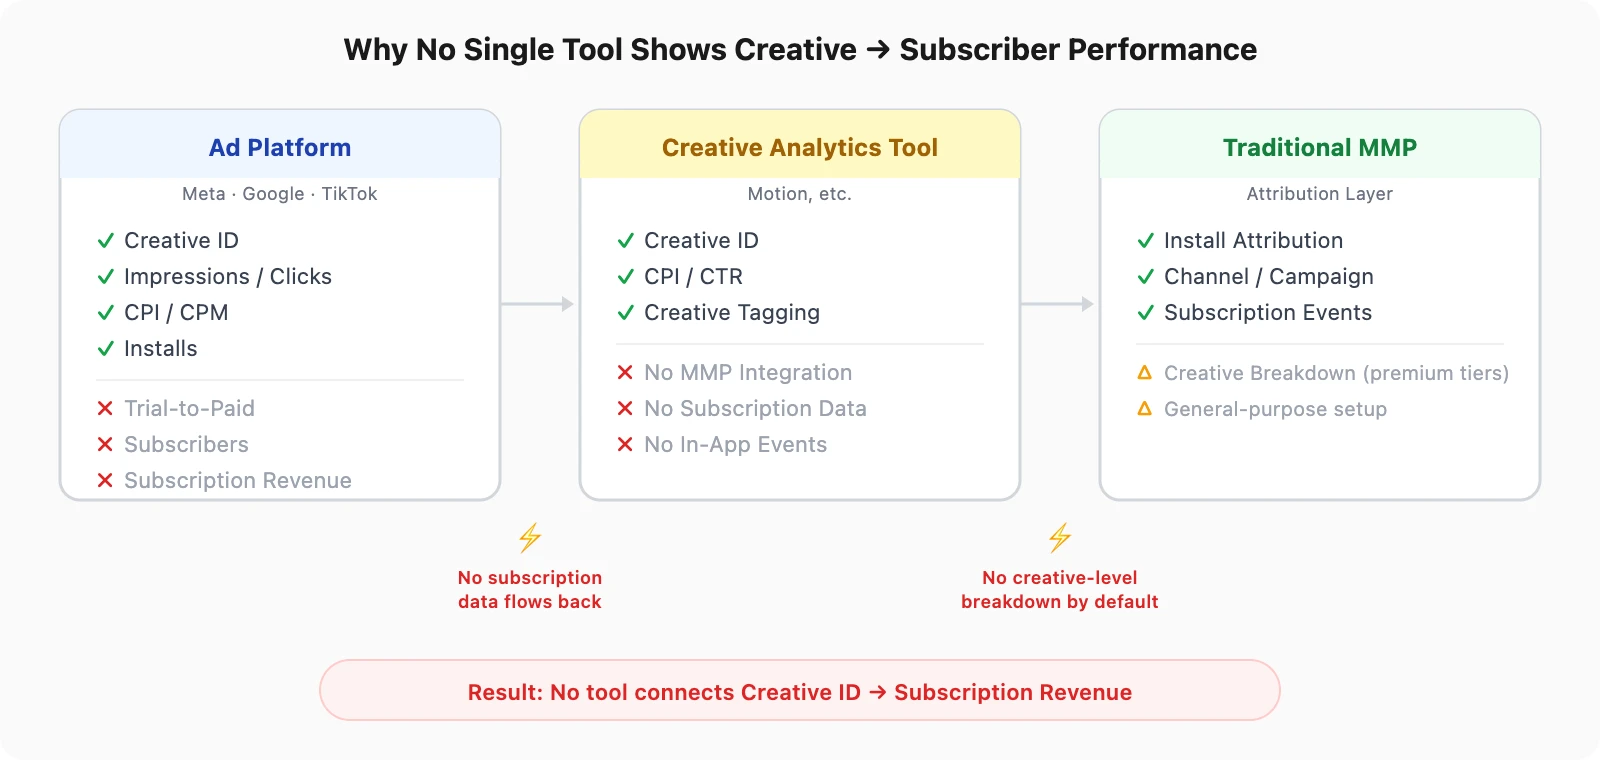
The creative-to-subscriber gap is not a knowledge problem. Most growth marketers know CPI is incomplete. It is a tooling problem. No single tool in the typical fitness app stack connects creative IDs to subscription outcomes. Understanding what an MMP does helps clarify why this gap exists: attribution platforms were built to measure installs, not the revenue events that follow weeks later.
-
Ad platforms (Google, Meta, TikTok, Apple Search Ads) show creative-level CPI, clicks, impressions, but nothing about subscription revenue. The ad platform knows which creative the user saw. It does not know whether that user subscribed, renewed, or churned. Each platform reports in its own silo. Even if you pull creative reports from all four channels, the best you get is CPI by creative. None of them can tell you which creative drove a $14.99/month subscriber versus a user who uninstalled on Day 2.
-
Creative analytics tools like Motion were designed for e-commerce workflows. They pull data from ad platforms and tag creatives by visual element, hook type, or format. But they do not integrate with MMPs, which means they cannot access in-app subscription data. You can see which creative has the best CTR or the lowest CPI. You cannot see which creative produces the highest trial-to-paid rate.
-
Enterprise MMPs have the attribution and the billing data. But creative-level subscription breakdowns are often locked behind premium tiers (e.g., AppsFlyer's ROI360 tier includes Creative Optimization). The data is technically available. It is not accessible at the price point where most subscription apps operate. A fitness app spending $10K-$30K/month on UA often cannot justify a $60K+ annual MMP contract just to unlock creative-level revenue data.
The result is a three-way data silo. The ad platform holds the creative ID. The MMP holds the attribution. The billing platform holds the subscription revenue. Getting all three into the same row of a spreadsheet requires either expensive enterprise tooling or hours of manual data stitching every week. Most teams give up and default to CPI.
Start measuring what matters — for free
Airbridge Core Plan gives growing teams real attribution, deep linking, and audience tools at no cost.
Get Started Free →How to Evaluate Creatives by Subscription Value
1. Replace CPI With CPS and Extend Your Decision Window
Define CPS as your primary creative ranking metric:
-
CPS = Total Creative Spend / Subscribers Attributed to That Creative
-
A $5 CPI creative with 8% trial-to-paid will always beat a $2 CPI creative with 1.5% trial-to-paid on CPS
-
CPI remains useful for filtering (creatives with extremely high CPI may not get enough volume to test), but the winner should be picked by CPS
Extend the decision window from 48 hours to 7-14 days:
-
Day 0-2: Monitor for delivery issues only. Do not make performance judgments.
-
Day 3-7: Check trial start rate by creative. Creatives with high installs but low trial starts are already showing intent-quality issues.
-
Day 7-14: Evaluate CPS. This is the decision point. Creatives that win on CPI but lose on CPS get cut. Creatives with higher CPI but strong CPS get scaled.
-
Day 14+: For creatives still running, check Day-14 retention by creative. This filters for long-term subscriber quality.
The key shift: patience. It prevents killing your best revenue-driving creative based on a metric that does not predict revenue.

Most teams feel pressure to declare winners fast because ad platform budgets auto-optimize toward lower CPI. The discipline to hold creatives through a full 7-14 day evaluation window is what separates teams that scale revenue from teams that scale installs.
There is a practical challenge here: holding budget on a creative with a $4.80 CPI while a $2.10 CPI creative is available feels wrong. The CPI-based instinct says you are wasting money. But if the $4.80 creative produces subscribers at $111 each while the $2.10 creative produces them at $500 each, every day you run the cheaper-CPI creative is a day you are actively losing money. The discomfort of paying more per install is the cost of finding subscribers.
This measurement requires an attribution system that connects creative IDs to subscription events at the channel level.
See which creative actually drives your subscribers. Start free with 15K attributed installs.
2. How Airbridge Core Plan Connects Creative to Subscription Revenue
Airbridge Core Plan is an MMP built for subscription apps that connects ad platform creative IDs to subscription events, closing the gap between creative spend and subscriber value. Core Plan focuses on the four channels that matter most to subscription app growth: Google, Meta, Apple Search Ads, and TikTok (GMAT). Native integrations with all four mean creative IDs flow into attribution automatically.
Core Plan provides subscription-optimized standard events (Start Trial, Subscribe, Unsubscribe, Order Complete, Order Cancel) with native RevenueCat and Adapty integration via S2S. The Actuals Report breaks down these subscription events by creative dimension, so you can see which creative drives trial starts, which drives subscriptions, and which drives cancellations across Google, Meta, Apple Search Ads, and TikTok.
The creative ID flows from the ad platform through attribution, and the subscription event flows from the billing platform through S2S. Both meet in the same report. No manual CSV exports. No weekly data stitching. The connection is automatic and continuous.
| Capability | Enterprise MMP | Airbridge Core Plan |
|---|---|---|
| Creative-level subscription data | Available (e.g., AppsFlyer ROI360 tier includes Creative Optimization) | Included in base with creative dimension built in |
| Billing platform integration | Native integrations available (RevenueCat, Adapty supported) | Native RevenueCat/Adapty via S2S |
| Creative-to-CPS visibility | Available (premium tiers for full cost + revenue data) | Actuals Report with creative breakdown |
| Event configuration | Predefined + custom events | 25 subscription-optimized standard events |
| Minimum contract | Annual, $10K+ | Pay-as-you-go, $0.05/install |
| Free tier | Limited or none | 15K free attributed installs, all features included |
The Problem Is Not Your Creatives. It Is How You Measure Them.
For fitness apps, the creative that wins by installs and the creative that wins by subscriptions are rarely the same. If your creative testing loop ranks winners by CPI, you are systematically scaling the wrong creatives and killing the right ones every week.
Think about what that means over a quarter. You test 10-15 new creatives per month. Each time, CPI picks the winner. Each time, the real revenue driver gets cut at the 48-hour mark. After three months, you have scaled dozens of high-install, low-subscriber creatives and killed dozens of low-install, high-subscriber ones. Your CPI looks great. Your subscriber acquisition cost has quietly doubled. By the time the revenue numbers catch up to the creative decisions, the damage is already compounded across hundreds of thousands of dollars in ad spend.
The fix is not more creatives or a bigger budget. It is not a better hook or a new ad format. It is connecting creative performance to the metric that actually matters: subscription revenue. Every week you delay making this connection is another week of scaling the wrong creative and killing the right one.


Ready to see what Core Plan can do?
Free attribution, deep linking, and audience tools — built for teams that are ready to grow.