App Pricing Experiments: How to Test What Users Will Pay
You set a price. Maybe you looked at a few competitors, settled on something in the range, and shipped. But app pricing is not a one-time decision. It is a hypothesis you test. And 34.6% of subscription cancellations are cost-related (RevenueCat State of Subscription Apps 2025), the second most common churn reason right after not using the app enough. Pricing doesn't just affect who signs up. It affects whether they stay.
This guide walks through how to test willingness to pay for a subscription app at every stage of growth, from before your first install to after you've hit consistent monthly volume. There are three practical methods, and the right one depends on where you are right now.
Willingness to pay is the maximum price a user will accept before declining a subscription offer, and it's measurable before you commit to a price.
Key Takeaways
-
Higher prices often convert better, not worse. Apps in the high-price tier show stronger Day 35 conversion because they filter for more committed users, not because they're better built.
-
App pricing experiments deliver outsized returns. Teams that run structured tests achieve up to 40x more revenue than teams who set a price and never revisit it.
-
There are three methods to test willingness to pay: survey research before launch, behavioral signals with early users, and live A/B testing at scale.
-
Conversion rate is the wrong primary metric. ARPU (average revenue per user) balances conversion, price, and plan mix into a single number that actually predicts revenue.
-
Your first price is a hypothesis. The goal of pricing experiments is to keep learning, not to find one number and stop.
Your Launch Price Is a Hypothesis
Most founders skip app pricing experiments entirely at launch. They benchmark competitors, pick something near the middle, and move on. The problem is that benchmarking tells you what others are charging, not what your specific users will pay for your specific value. Those are different questions.
Here's the counterintuitive reality: higher-priced apps often convert better, not worse. Across more than 75,000 subscription apps analyzed, high-priced apps report a Day 35 download-to-paid conversion of 2.7%, compared to 1.5% for low-priced apps (RevenueCat State of Subscription Apps 2025). The reason is intent. Someone willing to pay more has already decided the problem is serious enough to solve. A lower price attracts a broader audience, but a less committed one.
The gap compounds over time. High-priced apps show a median Year 1 LTV (lifetime value) of $55.21 per paying subscriber, approximately 7x the LTV of low-priced apps (RevenueCat State of Subscription Apps 2025). That's not just because the price itself is higher. It's because the price attracts users who extract real value from the product.
The question to ask isn't "will users pay this?" It's "what price attracts the users most likely to stay?"
Method 1: Test Before You Launch
Survey-based methods are the most accessible way to test willingness to pay for a subscription app before you have installs to work with. They give you directional signal before you commit.
1. Van Westendorp Price Sensitivity Meter
The Van Westendorp Price Sensitivity Meter asks four questions to a representative sample of your target users:
-
At what price would this app be so expensive you wouldn't consider it?
-
At what price would it seem so cheap you'd question the quality?
-
At what price would it start to feel expensive, but you'd still consider it?
-
At what price would it feel like a bargain?
Plot the response curves. The intersections define your acceptable price range. The zone between the "too cheap" crossover and the "getting expensive" crossover is where users consider your price both credible and reasonable. Use this to avoid entering the market outside the range your users will take seriously.
2. Gabor-Granger Pricing Survey
Gabor-Granger asks respondents whether they would subscribe at a specific price, repeated across several price points (for example: $4.99, $7.99, $12.99, $19.99 per month) with different respondent groups. The result is a demand curve showing how purchase intent drops as price increases.
Stated intent over-estimates real behavior. Use Gabor-Granger for relative ranking — understanding which price threshold causes the sharpest drop in intent — not as an absolute predictor of conversion.
3. User Interviews Focused on Jobs-to-Be-Done
Surveys measure stated willingness to pay. Interviews uncover what's driving it. Emotional jobs drive higher willingness to pay than functional ones. Urgency and perceived consequence are stronger signals than how often someone uses the app.
Avoid asking "how much would you pay?" directly. Users anchor to low numbers. Instead, ask:
-
"What happens if this problem doesn't get solved?"
-
"Have you tried other solutions? What did those cost?"
-
"Where does this fit in your monthly spending?"
The answers tell you whether your app is solving a vitamin problem (nice to have) or a painkiller problem (must solve). Painkiller positioning justifies higher prices and retains subscribers longer.
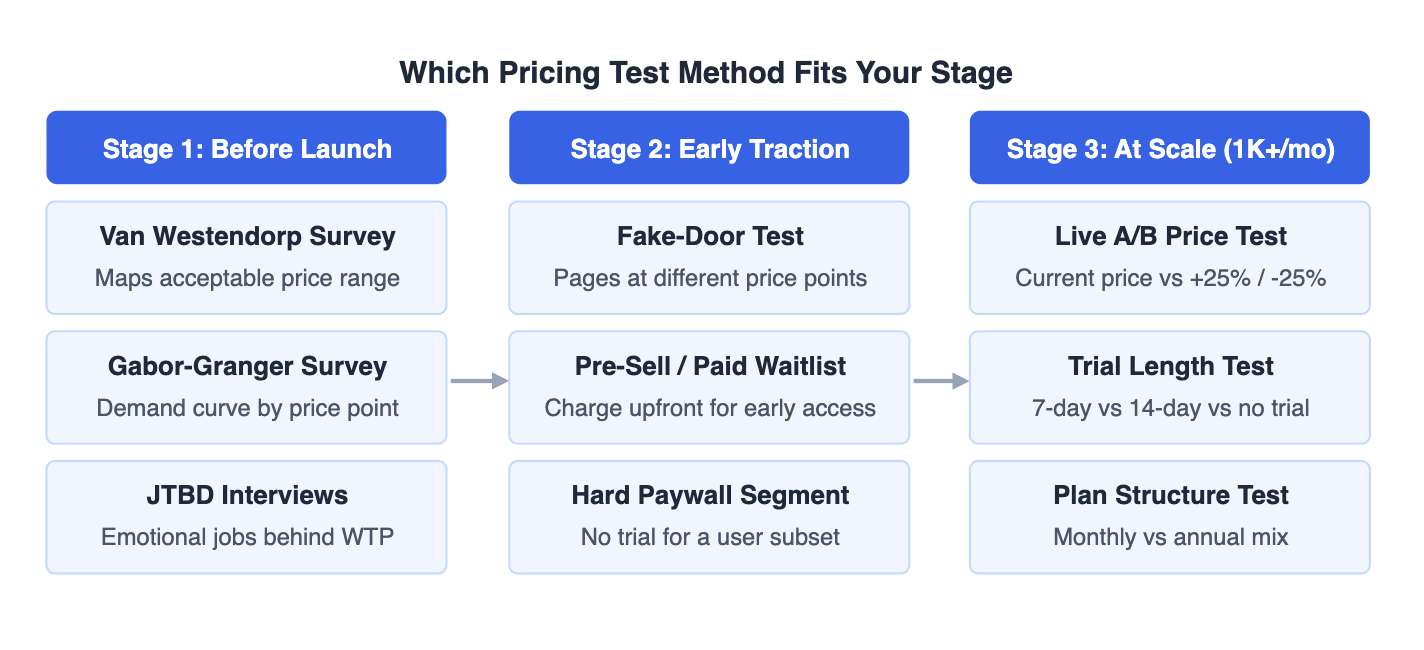
Method 2: Test With Behavioral Signals
Surveys tell you what users say they'll do. Behavioral methods measure what they actually do when money is involved. These work when you have some users but not yet enough volume for a statistically valid A/B test.
1. The Fake-Door Price Test
Build two or three landing pages with identical product descriptions but different price points. Run small paid campaigns to each page, targeting 200 to 500 visitors per variant. Measure click-through rate on the subscribe CTA. The relative differences in intent across pages reveal which price anchor is resonating.
2. Pre-Selling Before Launch
Selling before you build, or before you've reached scale, is one of the strongest willingness-to-pay signals available. If users pay upfront for early access at your intended annual price, you've confirmed both the problem and the price in one step. A paid beta with as few as 20 to 50 users produces more actionable information than any survey.
3. Hard Paywall for a Segment
If your app is live but you haven't committed to a price, run a hard paywall (no free trial) for a portion of new users. Hard paywalls report a median Day 35 download-to-paid conversion of 12.1%, compared to 2.2% for freemium apps (RevenueCat State of Subscription Apps 2025). The conversion is higher because only users who genuinely see value pay without trying first.
Hard paywall subscribers also show higher long-term revenue: a median Year 1 LTV of $49.30, compared to $24.24 for freemium users (RevenueCat State of Subscription Apps 2025). The tradeoff is a higher refund rate, 5.8% versus 3.4% for freemium. As a short-term pricing signal on a segment of users, the directional data is worth it.
Want to see how App pricing experiments works with your data?
Get hands-on with Airbridge and see real results.
Try It Free →Method 3: Live App Pricing Experiments at Scale
Once you have consistent install volume (typically 1,000+ per month), live A/B testing is the most reliable method for app pricing experiments. You're measuring actual subscription behavior, not intent, not proxies.
1. What to Test
Start with price point only. Don't change trial length, plan structure, and price simultaneously. If three variables change at once, you can't isolate which one moved the result.
A practical starting range: test your current price against +25% and -25% variants (Purchasely, In-App Subscription Price Testing). If your monthly plan is $9.99, test $7.49 and $12.99.
It's also worth prioritizing plan and trial structure experiments over visual or copy changes. Pricing and plan experiments improve LTV at nearly 2x the rate of paywall visual or copy changes (Adapty State of In-App Subscriptions 2026), a strong argument for testing price before testing button color.
2. How to Set Up the Test Correctly
Calculate sample size before you start. For a baseline trial-to-paid rate around 30% and a 10% relative lift, you typically need 2,500 to 3,500 users per variant to reach 95% confidence (use a sample size calculator to get the exact number for your baseline). Run the test to completion even if one variant leads early.
Test one variable at a time. Changing price and trial length together makes it impossible to know which change moved the result. This is the most violated rule in pricing experimentation.
Configure for subscriptions, not trials. Many A/B testing setups default to trial starts as the success event. Make sure your experiment tracks paid subscriptions, not just the top of the funnel. See RevenueCat's guide to mobile app price testing for a platform-specific walkthrough.
3. Platform Tools
App Store Connect, Google Play Console, RevenueCat Experiments, and Purchasely all support live price tests natively. Note that Apple limits subscription price increases to once per year for existing subscribers without requiring re-consent. Factor this constraint into how aggressively you test upward.
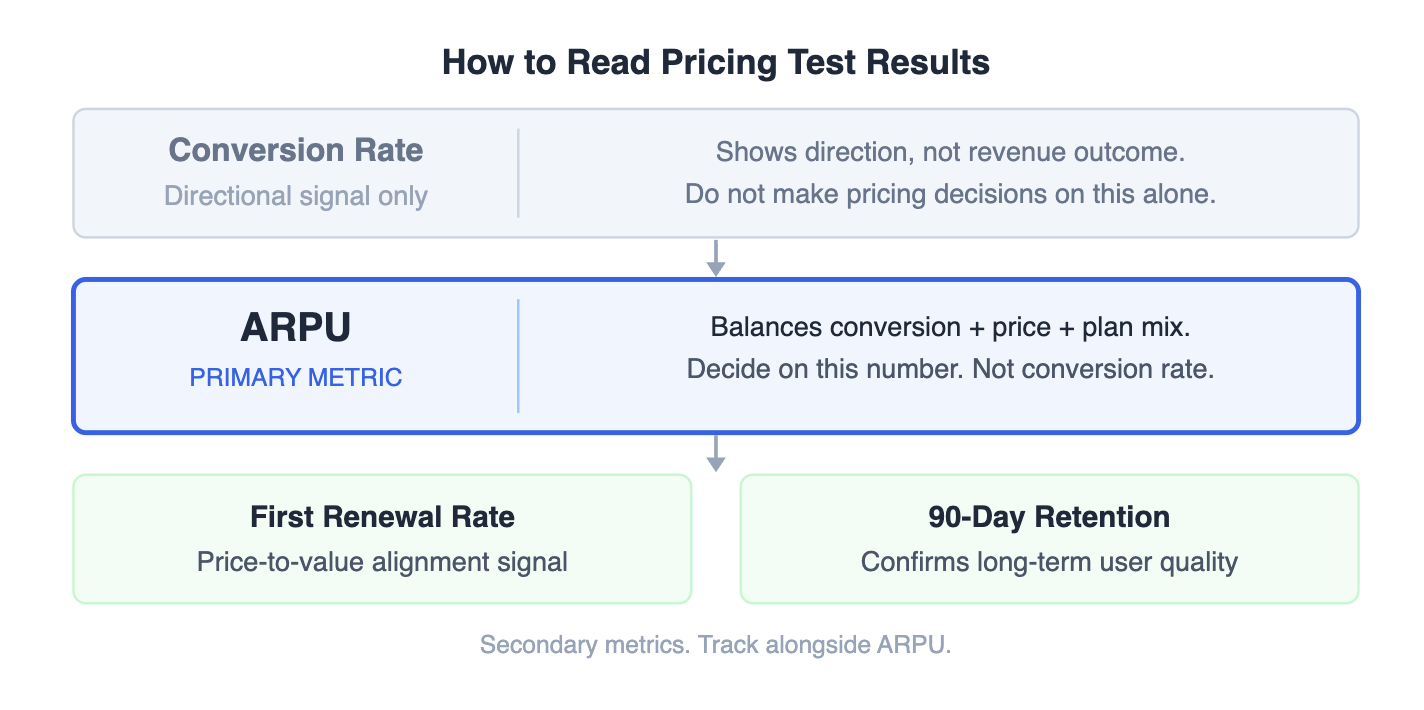
Reading Results: The Metric That Matters
The key rule for reading app pricing experiments: conversion rate alone is a trap. A lower price almost always converts better. That tells you nothing useful about revenue.
The correct primary metric is ARPU (average revenue per user). ARPU accounts for conversion rate, the actual price paid, and plan mix in a single number. If you want to track how ARPU compounds into long-term value, see how LTV is calculated across plan types. If your $7.49 variant converts at 42% but your $12.99 variant converts at 28%, ARPU shows which variant generates more revenue per 100 users entering the funnel.
The data supports this: price experiments improve conversion with only 28% probability, but improve LTV with 46% probability (Adapty State of In-App Subscriptions 2026). Teams running app pricing experiments achieve up to 40x more revenue than those who don't (Adapty, 2026).
Beyond ARPU, track two secondary metrics. First renewal rate shows whether the subscribed cohort continues past the first billing cycle, the earliest signal of whether price is aligned with perceived value. 90-day retention reveals whether the price attracted committed users or just any users. A price test that improves ARPU but collapses 90-day retention is optimizing short-term revenue at the cost of long-term subscribers.
| Metric | What It Measures | When It Misleads |
|---|---|---|
| Conversion rate | How many users start a subscription | Shows lower price as winner even when it generates less revenue |
| ARPU | Revenue per user entering the funnel | Primary metric. Use this to decide. |
| First renewal rate | Price-to-value alignment | Leading indicator for subscriber quality |
| 90-day retention | Long-term subscriber quality | Takes longer but reveals whether you attracted the right users |
Common Pricing Experiment Mistakes
Treating one result as final. App pricing experiments answer a question about your current product, your current acquisition mix, and your current paywall. Any of those change, and the optimal price may shift. The best teams run pricing experiments continuously, not once at launch.
Measuring too early. Nearly 30% of annual subscriptions cancel within the first month (RevenueCat State of Subscription Apps 2025). If you measure success at Day 7 conversion, you'll miss this early churn entirely. Extend your measurement window to at least 30 days before drawing conclusions from any pricing test.
Assuming discounts help. 9 out of 10 subscriptions sell at full price, with only 10% using discounts of any kind (Adapty State of In-App Subscriptions 2026). Discounting rarely becomes necessary if you've set the right price. It's more often a sign the value framing hasn't caught up with the price point.
Reading results on one platform only. iOS captures 85% of subscription revenue globally, and annual-plan revenue per subscriber runs 7.7x higher on iOS than Android (Adapty State of In-App Subscriptions 2026). A pricing change that looks flat across platforms can be hiding a significant iOS win or loss. Segment results by platform before making a final decision.
Changing price without changing value framing. A price increase not accompanied by a shift in how you communicate value tends to fail. Pricing stability signals confidence. Constant price changes erode trust. When you move a price up, move the perceived value framing up with it.
What This Looks Like in Practice
Here's how a founder moves through all three stages with a fitness app.
Stage 1 (before launch): She runs a Van Westendorp survey with 52 potential users recruited from a fitness subreddit. Results show an acceptable price range of $7.50 to $15.00 per month, with a psychological anchor clustered around $9.99. She launches at $9.99 monthly with a 7-day free trial.
Stage 2 (early traction): At around 400 installs per month, volume is too low for a clean A/B test. She runs five user interviews instead, asking about the consequences of not sticking to a workout routine. Three of five respondents mention accountability as the real pain, not the workouts themselves. She updates her paywall copy to center accountability, not features.
Stage 3 (at scale): By month four, she's averaging 1,400 installs per month. She runs a 6-week A/B test: $9.99 versus $12.99, one variable only.
| Variant | Trial-to-Paid Conversion | ARPU | 90-Day Retention | First Renewal Rate |
|---|---|---|---|---|
| $9.99 / month | 33% | $3.30 | 59% | 52% |
| $12.99 / month | 26% | $3.64 | 71% | 66% |
These numbers are illustrative. Your results will vary by category and audience.
Reading only conversion rate, the $9.99 variant wins by 7 percentage points. Reading ARPU, the $12.99 variant generates 10% more revenue per user. Reading 90-day retention, the $12.99 cohort stays 12 percentage points longer. She moves to $12.99, then schedules the next test: $12.99 versus $15.99. That's the loop.
Pricing Is Where Product Confidence Lives
The anxiety behind "is my price right?" is usually anxiety about whether the product is worth it. Pricing experiments don't just find a better number. They reveal whether users believe your app solves a real problem at real stakes. If your tests repeatedly show that users won't pay above a low threshold, the finding isn't that you need a lower price. It may mean you need a sharper value proposition, a clearer paywall, or a more precisely defined target user.
Run app pricing experiments at every stage, read them by ARPU and retention, and treat each result as input to the next iteration.


Ready to transform your mobile growth?
Learn how Airbridge helps leading brands measure and optimize every touchpoint.