4 Months of Airbridge AI: How 820 Brands Actually Used It


It's already been four months since Airbridge AI launched. When we first announced it, we got a flood of questions about how, exactly, teams could put it to work.
Four months in, we went back and reviewed how customers actually used it. Every team developed its own way of asking. And instead of the one-question, one-answer pattern of a traditional chatbot, follow-up questions became the norm. More teams than we expected asked in languages other than Korean.
Plenty of articles explain what an AI marketing assistant can do. Very few publish the record of what the teams who adopted one actually asked, and how much.
This post lays out the real usage data from Airbridge AI's first four months, five ways your team can put it to work, and the MCP usage patterns that are expanding beyond the dashboard.
📌 Key takeaways
-
In four months, 820 brands asked 16,610 questions. Airbridge AI became a whole-team tool, not one specialist's tool.
-
The most common topics were event taxonomy, SDK, and reporting. Implementation and operations questions vastly outnumbered analysis questions.
-
Outside the dashboard, 800+ people connected Airbridge to their own AI via MCP, and those connections pulled data 22,207 times in the last 30 days alone.
Airbridge AI Fielded 16,610 Questions in Four Months
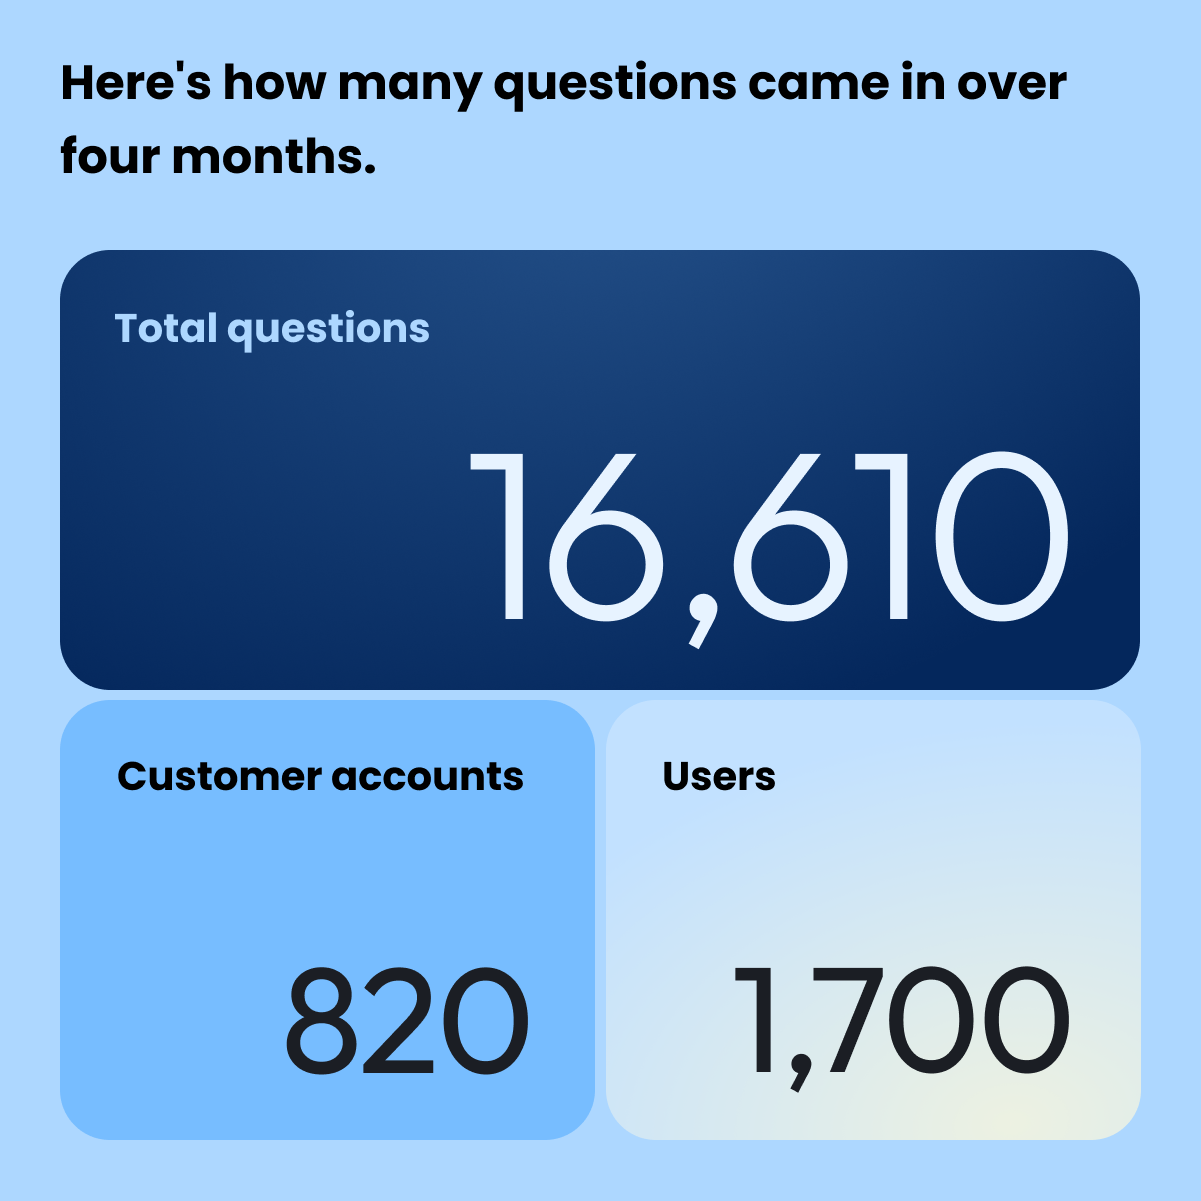
16,610 total questions, 820 customer accounts, and 1,700 users over four months
Between March 25 and July 23, 2026, Airbridge AI received 16,610 questions. That came from roughly 820 brands and about 1,700 individual users.
The monthly trend tells the same story: by day 23, July had already passed all of June. That's a sign Airbridge AI has spread broadly into day-to-day work.
The 5 Things Customers Asked Airbridge AI About Most
Sort the questions by type and it becomes clear which Airbridge AI capabilities customers reach for. Event and taxonomy design drew the most questions by far, followed by SDK installation and integration, then report lookups.
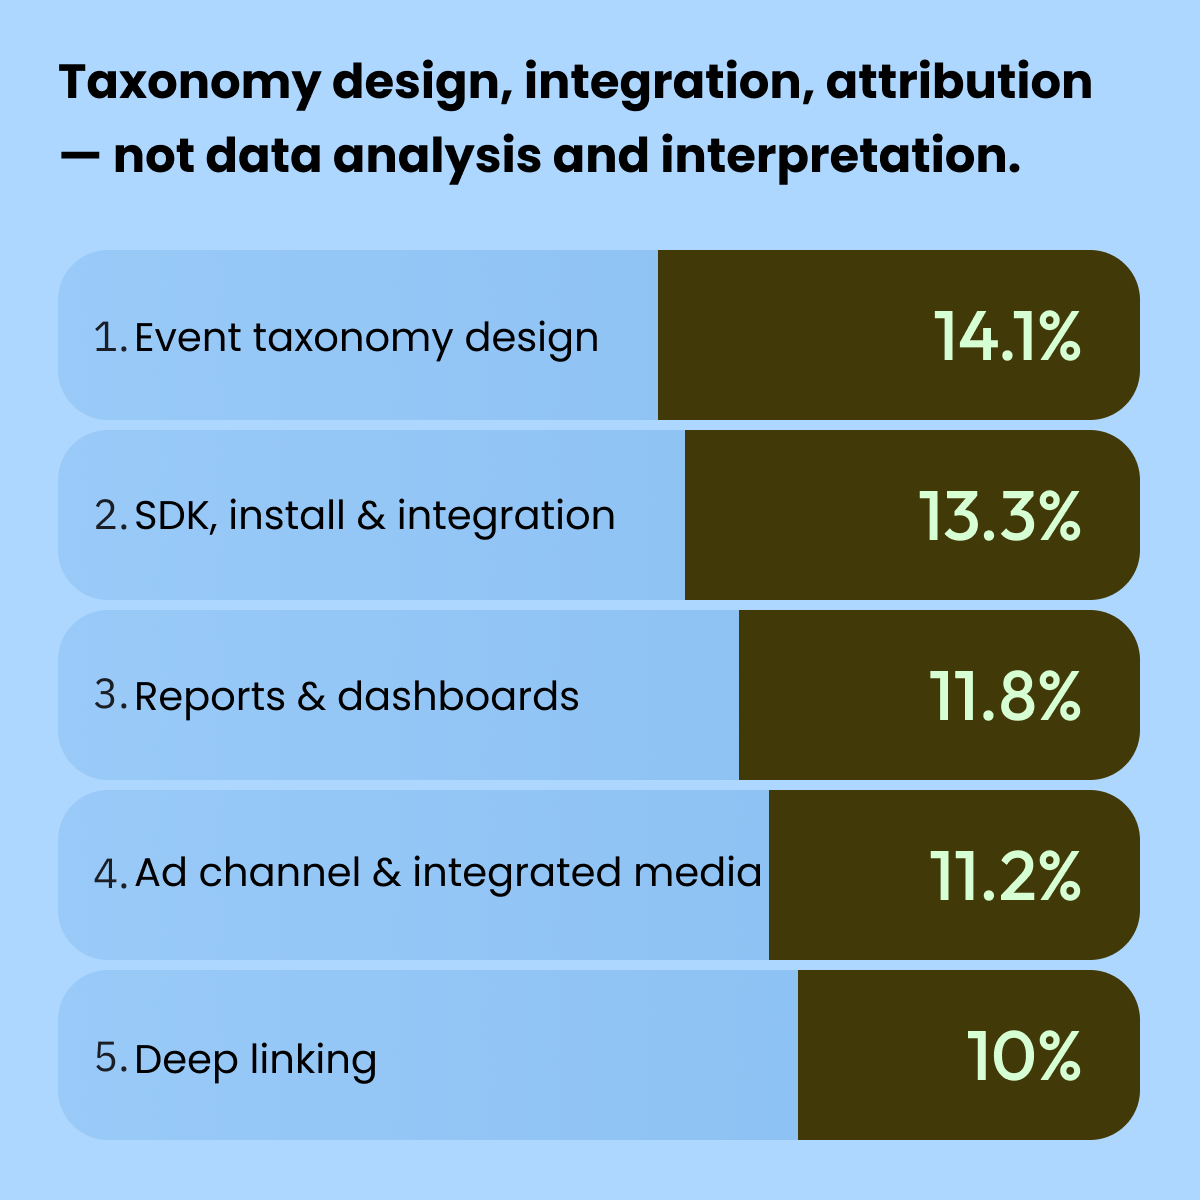
Top 5 question types — event taxonomy design 14.1%, SDK/install/integration 13.3%, reports & dashboards 11.8%, ad channel & media integration 11.2%, deep linking 10%
| Rank | Question type | Share |
|---|---|---|
| 1 | Event & taxonomy design | 14.1% |
| 2 | SDK, install & integration | 13.3% |
| 3 | Reports, dashboards & data lookups | 11.8% |
| 4 | Ad channel & media integration | 11.2% |
| 5 | Deep linking | 10.0% |
SDK, install and integration was the second most-asked area after event and taxonomy design — a clear signal that most newly onboarding teams hit a wall at least once in this stretch.
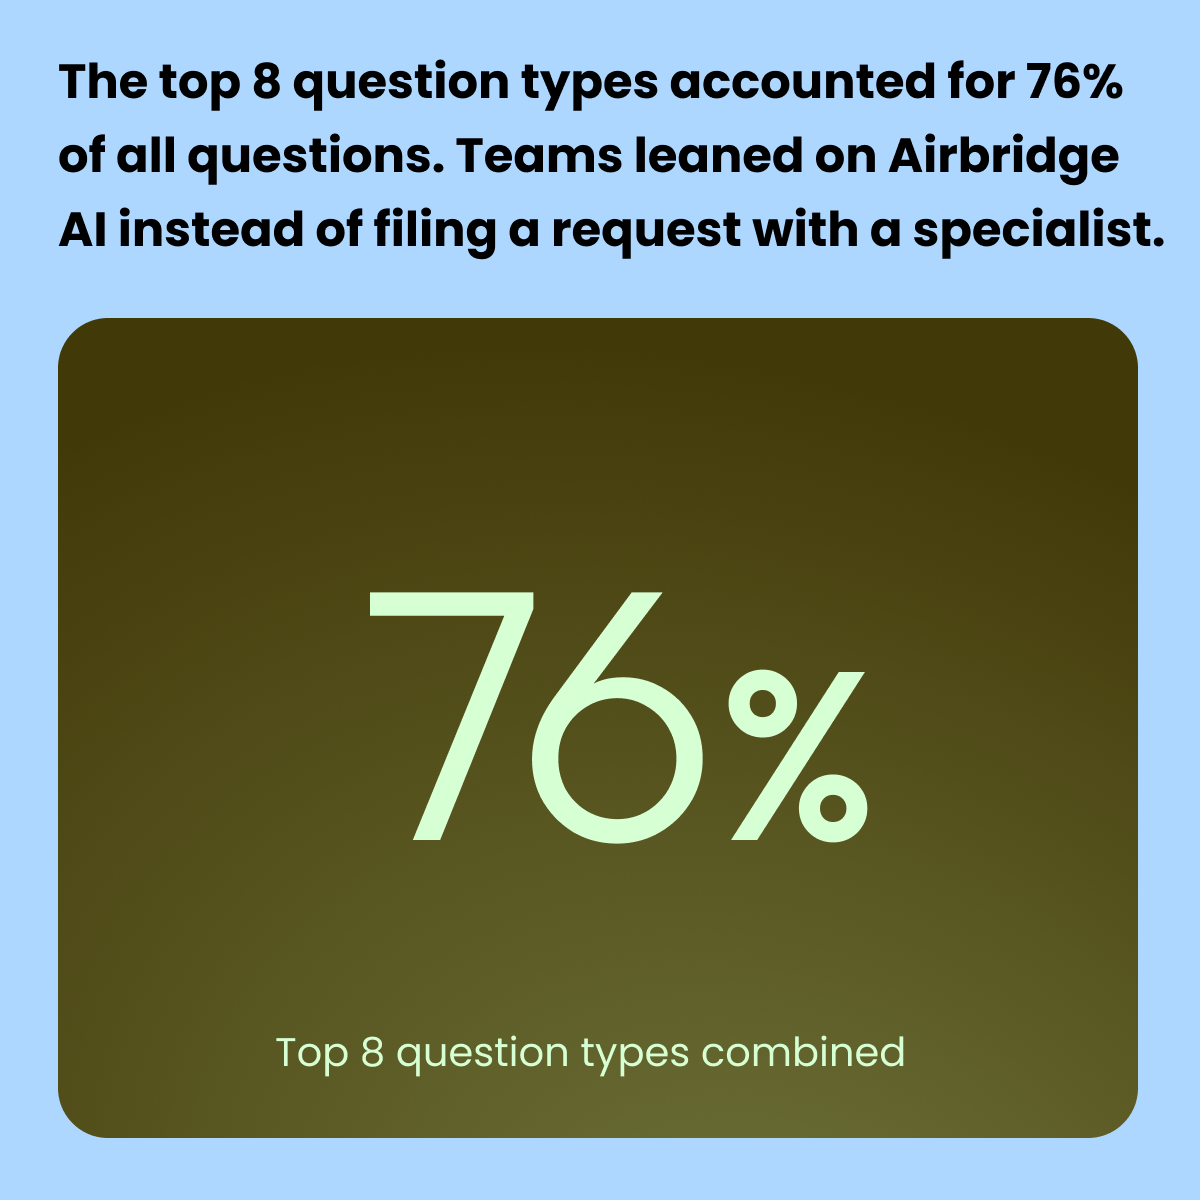
Look at the distribution and all five of the top types cluster around implementation and day-to-day operations. Questions about standing up and running a measurement foundation overwhelmingly outnumbered questions about interpreting data. Add troubleshooting and data discrepancies, ad spend and ROAS, and attribution, and the top 8 types account for 76% of all questions.
In other words, when the guides don't immediately answer the situation in front of you, teams turned to Airbridge AI to solve it themselves instead of filing a request with a specialist.
Want to see how Airbridge AI usage data works with your data?
Get hands-on with Airbridge and see real results.
Try It Free →5 Real Questions Teams Sent to Airbridge AI
Here's how real teams asked Airbridge AI and what came back. We've left out company names and identified each one by vertical only — see whether any of them look like your situation.
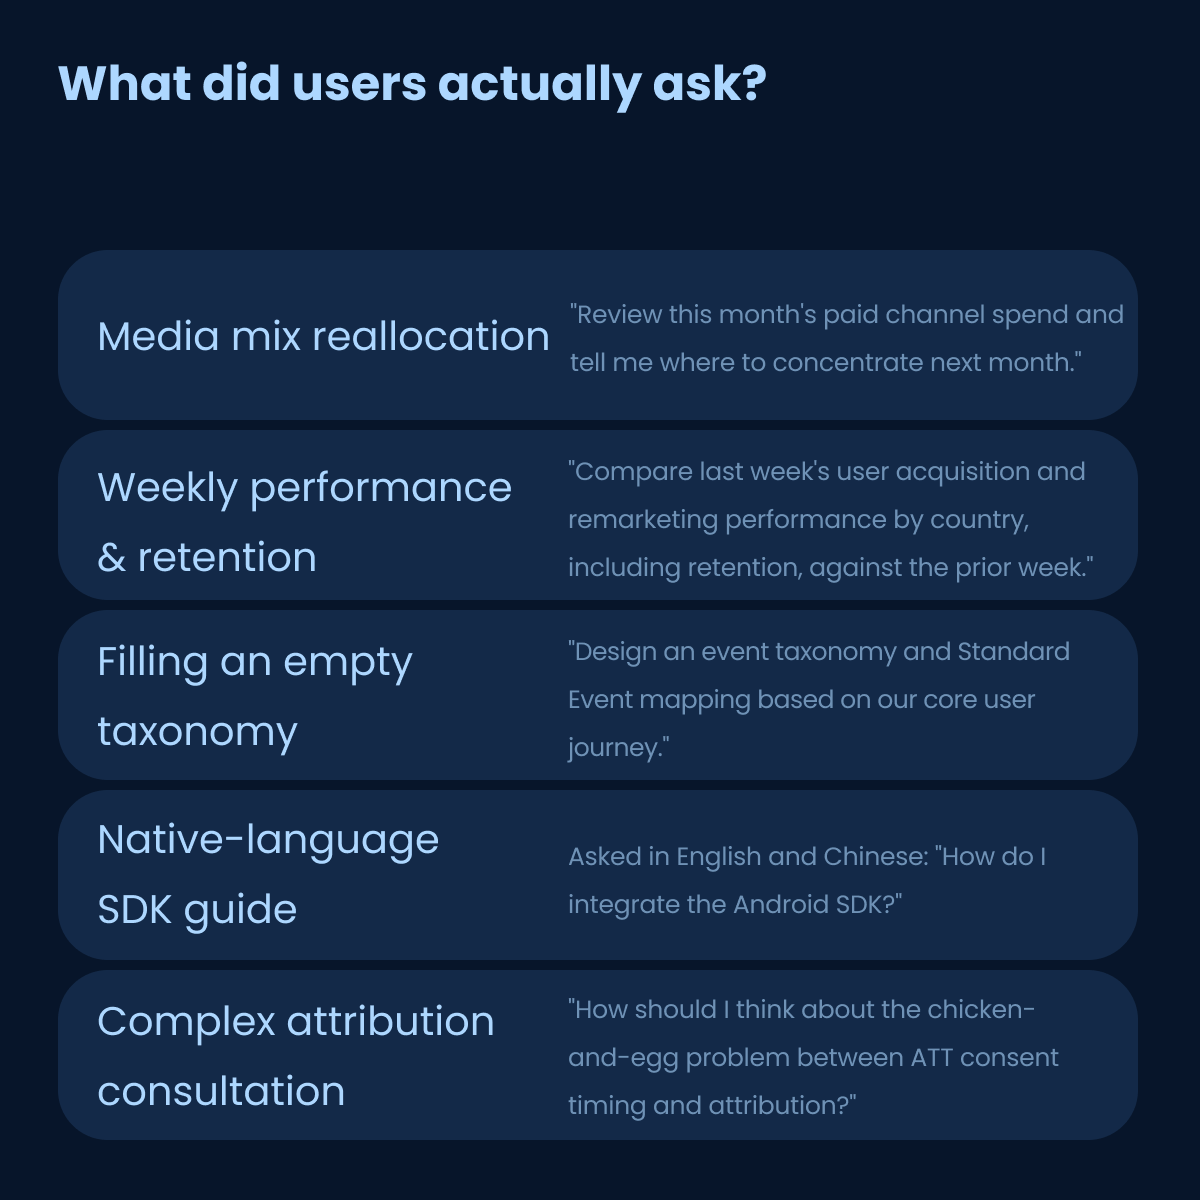
Five real user questions — media mix reallocation, weekly performance and retention, filling an empty taxonomy, native-language SDK guides, complex attribution consultation
1. Analyze our media mix — and recommend next month's budget
A commerce app team operating outside Korea asked Airbridge AI this:
"Review this month's paid channel spend and tell me where to concentrate next month."
Airbridge AI came back with a table of Cost, Cost Share, Installs, CPI, Orders, MAU and ROAS by channel, plus a budget reallocation recommendation layered on top. Because it applied the account's own currency and time zone, the team could read it immediately without converting anything.
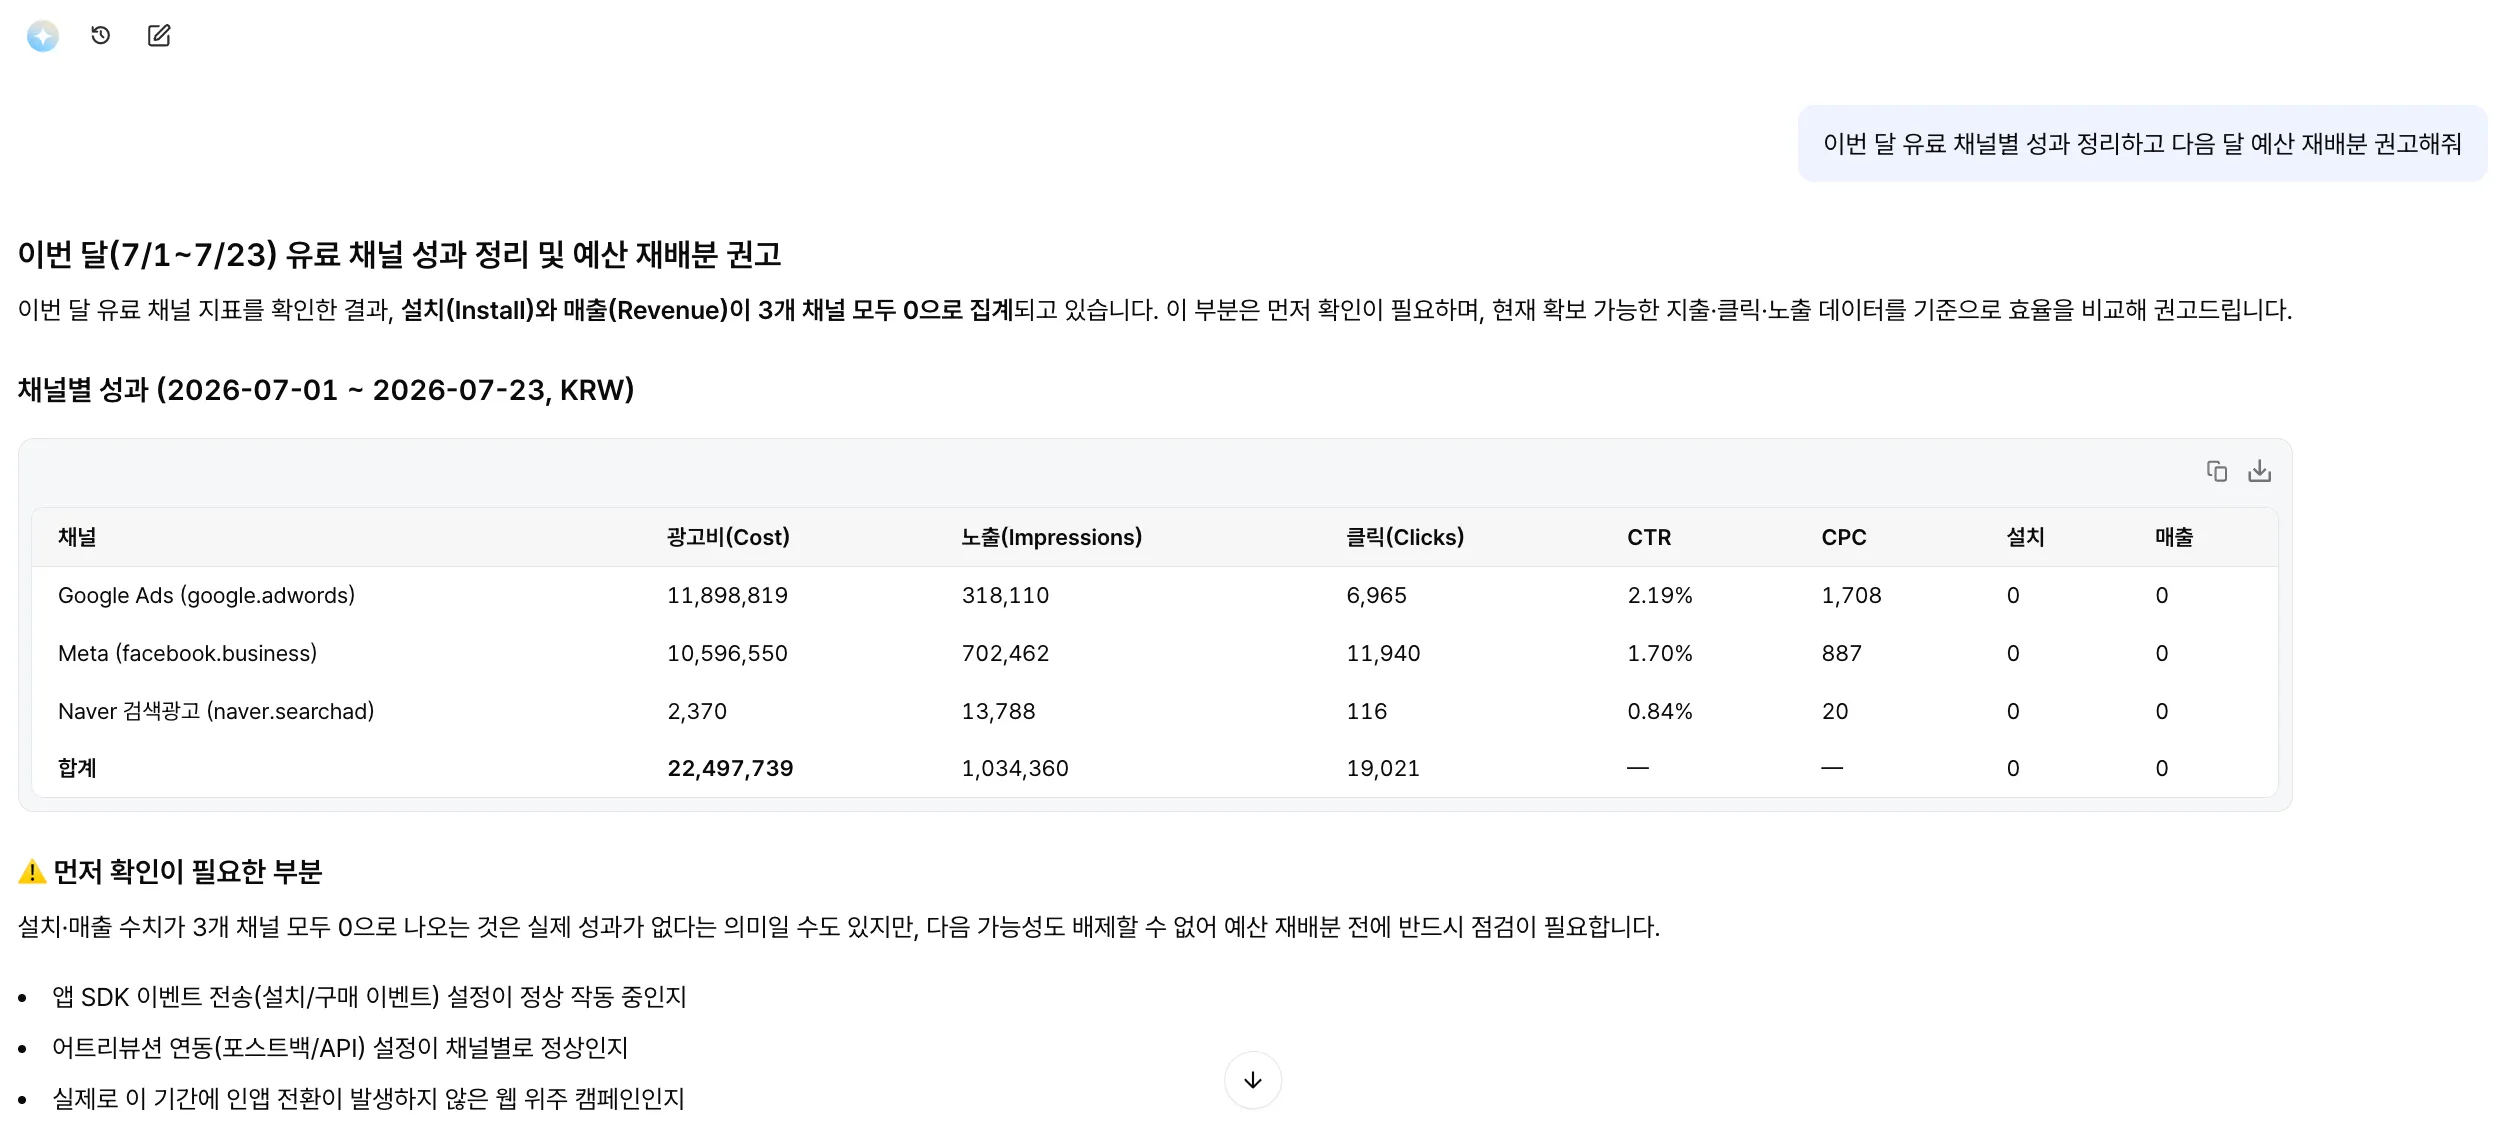
Airbridge AI answer example — a paid channel performance table with a budget reallocation recommendation
2. Roll weekly performance and retention into a single question
"Compare last week's user acquisition and remarketing performance by country, including retention, against the prior week."
For this one, Airbridge AI automatically identified custom metrics like CPA, CVR and D1/D7 retention, then built four Actuals reports at once and returned a period-over-period comparison. Work that used to mean opening reports one by one and lining up metrics by hand collapsed into a single question.
3. Fill an empty event taxonomy using app data
Taxonomy design demands knowledge of the user journey and Standard Event mapping, which is exactly where new teams with no template to work from tend to get stuck.
"Design an event taxonomy and Standard Event mapping based on our core user journey."
Ask Airbridge AI that, and even with an empty taxonomy template it infers your vertical from app data — app store listing, platform, currency — and maps a Standard Event set for you.
4. Generate SDK guides in each team's own language
One team asked, in Chinese, "How do I integrate the Android SDK?" Airbridge AI returned a step-by-step guide in Chinese with code blocks inline, covering everything from adding the repository to initialization.
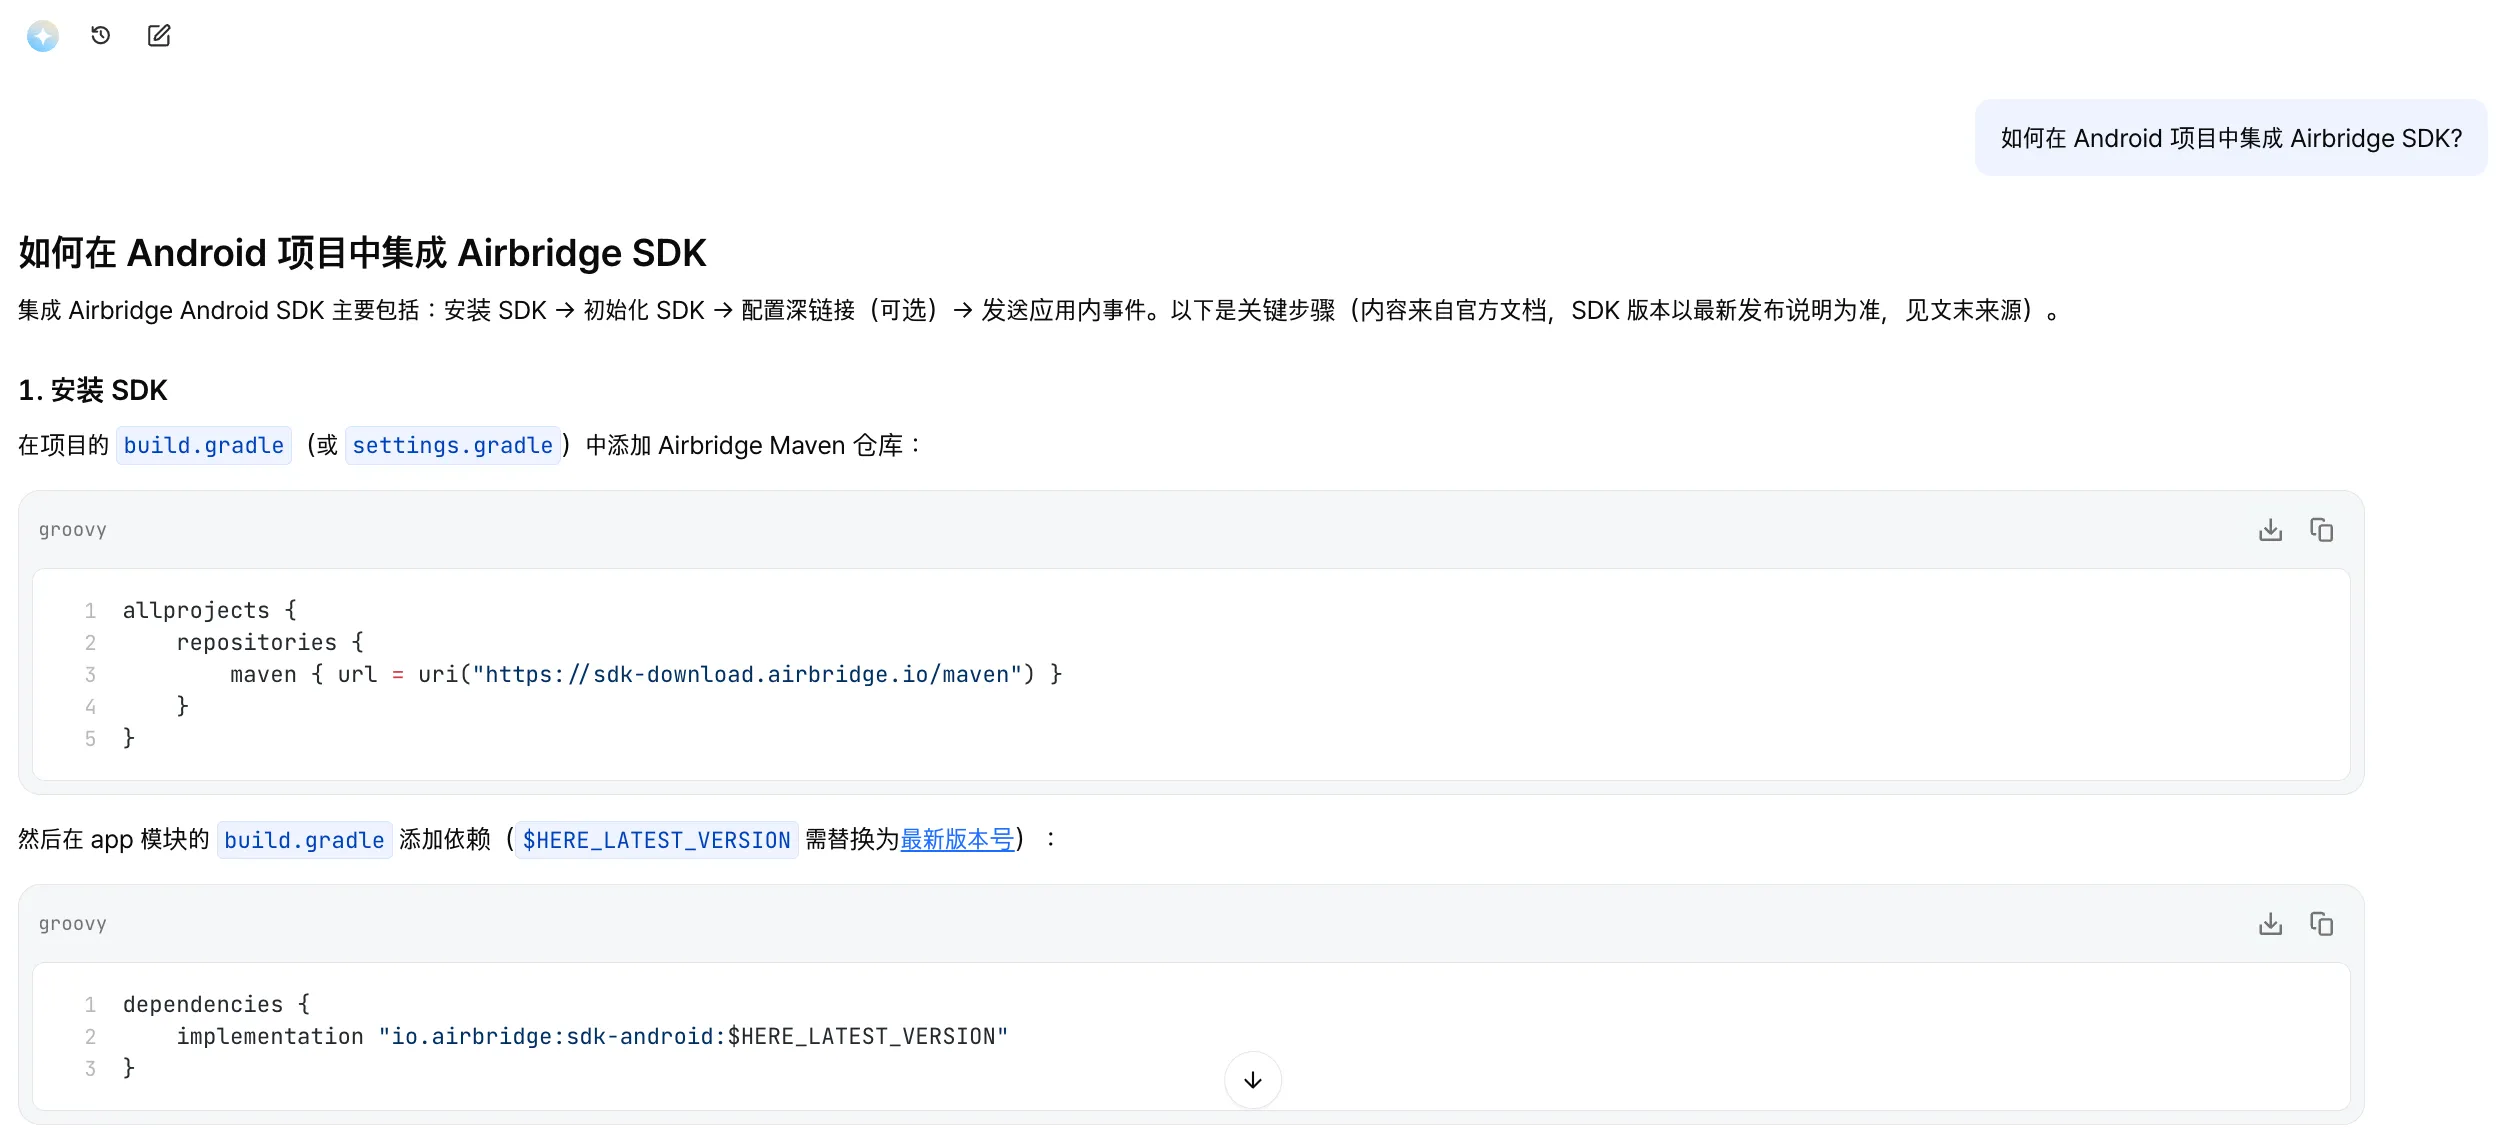
Airbridge AI answer example — a step-by-step Android SDK integration guide written in Chinese
5. Work through complex attribution questions against official docs
One user asked, in English, how to think about the chicken-and-egg problem between ATT (Apple App Tracking Transparency) consent timing and attribution.
For a question that deep, Airbridge AI searched the official documentation first, then separated the scenarios by whether attribution is deterministic, and explained how the product's design resolves the problem with the reasoning behind it. This is a problem you can only untangle if you understand the concept and the product design together — so Airbridge AI became a channel for getting immediate help on a question you wouldn't even know who to ask.
Power Users Trigger Whole Workflows with Slash Commands
Everything above is how most people use Airbridge AI. A small group of power users goes one step further and leans hard on AI Skills Slash Commands.
Looking at Slash Command usage since launch, the taxonomy design command was used most, with the data analysis command right behind it.
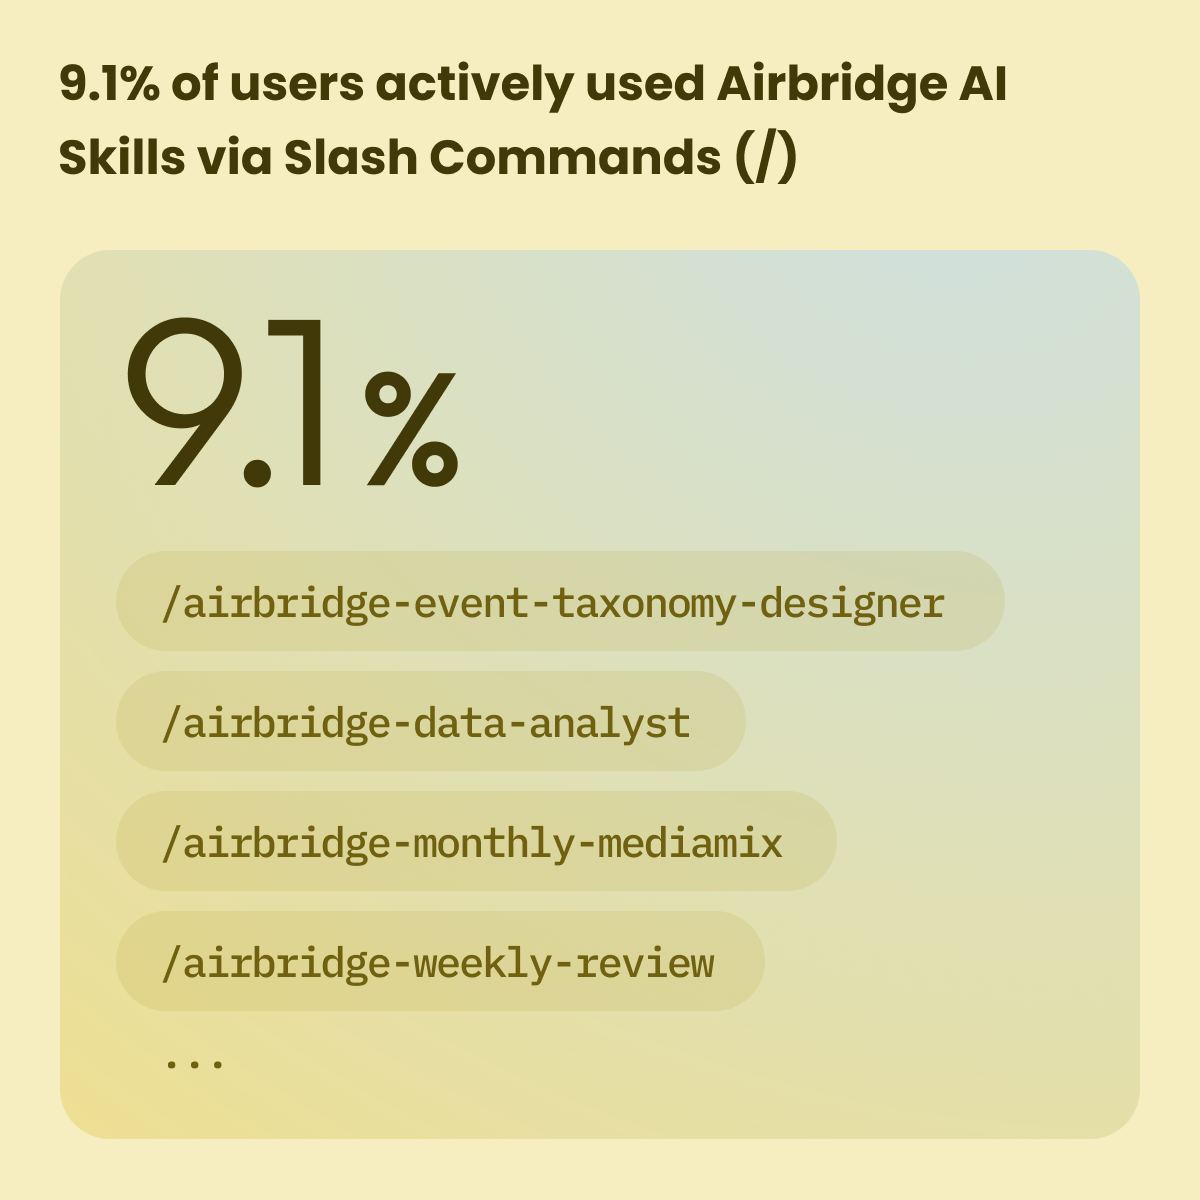
9.1% of users used Slash Commands to run Airbridge AI skills
| Slash Command | What it does |
|---|---|
| /airbridge-event-taxonomy-designer | Auto-design an event taxonomy |
| /airbridge-data-analyst | Request a data analysis |
| /airbridge-monthly-mediamix | Monthly media mix analysis |
| /airbridge-weekly-review | Weekly performance review |
| /airbridge-industry-benchmark | Industry benchmarks |
| /airbridge-campaign-brief | Write a campaign brief |
| /airbridge-kpi-taxonomy | KPI taxonomy design |
| /airbridge-analyze-discrepancy | Data discrepancy analysis |
One command runs a repeatable task, and you can build your own skills to fit how your team works. On volume, though, Slash Commands account for roughly 1.5% of all questions and are used by about 9.1% of users — a subset, not the majority.
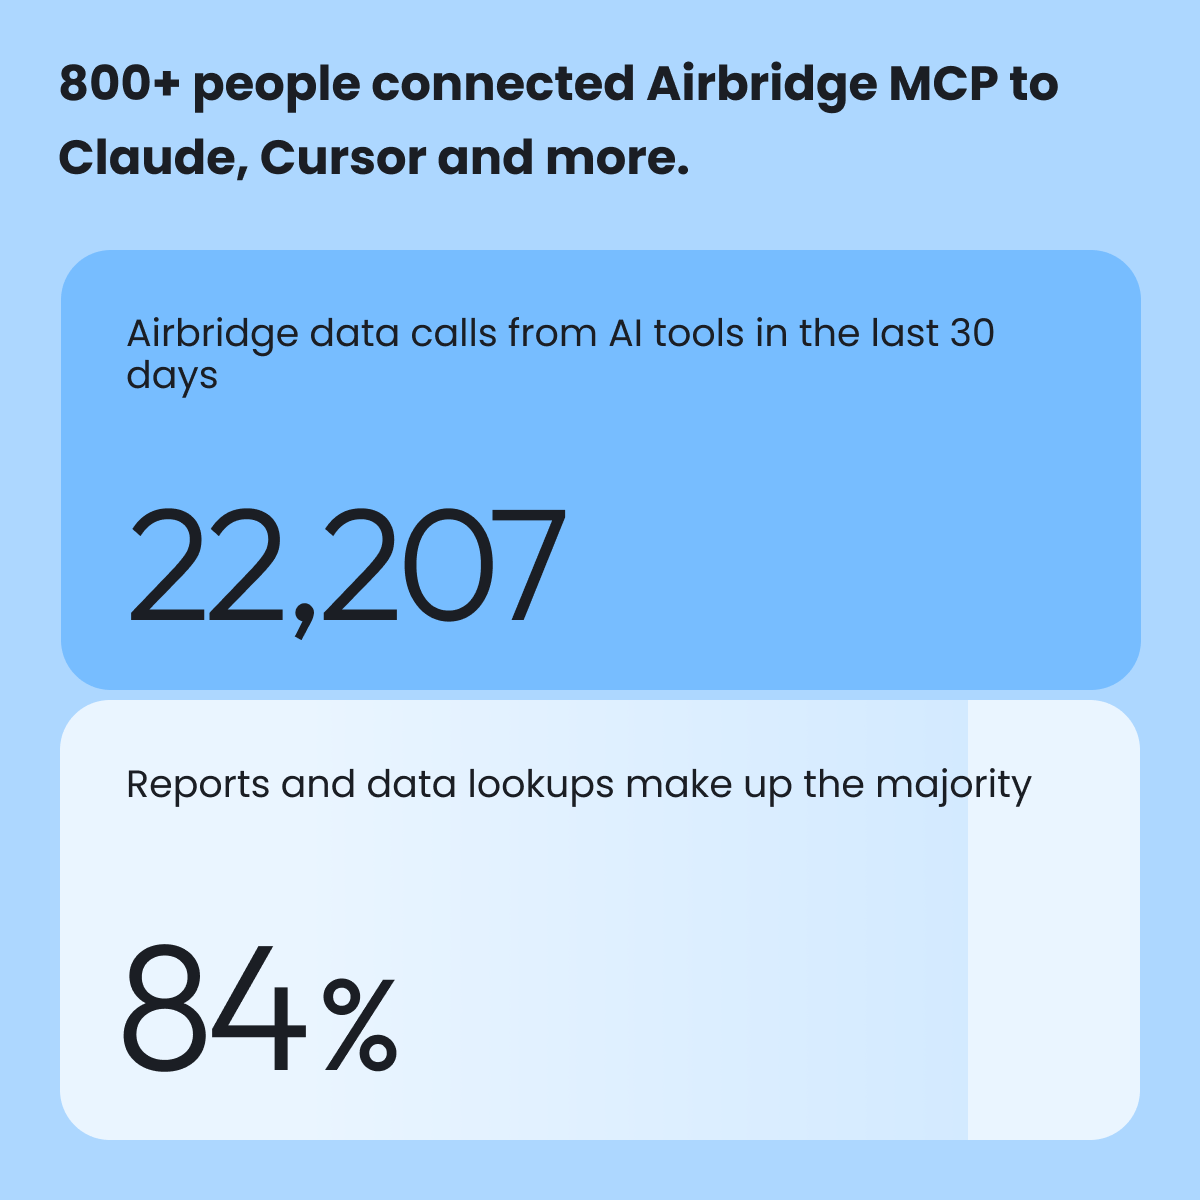
800+ people connected Airbridge MCP, 22,207 data calls in the last 30 days, 84% of them reports and data lookups
So most Airbridge AI users treat it as an implementation-and-operations assistant, while a small group of power users extends it into full analysis workflows.
Airbridge MCP: 800+ People Connected Airbridge to Claude and Cursor
Everything so far happened inside the Airbridge dashboard. Now let's look at the data on how Airbridge shows up inside the AI tools customers already use.
Alongside the Airbridge pilot, we opened the Airbridge MCP (Model Context Protocol) server, which connects your data to the AI tools you're already in — Claude, Cursor and others. Since launch, 800+ people have connected Airbridge to their own AI.
Over the last 30 days (June 23 – July 22), those connected AI tools pulled Airbridge data 22,207 times. Connect it once and it becomes infrastructure you use every day.
Reports and data lookups make up about 84% of those calls — MCP is establishing itself as the channel for performance analysis done through AI.
What Four Months of Airbridge AI Data Told Us
Pulling four months of data together confirmed one thing: Airbridge AI isn't a chatbot returning canned answers. It's a tool that reads the data and settings as they are in that moment and builds an answer from them. And it's no longer confined to the dashboard — through MCP, it's a tool you can work with conversationally inside multiple AI tools.
Pick one question you're stuck on right now, put it to Airbridge AI in the dashboard exactly as you'd say it, and connect Airbridge MCP to the Claude or Cursor you're already using. See for yourself whether the answer comes back with tables and sources attached, and whether it reflects your account settings. That's how you'll get a feel for how Airbridge AI fits your team's situation.

Ready to transform your mobile growth?
Learn how Airbridge helps leading brands measure and optimize every touchpoint.