Why Mobile Attribution Numbers Don't Match: Ad Platforms vs MMP vs First-Party Data

If you run paid acquisition for a mobile app, you've probably seen this from the same campaign:
-
Meta reports 120 conversions
-
Google Ads shows 95 installs
-
Your MMP attributes 80 users
-
Your backend shows 65 actual subscribers
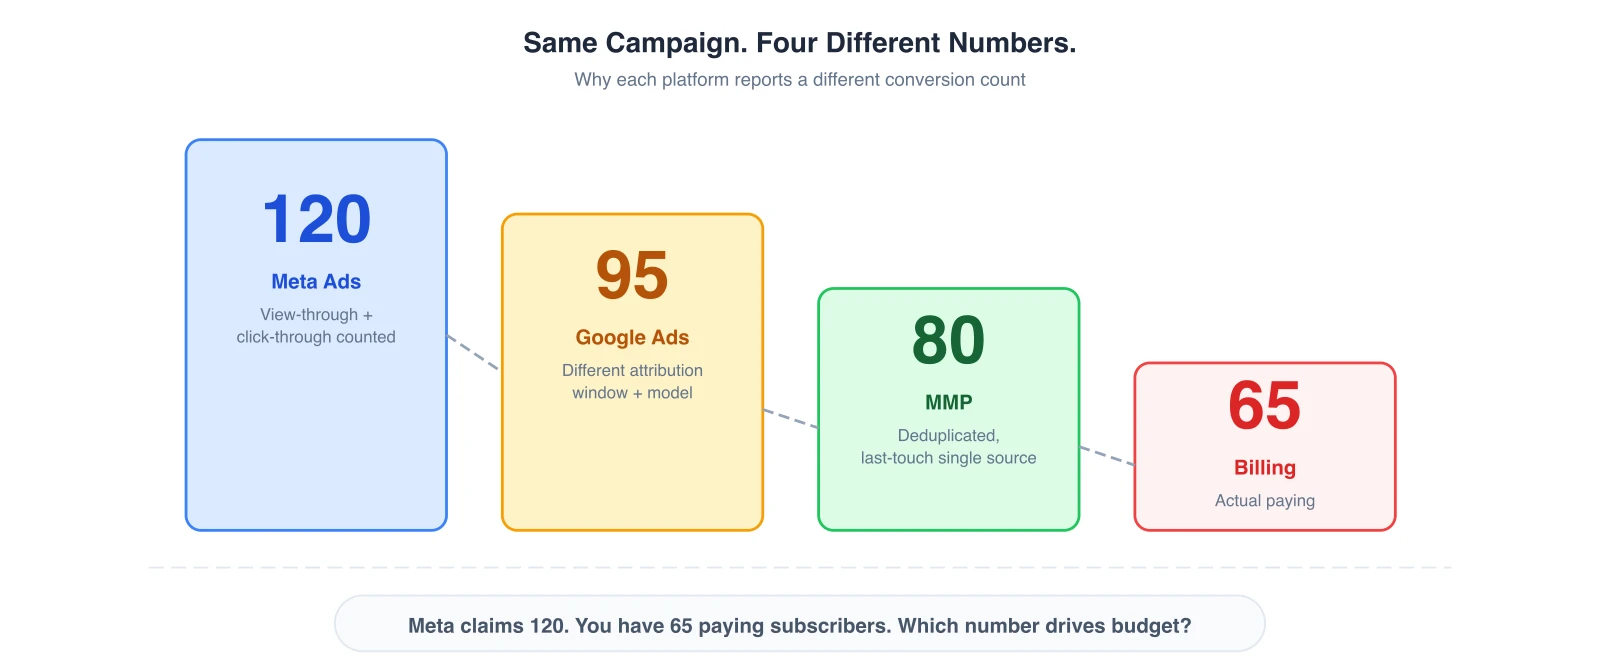
That 55-conversion gap isn't just a reporting inconvenience. It directly distorts your CAC, corrupts your MRR forecasts, and causes budget misallocation across channels.
When your ad dashboard shows 120 conversions but your billing system shows 65 paying subscribers, you're not just dealing with a data mismatch — you may be scaling spend on channels that aren't actually driving subscription revenue.
In this guide, we'll break down why mobile ad attribution discrepancies happen, how they affect growth decisions, and what performance teams can do to reduce attribution gaps.
📌 Key Takeaways
-
Ad platforms, MMPs, and first-party systems measure different things — which is why attribution numbers rarely match.
-
Self-Reporting Networks (Meta, Google, TikTok) often over-claim conversions due to view-through attribution and platform-controlled reporting.
-
Deduplication problems across channels cause the same user to be counted multiple times.
-
SKAdNetwork delays create timing gaps between real-time dashboards and actual conversion data.
-
Different attribution windows produce different interpretations of the same user journey.
-
Best practice: use a measurement hierarchy — first-party data for revenue truth, MMP for attribution, ad platforms for optimization.
Why Mobile Ad Attribution Data Discrepancies Happen
For growth teams responsible for scaling MRR and LTV, data discrepancy creates a dangerous situation: you can't confidently allocate budget if you don't know which channel actually drove the revenue.
Below are the three primary causes of mobile ad attribution data discrepancy.
1. Self-Reporting Networks (SRNs) Claim Credit by Design
Major ad platforms — Meta, Google Ads, Apple Search Ads, and TikTok — operate as Self-Reporting Networks (SRNs), also known as Self-Attributing Networks (SANs).
Unlike traditional ad networks, SRNs do not rely on external tracking links. They determine attribution internally based on their own user data.
This means the platform itself decides whether it contributed to the conversion — which introduces systematic over-attribution.
Example scenario:
-
A user scrolls Instagram and briefly sees an ad
-
Two days later, the same user searches Google for the app
-
The user installs and subscribes
What happens next?
-
Meta claims the conversion (view-through attribution)
-
Google claims the conversion (search click attribution)
While your real business outcome is 1 subscriber, your ad platform dashboards show 2 conversions. Key mechanics of SRN attribution:
-
Platforms use impression-level data unavailable to external tools
-
They apply view-through attribution windows
-
They prioritize their optimization models over cross-channel accuracy
As a result, platform dashboards are excellent optimization tools — but unreliable as a source of truth for total performance.
2. Cross-Channel Deduplication Problems
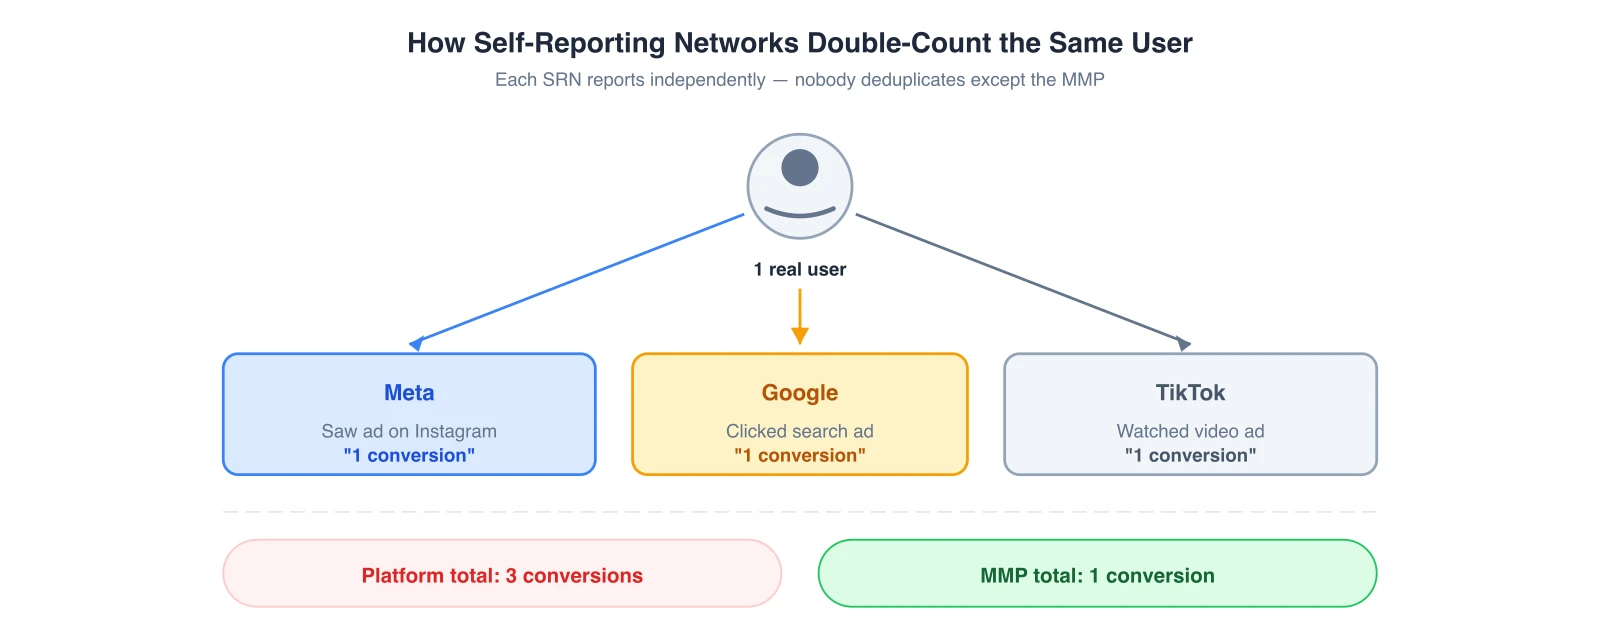
Even without SRN behavior, modern user journeys involve multiple marketing touchpoints. Mobile attribution requires deduplication logic — a system that decides which channel gets the final credit for a conversion. Without it, every platform counts the same user independently.
Typical multi-touch mobile user journey:
-
User sees a TikTok ad
-
Later clicks a Meta retargeting ad
-
Finally searches the brand on Google
-
Installs the app and starts a trial
If each platform counts independently, each will report 1 conversion — producing 3 reported conversions for 1 actual install and 1 subscription.
Why deduplication becomes difficult:
-
Platforms cannot see each other's data
-
Attribution windows differ across networks
-
Privacy policies restrict cross-platform tracking
Common signs of a deduplication problem:
-
Platform conversions exceed your actual install count
-
CAC calculations vary dramatically by source
-
ROAS looks profitable on every channel simultaneously
3. SKAdNetwork Creates Attribution Data Delays
iOS privacy changes introduced another major source of discrepancy: SKAdNetwork (SKAN). Instead of real-time, user-level attribution, SKAN provides delayed and aggregated signals.
Key SKAN characteristics:
-
Postback delays (often 24–72 hours)
-
Limited conversion values
-
Aggregated reporting
-
No user-level identifiers
As a result, the same campaign can appear to generate different performance numbers depending on when you check the dashboard. For subscription apps running trial → paid flows, the timing mismatch becomes even more complex because subscription events may occur days after install.
Why SKAN widens attribution gaps:
-
Delayed reporting changes daily metrics
-
Aggregation hides individual user paths
-
Conversion value limits reduce event detail
4. Attribution Windows Change Conversion Reporting
Every measurement system defines a different time window during which a conversion can be credited to an ad interaction. Because of this, the same user journey can be interpreted differently.
Example:
-
User clicks a Meta ad
-
Installs the app 6 days later
-
Subscribes 7 days later
Possible outcomes:
-
Meta may claim the conversion within its attribution window
-
Google may not see any attribution
-
Your MMP may attribute the install differently depending on configuration
None of these interpretations are technically incorrect. They simply follow different measurement rules.
How Attribution Discrepancies Impact Growth and Budget Allocation
Attribution discrepancies are often treated as a reporting annoyance. In reality, they are a growth risk that directly affects your ability to scale subscription revenue.
When acquisition data is inconsistent across platforms, marketing teams lose the ability to answer the most important scaling question: "Where should we invest the next $100,000 in acquisition budget?"
1. Budget Misallocation Across Channels
When ad platforms over-claim conversions, it becomes extremely difficult to evaluate channel performance accurately. Every channel appears profitable — but when deduplicated attribution is applied, the total number of unique conversions is much lower.
Typical outcomes:
-
Growth teams scale budgets on channels that appear profitable
-
Actual revenue growth lags behind spend
-
CAC begins increasing silently
This creates a hidden revenue leak where marketing spend grows faster than subscription revenue.
2. Optimization Signal Pollution
Modern ad platforms rely on machine learning to optimize campaigns. If attribution signals are inconsistent, the optimization loop becomes distorted.
Common signal problems:
-
Duplicated conversions across platforms
-
Delayed SKAdNetwork signals
-
Incomplete event tracking
-
Inconsistent attribution windows
Possible campaign outcomes from polluted signals:
-
Platforms prioritize low-quality installs
-
Retargeting campaigns dominate budgets
-
Top-of-funnel discovery campaigns get undervalued
3. MRR Forecasting Errors
Attribution discrepancies also create problems outside the marketing team. Finance and executive teams rely on accurate attribution signals to forecast growth. But when marketing dashboards and billing data don't align, forecasting becomes unreliable.
Typical symptoms:
-
Marketing reports higher conversion numbers
-
Finance reports lower subscription revenue
-
Leadership questions campaign performance
Want to see how Mobile attribution works with your data?
Get hands-on with Airbridge and see real results.
Try It Free →Ad Platforms vs MMP vs First-Party Data: Which Attribution Data Should You Trust?
When attribution numbers don't match, teams often ask: "Which dashboard is correct?" The reality is that each system measures something different, so the numbers will rarely align.
1. Ad Platforms (Meta, Google Ads, TikTok)
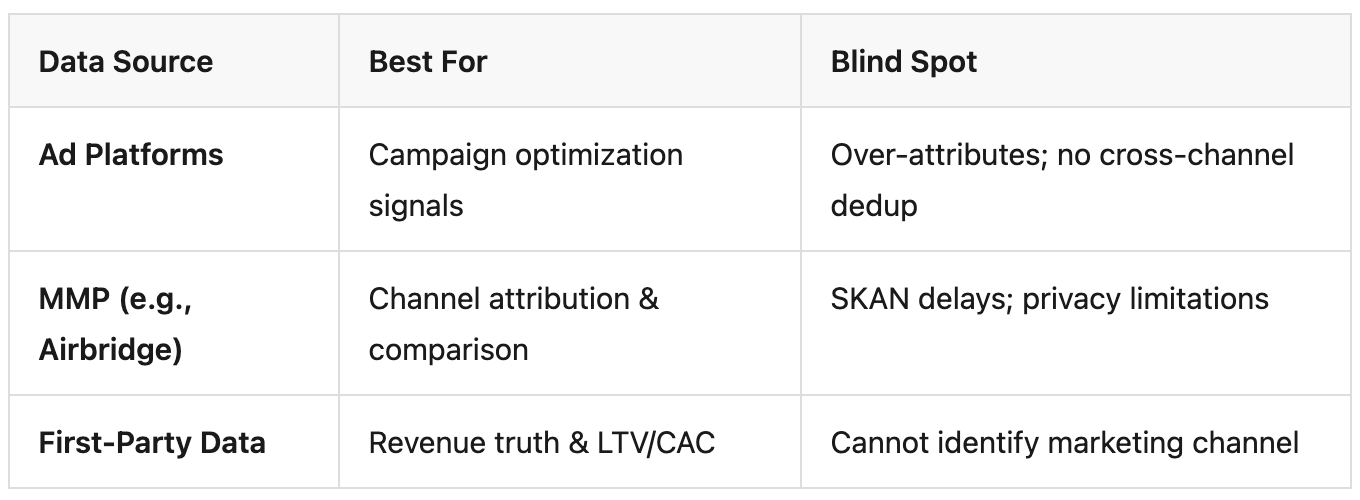
Ad platforms measure conversions within their own ecosystems using impressions, logged-in user data, and engagement activity. Because they cannot see external channels, they often claim more conversions than they actually drove. Their data is mainly designed to optimize ad delivery, not provide neutral reporting.
2. MMPs (Mobile Measurement Partners)
MMPs try to solve cross-channel attribution by collecting data from ad clicks, installs, and in-app events, then applying rules such as last-touch attribution and deduplication across networks. This creates a more neutral view of performance, though still limited by platform integrations and privacy frameworks like SKAdNetwork.
3. First-Party Data
First-party systems (billing, backend databases, product analytics) track what actually happens in your product: subscriptions, payments, renewals, and churn. This makes them the most accurate source of revenue truth, though they cannot reliably identify which marketing channel caused the conversion.
Why the Numbers Differ
Each system answers a different question:
-
Ad platforms: Which ads influenced users on this platform?
-
MMP: Which channel should receive attribution credit?
-
First-party data: Did the user actually generate revenue?
Because these perspectives are different, their numbers naturally diverge. Here's how they compare:
How Growth Teams Use Them Together
Instead of forcing dashboards to match, advanced teams use a measurement hierarchy:
-
First-party data → financial truth
-
MMP → channel attribution
-
Ad platforms → campaign optimization
When used this way, discrepancies stop being a problem and become part of a complete measurement system.
How to Reduce Mobile Ad Attribution Discrepancies (Practical Framework)
Completely eliminating attribution discrepancies is unrealistic. However, modern growth teams can significantly reduce attribution gaps by implementing a structured measurement framework.
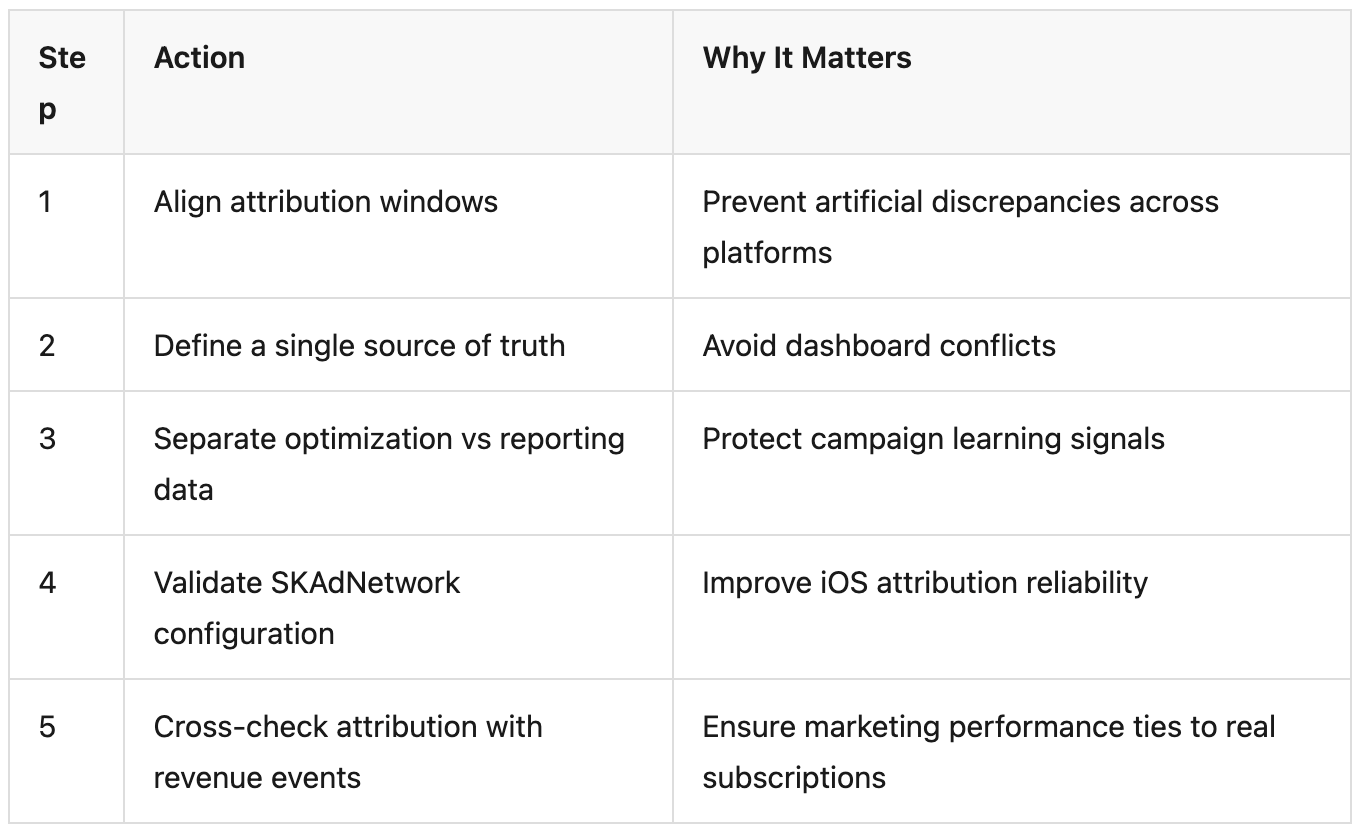
1. Align Attribution Windows Across Platforms
One of the easiest discrepancies to fix is attribution window mismatch. If different systems use different windows, conversions will naturally be counted differently. Recommended approaches:
-
Align click attribution windows across platforms
-
Limit view-through attribution where possible
-
Ensure MMP windows match major channel settings
2. Define a Clear Source of Truth
One of the biggest operational mistakes is allowing multiple dashboards to compete as the primary reporting source. Instead, growth teams should define data hierarchy rules:
-
First-party data → financial truth
-
MMP attribution → marketing performance comparison
-
Ad platform dashboards → campaign optimization
This ensures that MRR and subscription revenue remain the ultimate performance metric.
3. Separate Optimization Data From Reporting Data
Ad platforms require rich conversion signals to train their algorithms, but those signals are not always suitable for neutral performance analysis. Growth teams often solve this by splitting events into two layers:
-
Optimization signals: install, sign-up, trial start
-
Revenue evaluation signals: subscription purchase, renewal, revenue value
4. Validate SKAdNetwork Conversion Logic
For apps with significant iOS traffic, SKAdNetwork configuration is critical. Growth teams should review:
-
Conversion value mapping
-
Event prioritization
-
Postback interpretation logic
-
Campaign ID structure
When designing SKAN conversion values: prioritize high-value funnel events, avoid mapping too many low-impact events, and align conversion windows with subscription behavior.
5. Cross-Check Attribution With Subscription Events
Attribution performance must always be validated against actual revenue events: trial start, payment method added, subscription activation, renewal.
Routinely compare these three datasets:
-
Ad Platforms: Reported conversions
-
MMP: Attributed installs or trials
-
First-party system: Paid subscriptions
If attribution performance looks strong but subscription events remain weak, the issue is usually low-quality traffic, misconfigured conversion tracking, or inflated platform attribution.
Understanding the Subscription Attribution Funnel
For subscription apps, the distinction between optimization events and revenue events is especially important. Many UA teams make the mistake of optimizing for the wrong moment in the funnel.
The subscription funnel typically looks like this:
-
Install
-
Sign-Up
-
Trial Start ← Ad platforms typically optimize here
-
Payment Added
-
Subscribe ← Your business cares most about this
-
Renewal ← Long-term MRR health
When assessing attribution discrepancies for subscription apps, always validate that your MMP is tracking the full funnel — not just the top of it. The gap between trial starts (what ad platforms see) and actual subscription activations (what your billing system sees) is often where the biggest MRR leakage occurs.
Why Modern Growth Teams Go Beyond Attribution Dashboards
Attribution dashboards are helpful, but they often show only one layer of the growth picture. As marketing stacks grow more complex, teams typically rely on multiple tools:
-
Ad platform dashboards for campaign optimization
-
MMP dashboards for cross-channel attribution
-
Product analytics for user behavior
-
Billing systems for subscription revenue
Each tool answers a different question — and none of them alone connects the entire acquisition-to-revenue journey.
That's why more mature growth teams build a measurement layer that connects marketing signals with product events. The goal isn't to make all dashboards agree. It's to know which number to trust for which decision.
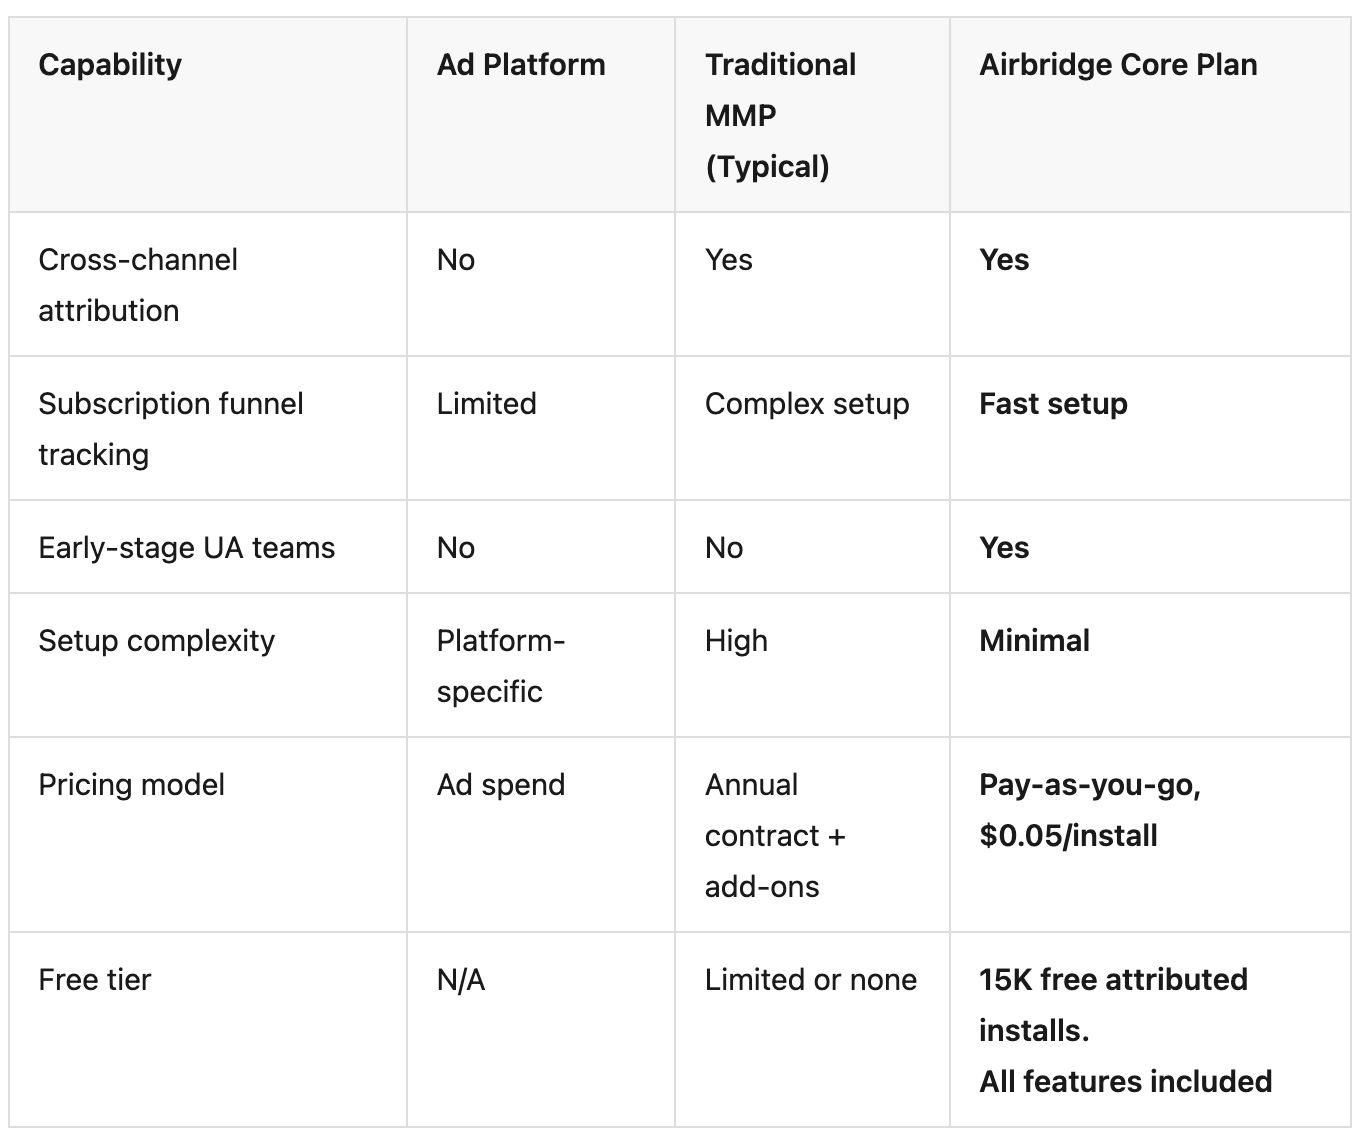
Connecting Paid UA to Subscription Revenue with Airbridge Core Plan
Most MMP solutions are built for mature growth teams with dedicated data engineers — complex event schemas, custom integrations, and weeks of setup. But early-stage subscription apps don't need that complexity.
They need one answer, fast:
"Are paid users converting into subscriptions, and which channels are driving those conversions?"
Airbridge Core Plan was designed specifically for small UA teams running subscription-based mobile apps in the US market. It provides fast, reliable attribution signals without requiring complex infrastructure or event schema design.
Core Plan supports attribution across the four major Self-Reporting Networks used by most subscription apps:
-
Meta Ads
-
Google Ads
-
Apple Search Ads
-
TikTok for Business
In addition to installs, Core Plan tracks the standard subscription funnel events that matter most: sign-up, trial start, subscribe, and order completion — giving you a direct line of sight from paid acquisition to actual subscription revenue.
Ready to connect your paid UA spend to actual subscription revenue?
Airbridge Core Plan is built for US-based subscription apps that need attribution signals without the complexity. Visit our waitlist page to see pricing, feature details, and how to get started.


Ready to transform your mobile growth?
Learn how Airbridge helps leading brands measure and optimize every touchpoint.