What Is an App Activation Metric? Definition, Benchmarks, and How to Define Yours
An activation metric is the specific event that best predicts whether a user will become a paying subscriber and stay one. It is not a signup, not an onboarding completion, and not a session count. It is the action that, when a user completes it, statistically separates future subscribers from future churners.
You had 10,000 downloads last month. A few hundred started trials. A fraction subscribed.
That gap between installs and revenue does not live in your ad account. It lives in the space between a user opening your app and experiencing something worth paying for. Most early-stage subscription apps are unable to define key metrics between downloads and actual activation, so they optimize the wrong signals and wonder why conversion stays flat.
The fix is not more traffic. It is knowing exactly which event inside your app separates users who will subscribe from users who will leave.
Key Takeaways
-
Tracking the wrong event is worse than tracking nothing. Optimizing for onboarding completion or session count creates false confidence while the actual activation gap widens undetected.
-
First value and core value are not the same thing. Most apps focus entirely on getting users to their first valuable moment. The habit that follows, which predicts renewal, is left unmeasured.
-
Top-performing apps are 4.5x better at conversion, not 4.5x better at acquisition. The P90 app reaches 8.5% download-to-paid by Day 35. The median earns 1.9%. The gap is largely explained by what happens in the first few sessions.
-
Category benchmarks diverge sharply. Travel app trialists convert at 48.7%, while the all-category median sits at 34.8%. Your activation metric must be defined for your category and your users, not copied from another app's playbook.
-
The 2x test separates real metrics from vanity metrics. If users who complete your activation event do not retain at least twice as well as those who do not, that event is not your activation metric.
The Download-to-Subscriber Gap Is Mostly an Activation Problem
When conversion is low, the instinct is to buy more installs or test new creatives. More traffic fed into a broken activation funnel produces proportionally more churn.
The real problem is earlier. Across 75,000+ subscription apps, the median download-to-paid conversion rate by Day 35 is 1.9%. Top-performing apps (P90) reach 8.5%: a 4.5x gap largely explained by what happens in the first few sessions, not by ad spend.
Timing data confirms how decisive those early sessions are. 82% of subscription trials start on Day 0. Users decide almost immediately whether they see enough value to continue. Apps that fail to deliver that value in the first session lose the majority of users before anyone ever reaches the paywall.
This is an activation failure. And it is invisible unless you are measuring the right event.
What an App Activation Metric Actually Measures
Activation is the moment a user crosses from "I installed this" to "I understand why this is worth paying for."
For a language-learning app, activation might be completing three lessons and forming a first sentence in the target language. For a fitness app, finishing a complete first workout. For a budgeting tool, seeing a personalized insight built from real account data.
The specific event differs by product. The standard does not: an app activation metric is the user behavior that most reliably predicts conversion to a paid subscription and long-term retention. Not the step you wish users would complete. The step that, empirically, separates subscribers from churners.
Real example: Duolingo.
What the data showed: Users who completed lessons on consecutive days retained at dramatically higher rates than users who completed the same total lesson count in a single sitting. Five lessons in one evening looked like strong engagement in aggregate. Returning on Day 2 and Day 3 was the real activation signal. Duolingo's engineering team reported that 7-day streak users were 2.4x more likely to continue using the app, with streak improvements driving a 21% increase in current-day user retention and a 3.3% lift in Day-14 retention.
What Duolingo did: The team rebuilt its onboarding and push notification system to drive users toward a first multi-day streak, as documented in Lenny's Newsletter. The redesign was not about adding features. It was about changing which behavior users completed first.
The takeaway: Activation is not the completion of an onboarding checklist. It is the behavior that signals a user has started building a routine.
Consider a common scenario: a fitness app with 90%+ onboarding completion on both iOS and Android still loses most users by Day 2. The onboarding is short and easy, but users never reach the feature that delivers real value. Completion looks healthy. Activation is broken.
Want to see how App activation metric works with your data?
Get hands-on with Airbridge and see real results.
Try It Free →Two Layers of Activation Every Subscription App Needs to Track
Activation is rarely a single moment. It has two distinct layers, and confusing them is where most measurement errors originate.
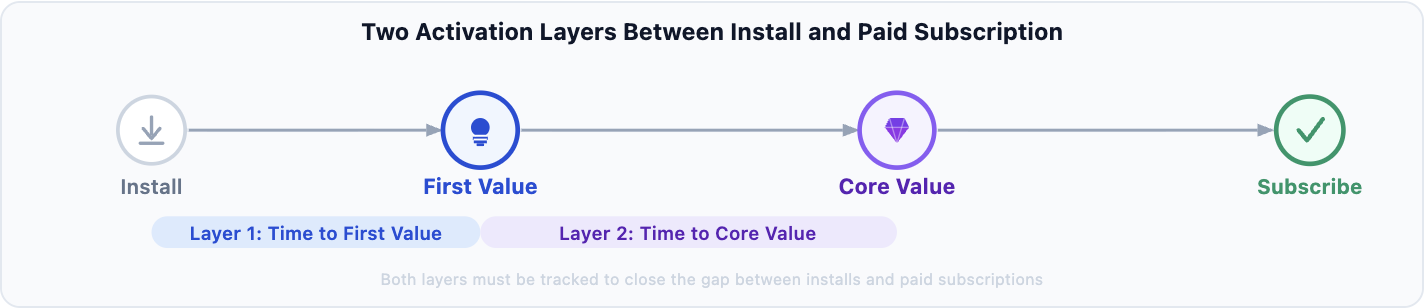
1. Time to First Value (TTFV)
TTFV is when a user perceives and experiences the product's core promise for the first time. It is a small moment, but the steepest user drop-off happens right here.
44.5% of all subscription purchases happen on Day 0. Users who do not see value fast rarely return. First value does not mean completing a setup checklist. It means encountering the specific thing that makes your product feel useful or worth continuing.
Real Example: Meditation Apps
The TTFV signal: For apps like Headspace, product analysts have noted that completing a first full session is the sharpest TTFV signal available. Users who finish even a three-minute guided session show meaningfully higher trial start rates than those who drop mid-way through the intro setup.
The key insight: The session does not need to be long. It needs to be completed. That moment of following through is what separates users who experience the product from those who merely open it.
Applies across categories: For a finance tool, TTFV might be seeing a budget category populated with real account data for the first time. The specific action differs by product. The principle is the same: value must be felt before users will pay for it.
If users are not reaching this moment, the rest of the funnel rarely gets a chance to matter. They have already left.
2. Time to Core Value
Core value is when the product stops being a new thing to try and becomes a pattern in a user's routine. This layer is one of the strongest predictors of long-term LTV and first-renewal rates you can measure.
A wellness app might define core value as completing sessions on three separate days in the first week. A productivity tool might define it as completing a project workflow end to end. A language-learning app might define it as reaching the 30-word recognition threshold.
Core value almost never happens in the first session. It requires users to return.
Most apps optimize heavily for TTFV and barely track core value. This is why many apps report solid early engagement but poor first-renewal rates: the product is getting users to first value but not to the habit that actually predicts subscription retention.
How to Define Your Subscription App Activation Event
1. Start with retention curve comparisons
Pull cohort data for users who performed different actions in their first 7 days. Compare retention curves for users who completed Action A versus those who did not. You are looking for sustained divergence that holds over weeks, not a short-term bump that fades after 14 days.
The action that produces a consistently higher retention curve is your activation signal. Divergence that converges by Week 3 signals an engagement step, not a true activation signal.
2. Apply the 2x retention test
A true activation metric passes a simple test: users who hit the milestone retain at significantly higher rates than those who do not. Research across subscription apps and SaaS products consistently shows the threshold is at least 2x retention among activated users versus non-activated users (Lenny's Newsletter).
If users who complete your candidate event do not retain at 2x+ the rate of non-completers, keep looking. The event may correlate with good users, but it is not causing activation.
3. Validate across segments and channels
Check whether the activation signal holds across iOS and Android, paid and organic, and multiple cohorts. A metric that works for organic users but disappears for paid traffic likely reflects that one channel attracts higher-intent users, not that your activation event is working universally.
When running channel-level validation, the attribution window you apply will also affect which sessions get credited to which campaigns. Both the event and the measurement window need to be consistent across segments.
Segment out free users when running this analysis. Free-tier engagement routinely inflates activation metrics while paid cohort quality stays poor underneath.
4. Set a threshold, not just a binary
For many apps, how much of the core experience a user completes predicts outcomes better than whether they completed any of it. In one reported case, a fitness app found that users who completed at least two workouts during trial retained at dramatically higher rates than one-workout users. The two-workout threshold was the real activation metric, not "completed a workout."
When you count something matters as much as what you count.
Activation Benchmarks by App Category
No single activation rate applies across all subscription apps. These figures give a baseline to calibrate your own expectations.
| Category | Trial Start Rate | Trial-to-Paid | What This Tells You |
|---|---|---|---|
| Travel | N/A | 48.7% | Trialists have strong purchase intent; they are researching, not browsing |
| Media and Entertainment | N/A | 43.8% | Content-led apps convert well once users sample the library |
| Health and Fitness | 7.8% | 39.9% | Strong overall funnel; yearly plans dominate at 68% of subscriptions |
| Business | 8.9% | N/A | Highest trial adoption rate; professional users trial with clear intent |
| All Categories | 6.2% (median) | 34.8% (median) | Broad baseline for calibrating your own targets |
Source: RevenueCat State of Subscription Apps 2025 (75,000+ apps, $10B+ revenue)
A useful signal from the trial-length data: subscription apps with longer trial windows (17-32 days) reach a median trial-to-paid conversion of 45.7%, compared to 26.8% for short-window trials. The longer window gives users time to reach core value. That downstream improvement is what well-designed activation infrastructure produces.
Generic SaaS activation rates (often cited at a median around 25-30%, up to 36% for SaaS-specific averages) are not useful benchmarks for mobile subscription apps. Category, paywall model, and trial length all change what a healthy rate looks like for your product.
Activation Is the Bridge Between Installs and Revenue
When you define an activation metric backed by retention data, the diagnostic question changes. It shifts from "we need more installs" to "users are reaching first value but not core value, and that gap explains why first-renewal rates are soft."
That specificity drives the right intervention: shorten the path to first value, give users enough runway to build the habit that predicts retention, and track both layers with events that fire at the right moments.
Most self-attributing networks (Meta, Google, Apple Search Ads, and TikTok) optimize toward the top of your funnel. Connecting those channels to actual activation events is where the measurement gap lives for most early-stage apps.
Once you have both activation layers defined, the next step is connecting them to acquisition channels. Most teams run activation analysis in product analytics and channel ROI analysis in ad dashboards as separate workstreams. The gap between those two tools is where budget decisions go wrong: channels that look efficient on cost-per-install are often the same ones producing users who never activate.


Ready to transform your mobile growth?
Learn how Airbridge helps leading brands measure and optimize every touchpoint.