Why Your Subscription App Gets Installs but Not Paid Subscribers

Your download count is climbing. Ads are running. Users are installing. But your app install growth is not translating into subscription revenue.
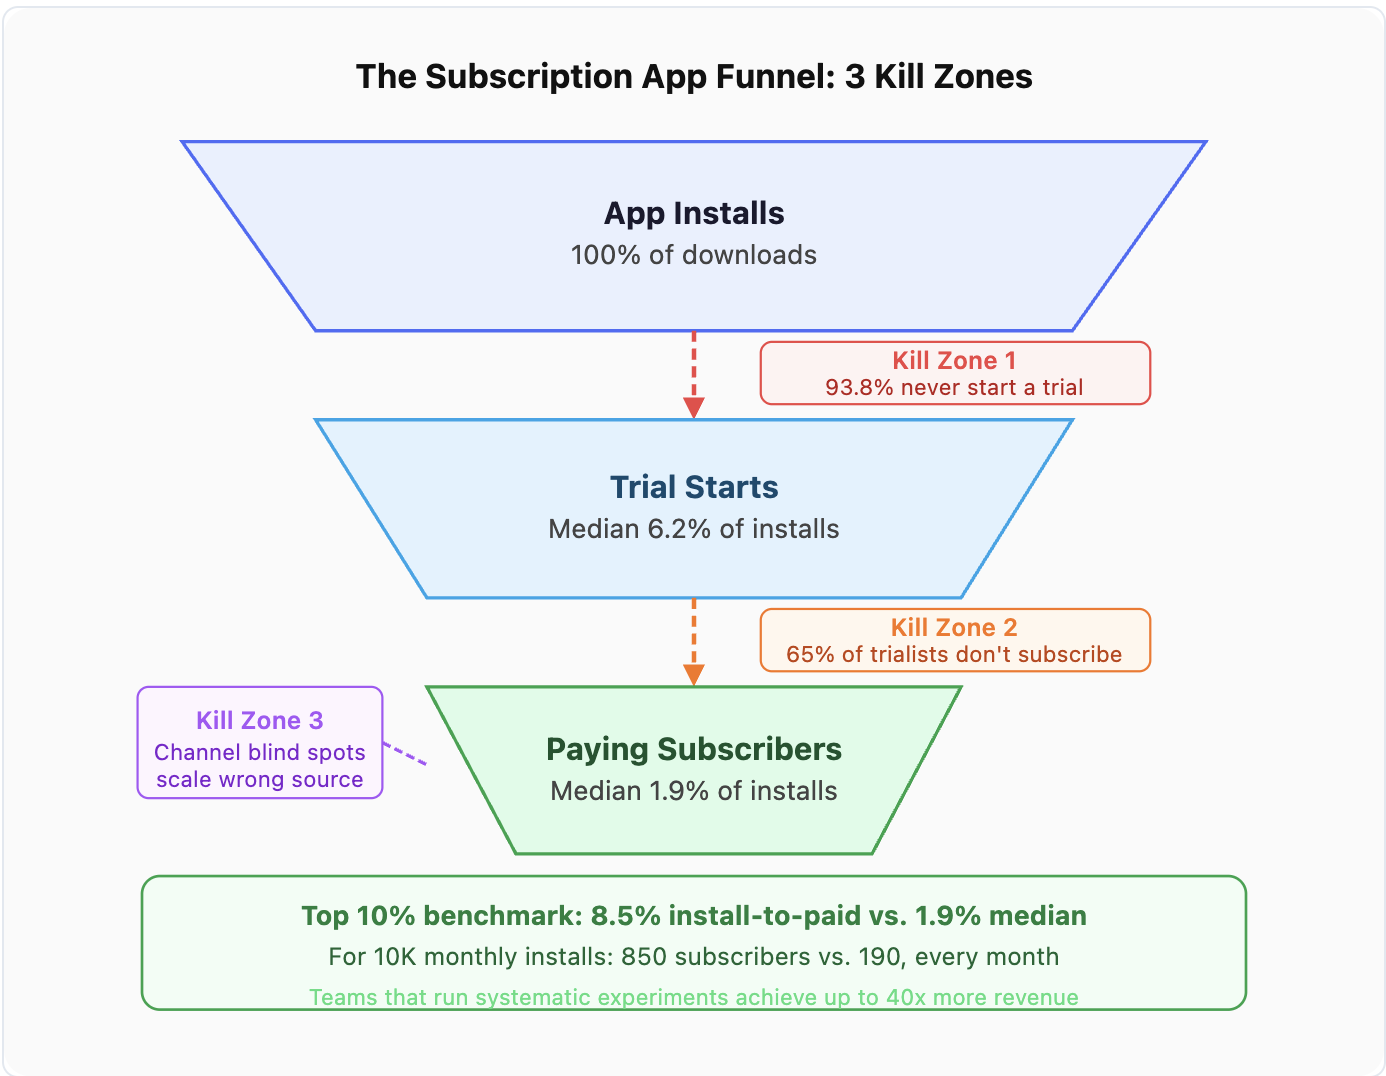
This is one of the most common growth problems in subscription apps, and one of the most misdiagnosed. The question of why app users do not convert to paid subscribers has a structural answer: it lives inside the funnel, not in the ad budget. Most teams respond by buying more traffic. The actual problem is structural, living inside the funnel itself. The median subscription app converts just 1.9% of downloads into paying subscribers within 35 days, and top-performing apps hit 8.5% (RevenueCat State of Subscription Apps 2025). That 4.5x gap is not explained by ad spend or product quality. It is explained by funnel discipline: knowing exactly where users drop, why they drop, and running focused experiments to fix each stage.
Key Takeaways
-
Install-to-trial below 6.2%? The problem is your Day 0 onboarding and paywall, not traffic volume.
-
Trial-to-paid below 34.8%? Trial length and the core activation action move the number more than paywall copy or pricing.
-
82% of trial conversions happen on Day 0. Optimizing later in the funnel without fixing the first session produces marginal results.
-
37.2% of cancellations cite "not enough usage." Fixing trial engagement addresses both the conversion and the retention problem simultaneously.
-
The difference between 1.9% median and 8.5% P90 install-to-paid is not product quality. It is structural funnel discipline that compounds with every install.
What Is the Subscription App Conversion Funnel? 3 Stages, 3 Leak Points
Before diagnosing what is broken, it helps to have a shared model of what a healthy funnel looks like.
Every subscription app runs on the same three-stage funnel: install to trial start, trial start to paid subscriber, and install to paid subscriber as the combined output. Each stage leaks differently, responds to different fixes, and requires different data to diagnose.
1. The three-stage model every subscription app shares
1) Install to trial
The user downloads the app, goes through onboarding, hits the paywall, and decides whether to start a free trial. This is the first real commitment ask. Most apps lose the majority of their subscription potential here, not during the trial, but before it starts.
2) Trial to paid
The user begins a trial and either converts to a paying subscription when the trial ends or cancels. This is where product value needs to show up clearly and fast enough to justify payment.
3) Install to paid
The product of both stages above: the percentage of app installs that become paying subscribers. This is your actual acquisition conversion rate, the number that should sit alongside cost per install (CPI) in any channel performance review.
Each stage has its own failure mode. Treating all three as one undifferentiated "conversion problem" is one of the most expensive mistakes subscription app teams make.
2. Subscription app conversion benchmarks: where the real drops happen
| Metric | Median | High Performer |
|---|---|---|
| Install to trial | 6.2% | 20.3% (P90) |
| Trial to paid | 34.8% | 51.5%+ (top quartile) |
| Install to paid (D35) | 1.9% | 8.5% (P90) |
Sources: Adapty State of In-App Subscriptions 2026 (16,000+ apps, $3B subscription revenue) and RevenueCat State of Subscription Apps 2025 (75,000+ apps, $10B+ revenue).
Reading these numbers carefully: at the median, 94% of app installs never start a trial. Of the 6.2% who do start a trial, 65% still do not subscribe. The funnel leaks at both stages, and fixing only one produces incremental improvement at best.
The P90 benchmark tells you the ceiling. For an app receiving 10,000 installs per month, the difference between median and P90 performance is 190 paying subscribers vs. 850, every month. The compounding effect on lifetime value (LTV) is why top apps invest in funnel optimization before scaling paid acquisition.
Kill Zone 1: Why 94% of App Installs Never Start a Free Trial
The install-to-trial stage is where most apps lose the most users, and where most teams are not looking.
82% of all trial starts happen on Day 0 (SOSA 2025), during the same session as the install. By Day 2, the probability that any given user will ever start a trial drops close to zero. You do not have days or weeks to convert an app install into a trial. You have one session.
1. Four reasons 94% of installs never reach a trial
1) Weak value communication
Users hit the paywall before they understand what they are paying for. The onboarding showed features rather than outcomes. A fitness app that demonstrates its library before showing a user their personalized goal misses the most persuasive moment in the entire funnel.
2) Too many screens before the paywall
Every extra screen between install and paywall that does not build toward the value promise is a drop-off point. Apps that streamline onboarding to the personalization data they actually need consistently outperform those that collect extensive information before delivering value.
3) Mismatched user intent
The ad creative promised one thing and the app delivered another. A user who clicked a "lose weight fast" ad and arrived at a general wellness app did not get what they were looking for. This download never had a realistic conversion probability.
4) Wrong paywall placement
Some apps place the paywall before users understand value. Others place it so late that users have already decided the app is not for them. Paywall timing is one of the highest-leverage experiments any subscription app can run.
2. How to Fix It: Personalize the Paywall and Shorten the Path to Trial
Apps with the highest trial start rates share a consistent pattern: the onboarding collects the user's specific goal, and the paywall reflects that goal directly. Flo Health, for example, collects health goals during onboarding and surfaces a personalized plan on the paywall, converting a generic subscription screen into a specific health commitment.
1) Shorten onboarding to the minimum needed to personalize the paywall
Count the screens between install and paywall. Every screen that does not directly contribute to the value promise on the paywall is a drop-off point. This is not a "fewer screens is always better" rule: Noom uses 100+ onboarding screens to build an exceptionally personalized plan and converts well because of it. The goal is to eliminate screens that do not contribute to the value promise, not to minimize total count.
2) Replace generic CTA copy with the user's stated goal
"Start your 7-day free trial" converts worse than "Start your plan to [specific goal the user just stated]." Apps that A/B test this approach consistently see a measurable lift in trial starts because it connects the cost to a concrete outcome the user already said they want.
3) Audit your ad-to-app message match
The top 5 creatives driving your highest install volume should make a promise that matches the first screen users see after install. Any gap means users arrive with misaligned expectations and a conversion probability close to zero. Fixing message match before scaling spend is one of the highest-ROI actions at this stage.
4) Test a hard paywall if you currently run freemium
Hard paywalls convert at a median of 12.1% install-to-paid, compared to 2.2% for freemium, a 5.5x difference driven by purchase intent filtering (SOSA 2025). Hard paywalls work when the value promise is strong and the onboarding has earned the ask. Explore our subscription app paywall guide for specific A/B tests to run at this stage.
Want to see how Subscription app conversion works with your data?
Get hands-on with Airbridge and see real results.
Try It Free →Kill Zone 2: Why Two-Thirds of Trial Users Never Become Paid Subscribers
If a user has started a trial, they have passed the hardest gate. But the median trial-to-paid rate is 34.8%. Roughly two out of three trial starters still do not subscribe. Most teams try to fix this with push notification sequences. Those help at the margin. The bigger levers are trial length and early activation.
1. Why Two Out of Three Trial Users Still Do Not Subscribe
Two root causes account for most of the gap between trial starts and paid conversions.
1) Trial length cuts the window short before habits can form
Apps with 17-32 day trials convert at a median of 45.7% (Adapty 2026). Apps with 3-7 day trials convert at 26.8%. A short trial ends before most users have built a routine around the app. They hit the paywall with low usage, no formed habit, and no compelling reason to pay.
2) Users who do not engage during the trial do not convert after it
Among Google Play subscribers who cancel, "not enough usage" is cited by 37.2%, more than "cost related" at 34.6% (SOSA 2025). The same pattern applies to non-converters: a user who opens the app twice during a 7-day trial has not experienced the value that justifies a subscription. No paywall copy or pricing change fixes that.
Both problems share the same root: the trial ends before the user has experienced enough of the app to make payment feel like a natural next step.
2. How to Fix It: Extend the Trial and Drive the Core Activation Action
1) Extend your trial if it is 7 days or shorter
Test 14 days before changing anything else. The 19-percentage-point conversion gap between long and short trials exists because longer trials give users time to integrate the app into their behavior. By the time the paywall arrives, they are renewing a habit, not committing to something new. If your trial-to-paid conversion rate is below 30% and your trial is short, this is the experiment to run first.
2) Find the action that predicts conversion
Analyze what paying subscribers did during their trial that non-converters did not. For a journaling app it might be completing three entries. For a fitness app, finishing the first full workout. For Duolingo, it is a 5-day streak. This is your core activation action, and it is worth more attention than any paywall copy test.
3) Build Day 0 and Day 1 onboarding to reach that action before Day 3
Users who complete the activation action on Day 1 convert at materially higher rates than those who do not. Every early session interaction should move users toward that moment, not around it.
4) Add a behavioral nudge for users who miss it
If a user has not completed the activation action by Day 2, they are unlikely to convert without intervention. A push notification or in-app prompt that offers to help them complete the action, rather than just counting down the trial, will typically outperform urgency messaging.
Kill Zone 3: How Channel Mix Silently Kills Subscription Conversion
This is the kill zone that is invisible without the right data, and the one that causes the most wasted ad spend.
Your install-to-subscriber rate is an average. It mixes together high-intent users from Apple Search Ads keyword targeting, broad-audience users from Meta prospecting, and organic users who found the app on their own. That average can look acceptable while hiding a serious structural problem: some channels are producing subscribers at 5-6% conversion and others at under 1%. If you are scaling the low-converting channel because the cost per install is lower, you are spending more money to produce fewer subscribers.
1. Why your cheapest app install source might be your worst subscriber source
For example: a Meta broad-audience campaign delivers 5,000 installs at $2 CPI. An Apple Search Ads campaign targeting high-intent searches delivers 800 installs at $7 CPI. On cost per install alone, Meta appears 3.5x more efficient.
But if Meta installs convert to paid subscribers at 1.5% and ASA installs convert at 5.5%, the cost per subscriber from Meta is $133. From ASA, it is $127. The "cheaper" channel is producing the more expensive result. Scale that signal long enough and you can spend 50% more to produce 30% fewer paying subscribers.
The question that matters is not "which channel gives me the most installs?" It is "which channel gives me subscribers?" These are different questions with different answers, and you cannot answer the second without connecting ad spend data to subscription revenue data at the channel level.
2. How to Fix It: Replace CPI with Cost per Subscriber as Your Channel Metric
Fixing this kill zone requires replacing the metric you are optimizing for.
1) Connect three data streams
Install source by channel and campaign, subscription events (trial start, conversion, cancellation) tied to the original install, and cost data from each platform. When these are joined, you can compute install-to-trial rate by channel, trial-to-paid rate by channel, and cost per subscriber by channel.
2) Rank channels by cost per subscriber, not CPI
Cost per install is a proxy. Cost per subscriber is ad spend divided by subscribers attributed to that channel. The rankings often flip when you switch metrics. A $2 CPI channel converting at 1.5% to paid has a higher cost per subscriber than a $7 CPI channel converting at 5.5%. The blended average hides this entirely.
3) Reallocate toward your lowest CPSub channels
Once you have the ranking, shift spend from high-CPSub channels toward low-CPSub channels, even where the CPI is higher. This reallocation alone can meaningfully reduce blended cost per subscriber without changing a single creative or bid strategy.
The Fix Starts with Knowing Which Stage Is Leaking
App installs measure interest. Subscribers measure delivered value. If the gap between them is growing, the answer is not more ad spend. It is identifying which of the three kill zones is losing the most revenue and running a focused experiment there.
Measure your install-to-trial rate against the 6.2% median. Measure your trial-to-paid rate against 34.8%. Break your install-to-paid rate out by channel. The largest absolute gap points to the highest-value experiment. Most subscription apps that close the install-to-subscriber gap do not do it by finding a new channel or shipping a new feature. They do it by stopping leaks they did not know existed.
Ready to transform your mobile growth?
Learn how Airbridge helps leading brands measure and optimize every touchpoint.