ROAS for Subscription Apps: How to Read D7, D30, and D60 Numbers

For subscription apps, ROAS is never a single, final figure. It grows every month as subscribers renew, and the time window you choose to measure it (D7, D30, or D60) changes everything.
If you have seen a figure in your Meta or Google dashboard and had no idea whether it was good or bad for your subscription model, this guide explains exactly what you are looking at and how to act on it.
Key Takeaways
-
Time windows define the number. D7, D30, and D60 tell different stories about the same campaign. Choosing the wrong window leads to cutting campaigns that are actually working.
-
D30 is the standard decision metric. Most subscription app marketers use 30-day cohort data as their primary signal, with D7 as an early indicator only.
-
A result below 1.0 is not automatically bad. If subscribers renew at healthy rates, you may recover your customer acquisition cost by month 3 or 6 and still be profitable.
-
Blended numbers hide the real story. A Meta campaign at 0.8x and a TikTok campaign at 0.15x average to 0.45x, hiding your best opportunity.
-
ROAS makes most sense alongside LTV. With a median Year 1 LTV of $27.21 in Health and Fitness, a D30 result of 0.3x can still be profitable.
Why ROAS Works Differently in Subscription Apps
When an e-commerce brand tracks this metric, revenue is immediate. A user clicks an ad, buys a $60 product, and that revenue is counted the same day.
Subscription apps do not work that way.
1. Revenue arrives in monthly installments
A user who installs your app after clicking a Meta ad might start a free trial on Day 0, convert to a paid plan on Day 7, and then pay $9.99 per month for the next 12 months. From the campaign perspective, that user generates $119.88 in total revenue, but it arrives over a full year.
On Day 1, the revenue from that install is zero. By Day 30, it might be $9.99. By Day 365, it might be $119.88, or zero if they churned after month two.
This is why the metric is always a moving number for subscription apps. The question is never "what is my ROAS." It is "what is my D30 result" or "what is my D60 result."
2. The time window changes what you are measuring
Two marketers can look at the same campaign and reach opposite conclusions depending on which window they choose.
| Time Window | Revenue Counted | What It Tells You |
|---|---|---|
| D7 | First 7 days of subscription revenue | Early signal only. Too short to capture trial-to-paid conversion for most apps |
| D30 | First 30 days of subscription revenue | Core decision metric for monthly plan apps |
| D60 | First 60 days of subscription revenue | Captures early renewals. More meaningful for longer trial periods |
| D90+ | First 90+ days of subscription revenue | Reflects true payback for high-LTV categories |
For apps with monthly plans, D30 is typically the first window that means something actionable. For apps with annual plans, even D30 understates long-term value significantly, since most revenue from an annual subscriber comes from the renewal in month 12, not the first payment.
How to Calculate ROAS for Your Subscription App
ROAS (Return on Ad Spend) = Revenue from ad-attributed subscribers divided by Ad Spend.
If you spent $2,000 on Meta ads in January, and the subscribers acquired from that campaign generated $800 in subscription revenue within 30 days, your D30 ROAS is 0.4 (40%). You spent $2,000 and recovered $800 by day 30.
That sounds low. But if those same subscribers generate $1,500 by day 60, your D60 ROAS is 0.75, and you are approaching breakeven. Whether that pace works depends on your cash runway and predicted LTV.
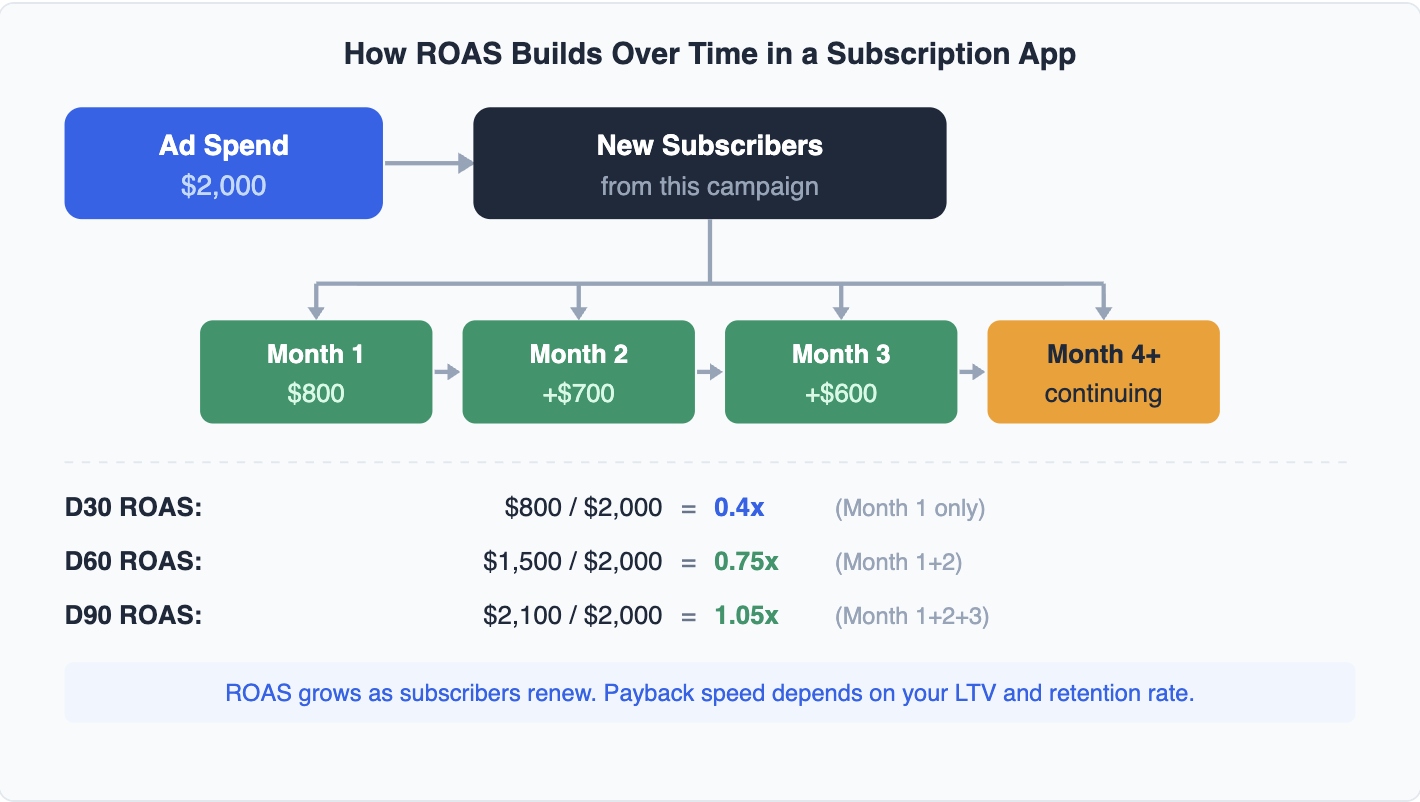
Illustrative example. Revenue figures are hypothetical to demonstrate how D30, D60, and D90 ROAS change as subscribers renew.
1. Use cohort revenue, not total app revenue
One of the most common mistakes is dividing total app revenue by total ad spend. This produces a blended number that mixes organic users, returning subscribers, and newly acquired paid installs.
To get accurate cohort-level data, you need revenue generated specifically by users acquired from a specific campaign, measured over a specific time window. Actuals tell you cash flow. Cohorts tell you marketing performance. For optimizing ad spend, always use cohorts.
2. Count subscription revenue only
If your app includes both subscriptions and one-time purchases, separate them. A subscriber who pays $9.99/month looks very different from a user who makes a $1.99 in-app purchase and never returns. Subscription-only data tells you whether your campaigns are generating paying subscribers. Mixing in consumables distorts the signal.
3. Account for platform commissions
These calculations use gross subscription revenue. Apple takes 30% in Year 1 (dropping to 15% from Year 2 onward), so net ROAS is lower. A D30 gross ROAS of 0.4x is a net ROAS of roughly 0.28x on iOS. Google Play charges 15% from Year 1. When comparing iOS and Android ROAS performance, always use the same revenue basis (gross or net) to avoid misleading comparisons.
Want to see how ROAS for subscription apps works with your data?
Get hands-on with Airbridge and see real results.
Try It Free →ROAS Benchmarks: What the Data Actually Shows
There is no universal target because this metric depends on both revenue per install and cost per install, and CPI varies sharply across categories and platforms.
What you can benchmark directly is revenue per install (RPI) at each time window. Analyzing 75,000+ subscription apps, the data shows:
| Time Window | Median RPI (All Categories) | Health and Fitness Median | Health and Fitness P90 |
|---|---|---|---|
| Day 14 RPI | $0.20 | — | — |
| Day 60 RPI | $0.31 | $0.63 | $4.19 |
| Year 1 LTV per Payer | $16.27 | $27.21 | $86.35 |
Platform and geography matter significantly. App Store D60 RPI averages $0.38 globally vs $0.14 on Google Play, a 2.7x gap. In North America, D60 RPI reaches $0.57 at the median, compared to $0.10 in India and Southeast Asia.
Your result at any window = RPI divided by CPI.
For Health and Fitness apps on iOS globally, the median CPI is $5.78. Using median figures, D60 ROAS = $0.63 / $5.78 = 0.11x. You have recovered 11 cents per ad dollar by Day 60. On Android in North America, where the median Health and Fitness CPI is $3.06, the same D60 RPI gives 0.21x.
These numbers show why reading the metric at only one window without knowing your CPI is hard to interpret. An app spending $0.80 per install with $0.31 D60 RPI has D60 ROAS of 0.39x. An app spending $5 per install with the same RPI has D60 ROAS of 0.06x. Both might be healthy or struggling, depending on their LTV trajectory.
One more number to anchor your expectations: the cost per paying user (CPPU) runs 4-5x higher than cost per install. If your CPI is $5, plan to spend $20-25 to acquire one paying subscriber. Your calculations need to account for that full funnel cost, not just the install.
For a deeper look at the metrics that connect to this calculation, see our subscription app metrics guide.
How to Read ROAS by Channel
Your app-level number is an average. It blends your strongest campaigns with your weakest. The actionable work is breaking the data down by channel, campaign, and creative.
A Meta campaign might show D30 ROAS of 0.8x while your Google campaign shows 0.3x. Same app. Same time period. Opposite conclusions about where to increase budget. Self-Attributing Networks like Meta, Google, and TikTok each report their own attribution, so the number in each platform dashboard does not add up to a unified view of your subscription revenue.
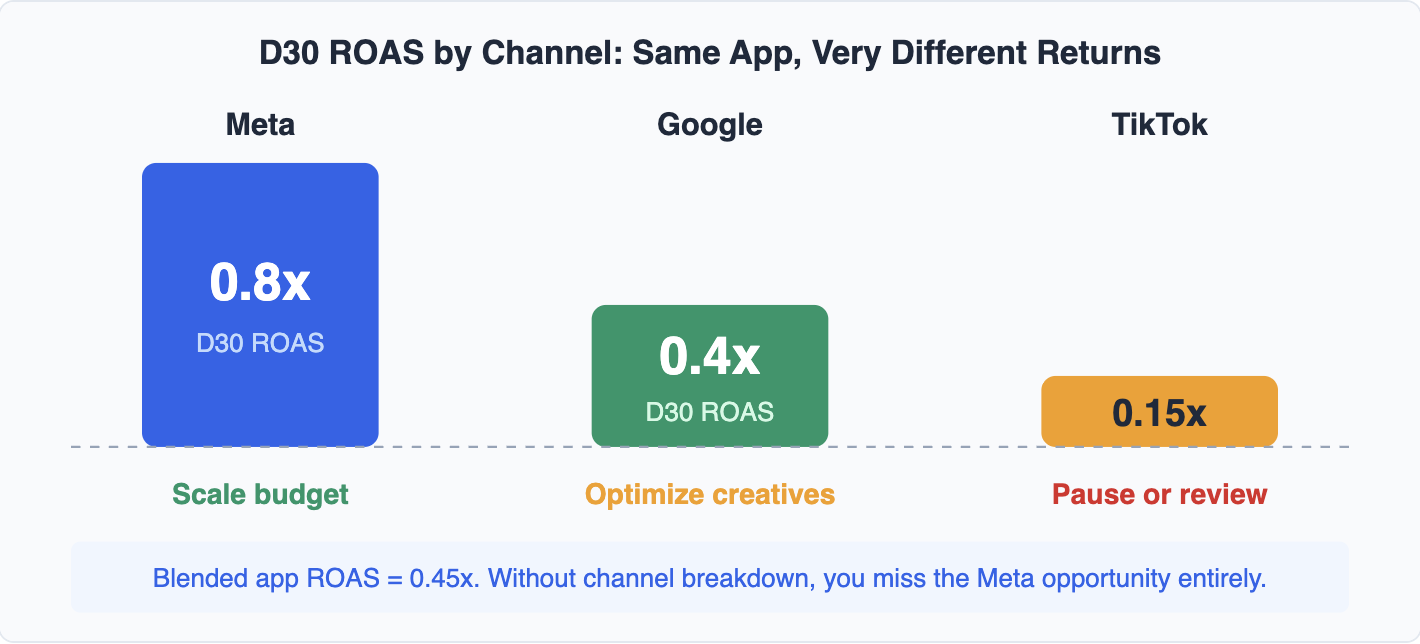
This pattern is common for Health and Fitness apps running Meta prospecting alongside Google App campaigns. The gap between top and bottom channels often exceeds 2x.
Connecting ad spend data to actual billing events like trial start, subscription, and renewal requires linking your campaign data to your revenue data. Without that connection, you are making budget decisions based on platform-reported numbers that each platform inflates in its own favor.
If you are running paid campaigns on Meta, Google, or TikTok and want to see which channels are actually driving paying subscribers, Airbridge Core Plan connects your ad spend to subscription revenue by source. You can see the full path from install to renewal, broken down by channel and campaign. Start free with 15K installs included.
For more on scaling paid spend once you can read channel-level data, see our guide on how to improve D30 ROAS for subscription apps.
ROAS Is Just the Starting Point
The metric tells you whether an ad campaign is generating subscription revenue relative to what you spent. It does not tell you whether those subscribers will stay for three months or three years. It does not tell you whether the channel you are scaling is actually responsible for the lift, or whether those users would have found you anyway.
That is why the teams who use this data well always read it alongside LTV and cohort retention data. The early number is a signal. Unit economics are the verdict.
Ready to transform your mobile growth?
Learn how Airbridge helps leading brands measure and optimize every touchpoint.