What Should a Small App Team Track Before Scaling App Ads?

Most app teams know they should track something before scaling paid ads. The problem is nobody agrees on what "ready" actually looks like.
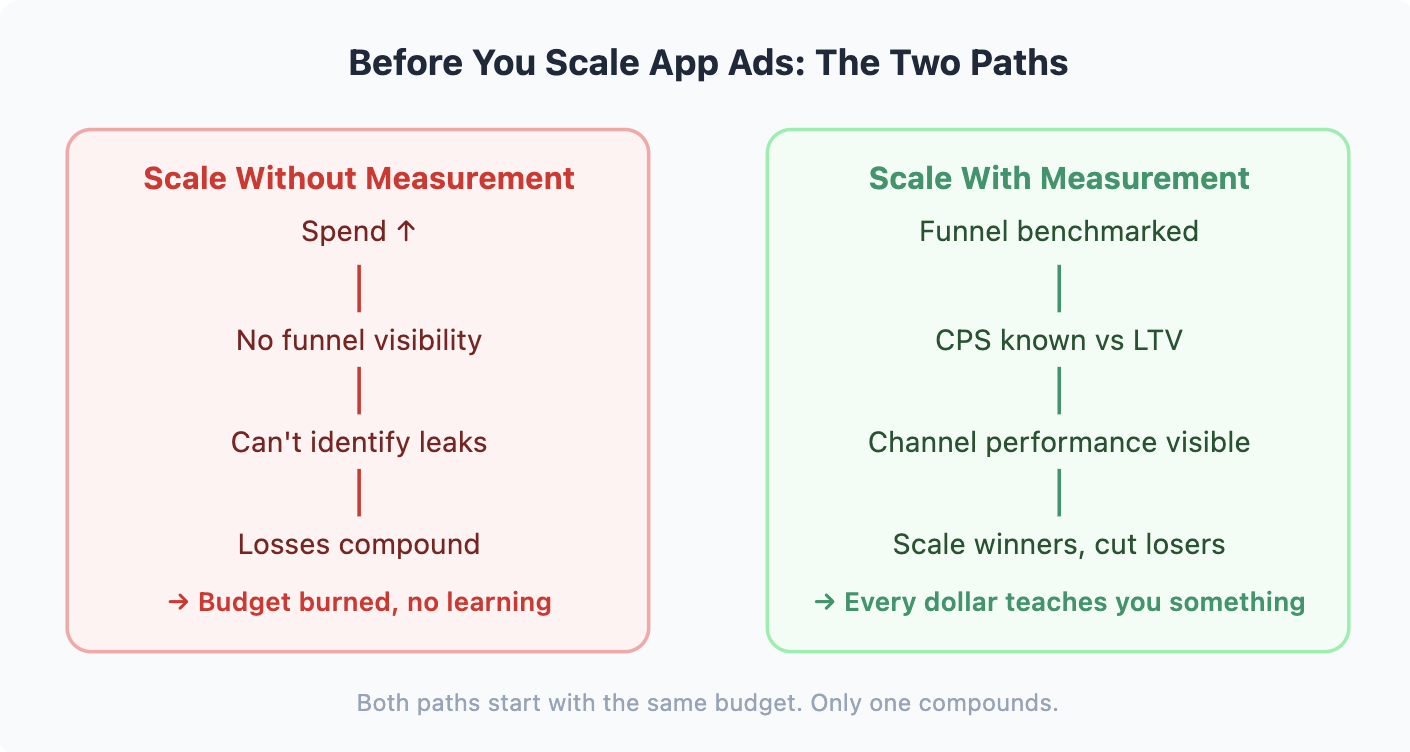
There is no official standard, no universal green-light checklist. So teams scale their app ads anyway, and discover too late that they were spending on a funnel that was never going to convert.
Key Takeaways
-
Trial-to-paid conversion is your most critical pre-scale metric. The median across 75,000+ subscription apps is 34.8%, and the top quartile starts at 51.5%. Know where you stand before committing more budget.
-
Customer means paying user, not installer or trial starter. Every unit economics calculation starts from this definition. LTV must exceed CPS with enough margin to sustain growth — scaling when that math is negative makes losses larger.
-
Trial design matters as much as traffic volume. Apps with trials lasting 17-32 days convert at a median of 45.7%, compared to 26.8% for shorter trials. Optimize your trial before scaling your ads.
-
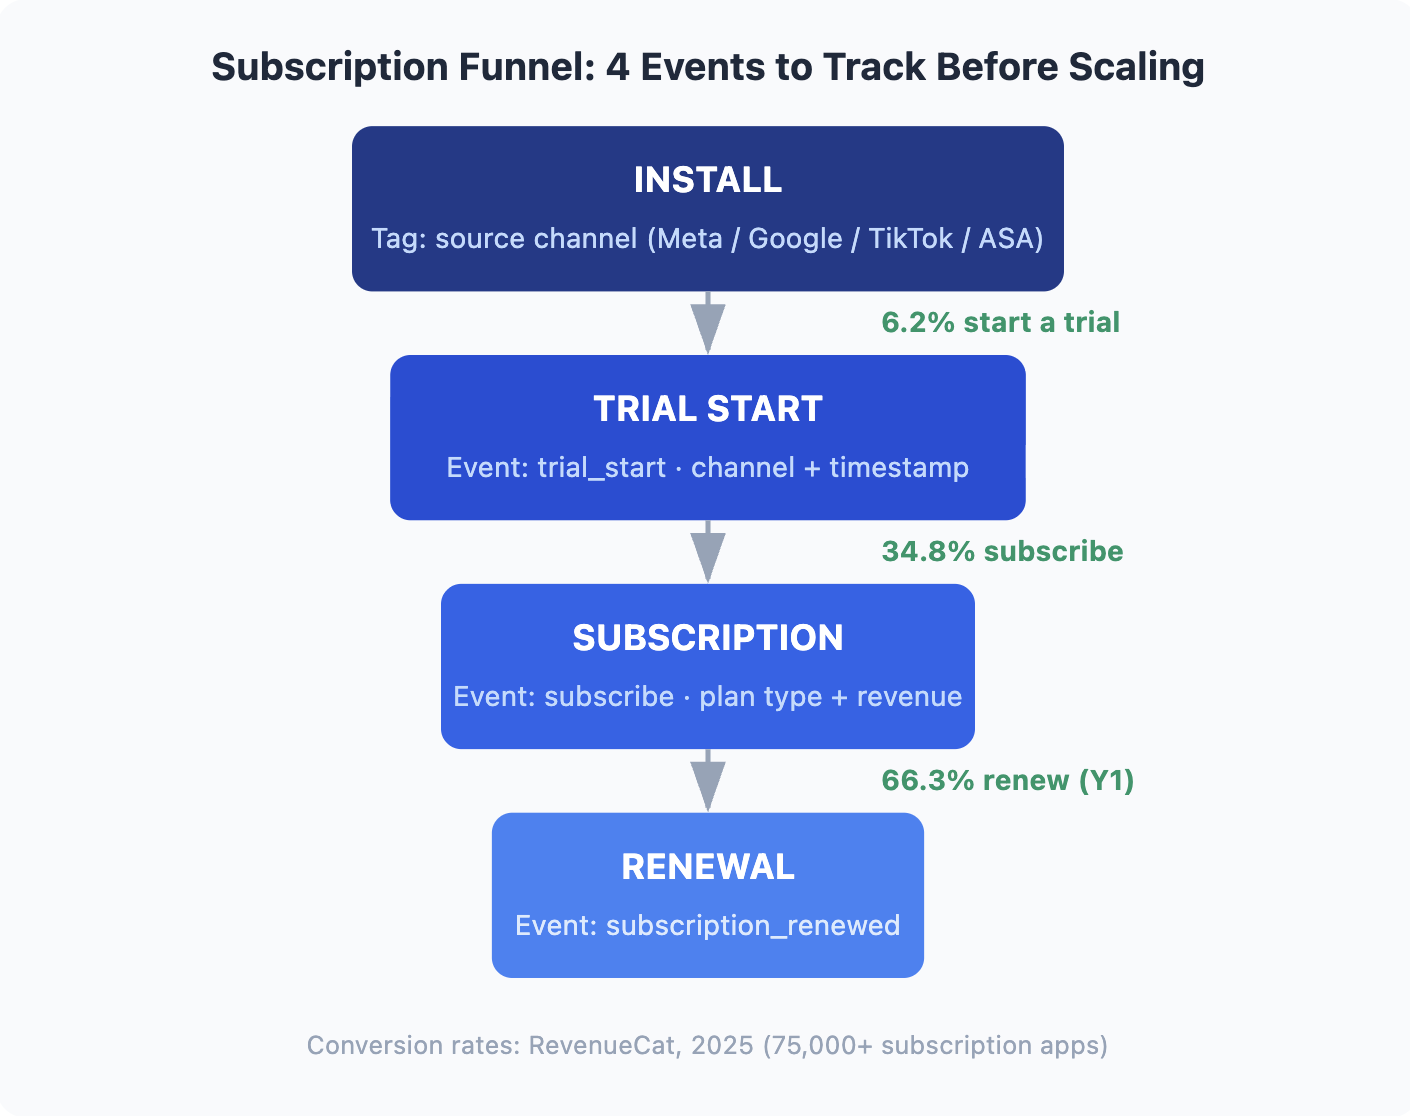
Instrument four funnel events before any paid ad goes live. Without install, trial start, subscription, and renewal events tracked back to your ad platform, you cannot calculate CPS or compare channels.
-
Benchmarks exist. Industry data gives you clear targets to measure against before committing serious budget to app ads.
Why Teams Scale App Ads Too Early
Scaling paid ads on an unmeasured funnel is the fastest way to burn budget without learning anything useful.
The math is clear: if your cost per subscription exceeds what a subscriber is worth over 60 days, every dollar added to your app ads budget is a dollar lost. Without knowing your cost per subscription, you are guessing at the number that determines whether your business works.
56% of new apps earn less than $1,000 in their first year (Adapty, 2026). Not because they failed to run ads, but because they scaled spend before proving the funnel. The apps that break through share one trait: they know their unit economics before they scale.
The contrast is visible at the funnel level. Subscription apps using a hard paywall convert 12.1% of downloads to paying users within 35 days. Apps using a freemium model convert just 2.2% (RevenueCat, 2025). That is a 5.5x difference driven entirely by monetization structure, not traffic quality. Scaling the same ad budget into both funnels produces very different cost-per-subscription outcomes.
The question to answer before scaling is not "do we have enough budget?" The question is "do our numbers justify more spend?"
The Four Metrics That Tell You You're Ready
Every calculation starts from the same place: customer means paying user, not installer, not trial starter. That distinction matters for every metric below. An install is not a customer. A trial is not a customer. The person who paid is a customer.
There are four numbers every small app team needs before scaling app ads. Not fifty. Four.
1. Trial Start Rate
Trial start rate is the percentage of installs that begin a free trial. The all-category median is 6.2%, but top-performing apps (P90) hit 20.3%, more than three times the median (RevenueCat, 2025).
One insight most small teams overlook: 82% of trials start on Day 0 (RevenueCat, 2025). Paywall placement during the first session is decisive. Users who leave without starting a trial on Day 0 rarely return to start one.
If your trial start rate sits below 3%, you have an onboarding or paywall problem, not a traffic problem. More app ad spend at that conversion rate amplifies the leak rather than fixing it.
2. Trial to Paid Conversion
This is the number that separates apps ready to scale from apps ready to optimize. The all-category median is 34.8%. The top quartile (Q3+) starts at 51.5% (RevenueCat, 2025).
Trial length has an outsized impact on this number. Apps with trials lasting 17-32 days convert at a median of 45.7%, compared to 26.8% for shorter trials (RevenueCat, 2025). If your trial is set to 3 or 7 days and conversion is low, lengthening the trial period will often outperform increasing ad spend as a next step.
If your trial-to-paid rate is below 25%, scaling ads produces more churned trial users. Fix the trial experience first, then scale.
3. Revenue per Install (D60 RPI)
Lifetime value (LTV), or more practically Day 60 Revenue per Install (D60 RPI), tells you how much each install is worth after 60 days. The all-category median is $0.31. The top quartile hits $0.81 (RevenueCat, 2025).
This number is your effective ceiling for cost per install. If cost per install consistently exceeds D60 RPI, you are underwater from the first impression.
4. Cost per Subscription (CPS) and CPI Reality
Cost per subscription (CPS) is what you actually pay to acquire a paying user, not a click, not an install, not a trial start. Because CPPU (cost per paying user) is typically 4-5x the CPI (RevenueCat, 2025), teams that optimize for cheap installs often spend inefficiently on traffic that never converts.
Concrete CPI benchmarks by category show what you are actually working with (RevenueCat, 2025):
| Category | iOS CPI (Global) | Android CPI (North America) |
|---|---|---|
| Health & Fitness | $5.78 | $3.06 |
| Generative AI | $10.58 | $3.60 |
| Business | $14.08 | $11.25 |
| Gaming | $5.99 | $2.56 |
iOS CPI runs roughly 2-3x Android across most categories (RevenueCat, 2025). For a Health & Fitness app on iOS, a $5.78 CPI multiplied by the 4-5x CPPU factor puts your cost per subscriber around $26. A useful budget rule: keep your daily ad budget at least 10x your target CPA to give the algorithm enough signal to optimize. At a $26 CPA, that means $260/day minimum, or roughly $7,800/month, before results become reliable.
For teams with budgets under $10,000 per month, starting on Android delivers 2-3x more installs for the same spend. More installs means faster learning and statistically stronger data before you decide to scale.
| Metric | Median | Q3 (Top 25%) | Action if Below Median |
|---|---|---|---|
| Trial Start Rate | 6.2% | 12.4%+ | Audit onboarding and paywall placement |
| Trial to Paid | 34.8% | 51.5%+ | Improve trial experience and value delivery |
| D60 RPI | $0.31 | $0.81+ | Review pricing or trial length (17-32 days optimal) |
| Y1 LTV per Payer | $16.27 | $33.91+ | Improve retention before adding spend |
Source: RevenueCat, 2025
Hitting Q3 on at least two of these metrics is a reasonable "ready to scale" signal.
Want to see how App ads scaling metrics works with your data?
Get hands-on with Airbridge and see real results.
Try It Free →What Your Trial Design Reveals Before You Spend
Before scaling app ads, it is worth examining whether your trial is structured to convert the traffic you are buying. Two apps with identical ad budgets can produce very different subscription rates based entirely on how the trial is designed.
Trial length changes outcomes more than most copy changes. Subscription apps with trials lasting 17-32 days convert at a median of 45.7%, compared to 26.8% for apps with shorter trials (RevenueCat, 2025). The additional window gives users enough time with the product to feel confident paying.
Paywall design shapes conversion independently of trial length. Adding a trial offer to your paywall setup consistently outperforms showing pricing alone. Teams that run structured paywall experiments achieve up to 40x more revenue than those that do not (Adapty, 2026). That multiplier comes from teams running an average of 14.7 experiments on plan structure, trial duration, and pricing. Those experiments are only possible if you have the funnel events and cohort data the next section covers.
First renewal is the honest signal of product quality. It is straightforward to convince a curious user to start a free trial. The harder test is whether they pay, and then whether they stay. Nearly 30% of annual subscriptions cancel in the first month (RevenueCat, 2025). If your first-year annual renewal rate is below 66.3% (the industry median), scaling ad spend accelerates churn rather than growth.
Low usage drives most cancellations. "Not enough usage" is the leading cancellation reason, cited in 37.2% of cancellations across subscription apps (RevenueCat, 2025). If users are not returning to the app during their trial, more installs will not fix that.
A practical pre-scale trial checklist:
-
Trial length is at least 7 days (17-32 is the optimal range per RevenueCat, 2025)
-
Paywall includes a trial offer, not just a pricing grid
-
First-year renewal rate is above 50%
-
Post-install engagement shows users returning during the trial period
If all four conditions are met, your trial is ready for scaled traffic.
The Tracking Setup You Actually Need
Knowing the benchmarks is only useful if you can measure yourself against them. Here is the minimum instrumentation a small team needs before the first app ad goes live.
The 40x revenue difference between teams that run structured experiments and those that do not (Adapty, 2026) is not the result of bigger budgets. It is the result of better data. The setup below is the foundation that makes systematic testing possible.
1. Four funnel events
You need four events tracked in your analytics and passed back to your ad platform: Install (automatic), Trial Start, Subscription Start, and Subscription Renewal (or cancellation). Everything else is optional at this stage.
Without these four events, you cannot calculate trial start rate, trial-to-paid conversion, or CPS. You are measuring traffic volume, not business results.
One addition worth considering for Android teams: payment failure events. On Google Play, billing errors cause 28.2% of involuntary churn, compared to 15.1% on the App Store (RevenueCat, 2025). Tracking payment failure events and implementing retry logic can recover a meaningful share of these subscribers before they churn permanently.
2. Channel-level attribution
Every install needs a source tag so you know whether it came from Meta, Google, TikTok, or Apple Search Ads. On iOS, SKAdNetwork handles this through privacy-preserving postbacks. Understanding how postback windows and conversion value schemas work is essential before launching your first paid campaign.
Start with one channel. Prove unit economics. Then add a second channel and compare. Spreading a small budget across three or four channels simultaneously prevents you from reaching the volume needed to draw reliable conclusions from any of them.
3. One source of truth for revenue
Attribution data, payment data, and ad spend data come from three different systems, and none of them will agree perfectly. Understanding which source is authoritative for which question prevents you from making decisions based on the wrong number.
| Source | Authoritative For | Not Reliable For |
|---|---|---|
| Ad platforms (Meta, Google) | Creative performance: CTR, CPM, spend | Install-to-revenue attribution |
| App stores (Apple, Google Play) | Payment and billing data | Attribution or behavioral insights |
| Attribution tool | Install source tracking | Complete accuracy — discrepancies are normal |
Pick one as your primary decision-making reference before you start, and stick to it. Switching mid-campaign invalidates the comparisons you have already built.
4. Cohort analysis, not just totals
Aggregate metrics mislead. A total conversion rate of 34% might look healthy while hiding the fact that campaigns from last month converted at 12% and campaigns from two months ago converted at 56%. Before scaling, confirm you can segment data by install cohort and by channel. This is the difference between knowing "conversion is 34%" and knowing "Meta converts 41%, Google converts 28%." Only one of those enables a confident scaling decision.
Where Do Your Numbers Stand?
The benchmark table in the section above is your reference. If you are below median on more than two metrics, prioritize optimization before adding ad spend. The goal is not to hit P90 on everything before spending. The goal is to understand your funnel well enough that scaling reveals where to invest, not whether you survive the investment.
Frequently Asked Questions
Do I need a dedicated tracking tool before my first app ad campaign?
Yes. At minimum, every install from a paid campaign needs a channel source attached to it. Without attribution data, you cannot calculate CPS by channel, which means you cannot compare platform performance. A single-channel setup can start with each platform's native analytics. Once you run two or more channels simultaneously, you need a unified view. Otherwise you are reading separate reports that count the same users differently and drawing wrong conclusions from the discrepancies.
How many conversions do I need before my data is reliable?
Calculate the sample size you need based on your baseline conversion rate and the minimum lift you want to detect. Do not use a fixed number — the right threshold depends on your current rate and how large a difference matters to your decision. As a rough guide, most subscription apps need several hundred trial starts before cohort-level patterns stabilize. With fewer data points, a handful of outliers can move your observed rate by 10 percentage points or more in either direction.
Should I optimize app ads for CPI or CPS?
Always CPS (cost per subscription). CPI tells you how cheap your traffic is, not how valuable it is. A $2 install from a user who never starts a trial costs more in the long run than a $6 install from a user who subscribes and renews. Most subscription apps discover that the channel with the highest CPI often produces the lowest CPS, because it attracts higher-intent users. Optimize for the metric that represents actual revenue.
How do I know if my problem is the product or the ads?
Run a simple diagnostic. Take your current organic users and measure their trial-to-paid conversion rate. Then compare it against your paid users' rate. If organic converts at 40% and paid converts at 18%, the ads are attracting the wrong audience. If both convert at similar rates but the rate is low, the product or trial experience needs work before scaling either channel. The gap between organic and paid conversion is the clearest signal available.
Track First. Then Scale.
The apps that scale efficiently are not the ones with the biggest budgets. They are the ones that know their funnel numbers before they spend.
If you are running app ads on Meta, Google, or TikTok and want to see exactly which campaigns drive paying subscribers (by channel, by creative, by day), Airbridge Core Plan connects your ad spend to subscription revenue. It includes 15K free attributed installs, pre-configured subscription funnel events (Trial Start, Subscribe, Renewal), and direct integrations with RevenueCat and Adapty.


Ready to transform your mobile growth?
Learn how Airbridge helps leading brands measure and optimize every touchpoint.