Introducing the Overview Dashboard: Track all your key metrics in one glance
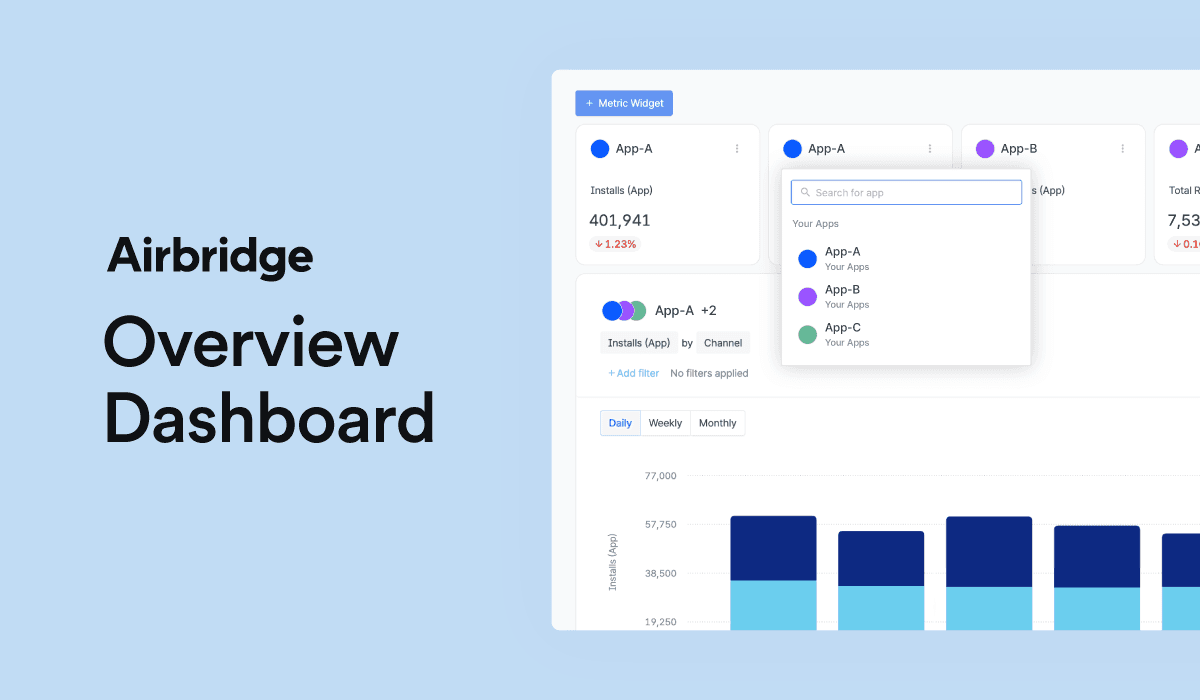
Are you looking for an effortless way to monitor the performance of all your app ad campaigns at a glance? Look no further – Airbridge is thrilled to introduce our latest feature, the Overview Dashboard!
Airbridge has just unveiled the Overview Dashboard, a powerful tool that enables you to easily track the key metrics of all your apps in real-time. Presented as intuitive widgets, charts, and tables, this feature allows you to gain quick insights and monitor the overall performance of either multiple apps or a single app simultaneously. With the Airbridge Overview Dashboard, optimizing your marketing performance has never been more accessible. Stay on top of your app’s ad performance and make data-driven decisions to enhance your marketing strategy.
What is the Airbridge Overview Dashboard?
Airbridge, a mobile measurement partner (MMP), delivers a unified overview of mobile app marketing performance. To get started with Airbridge and measure your ad performance, the first step is registering your app to Airbridge. Whether you’re managing multiple organizations or apps, Airbridge can accommodate your needs. By unifying data from diverse devices, platforms, and channels, Airbridge delivers an integrated marketing performance analysis by offering a range of report types.
👉 Learn more about Registering an App with Airbridge
And now, the Overview Dashboard emerges as your customizable go-to interface for your app growth monitoring. It empowers you to easily track the key metrics of all your apps at a glance in real-time.
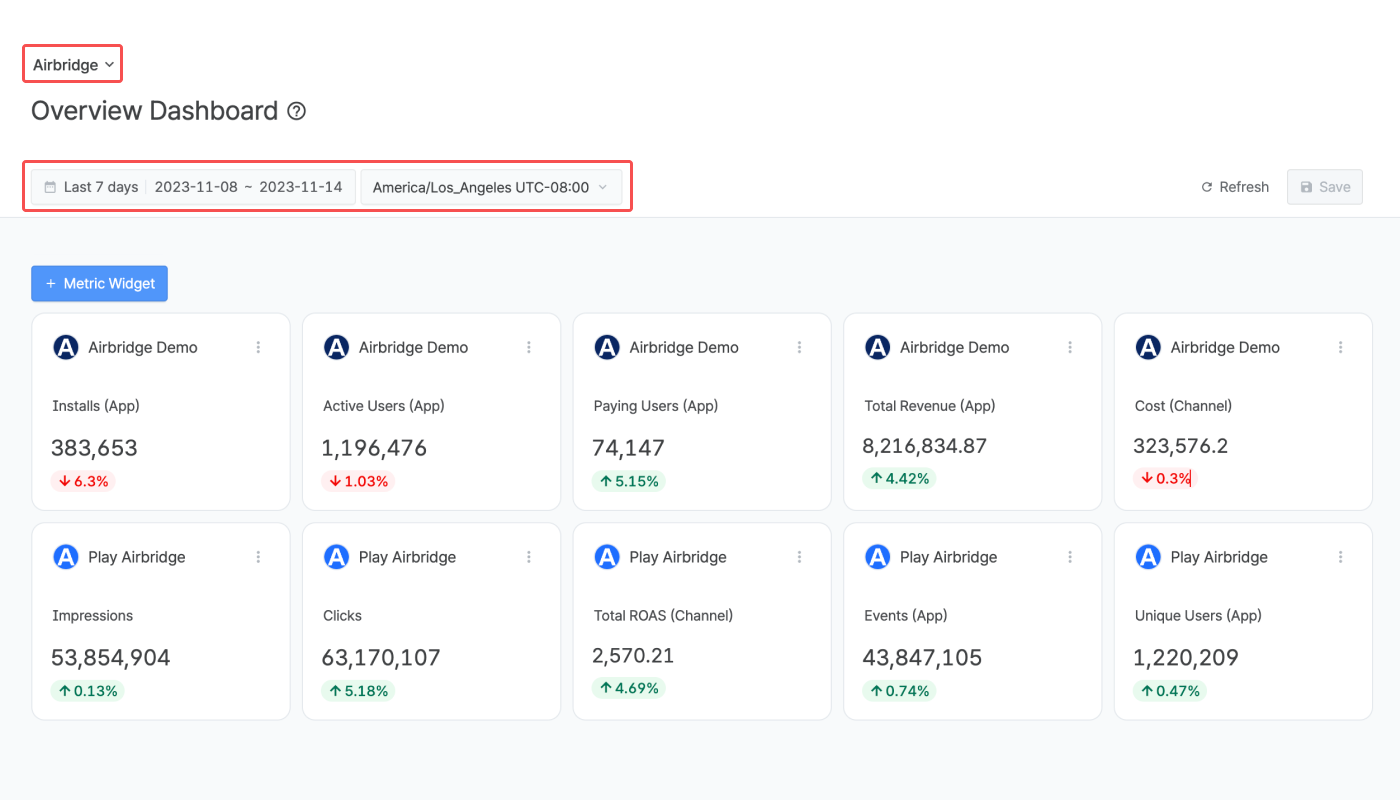
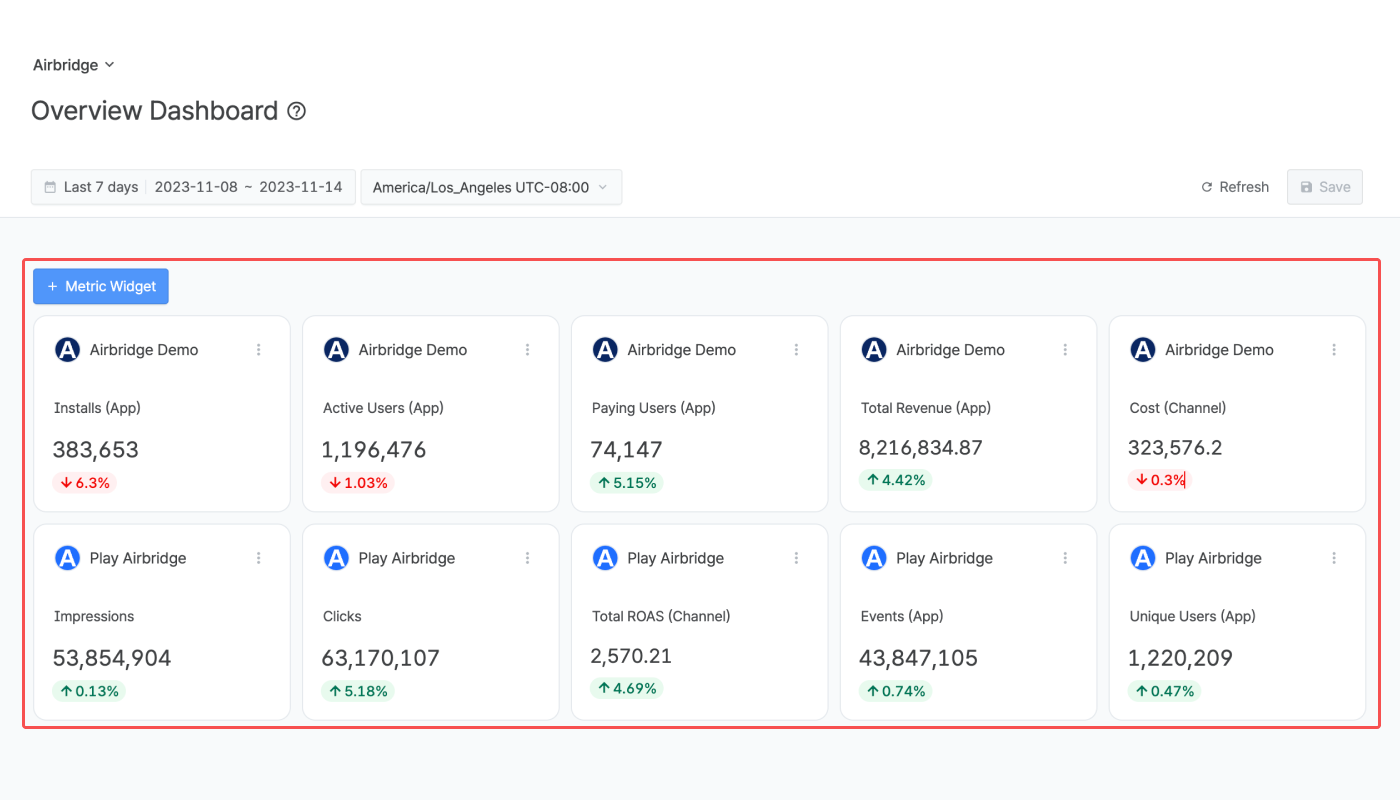
Metric Widgets
Create widgets that display the key metrics of the apps registered to the selected organization. You can also compare the ad performance of multiple apps using the same metric or assess the ad performance of a specific app simultaneously with multiple metrics. One of the most attractive features is the ability to gain intuitive insights with the rate of increase or decrease in metric values compared to the previous date range.
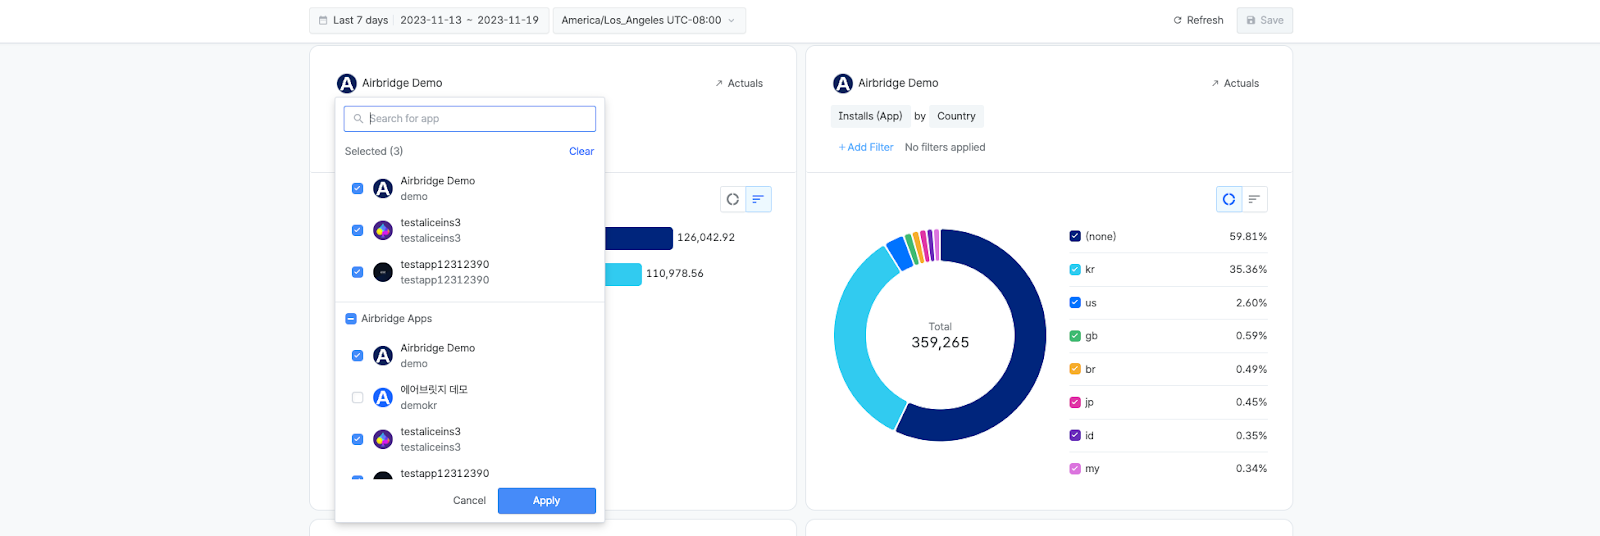
Charts and tables
The Overview Dashboard presents a visual view of ad performance over a specified period through six charts and one table. Configuration options include two charts in a stacked bar or line graph format and four charts in a horizontal bar or donut chart type. All charts and tables support the selection of multiple apps simultaneously, enabling a comprehensive check of your ad performance in one view.
For a more detailed analysis of a specific metric, simply click on ‘Trend’ or ‘Actuals’ on the chart or table. This action will redirect you to either the Trend Report or the Actuals Report in a new tab, maintaining the same configuration as in the original chart or table. Here, you can further enhance your analysis by adding more GroupBys and Filters to refine your insights.
Want to see how Airbridge unveiled works with your data?
Get hands-on with Airbridge and see real results.
Try It Free →Why you need a dashboard for quick insights
The Airbridge Overview Dashboard help marketers to compare the key metrics of the app at a glance and get insights when you are running either multiple apps or one app. In particular, you can see the visualized ad performance without having to connect data to external Business Intelligence (BI) tools.
Comparing the ad performance of multiple apps
If you are managing multiple apps within a single company at the same time, the challenge of analyzing metrics intensifies due to the sheer volume of metrics and diverse situations to track. This is where tools like the Airbridge Overview Dashboard come into play. By efficiently checking the key metrics of multiple apps simultaneously, you can swiftly identify opportunities and gain insights. This allows for quick budget reallocation across campaigns and the seamless adjustment of your marketing strategy to enhance overall performance effectively.
Monitoring the ad performance of an app intuitively
Whether you’re overseeing a single app or multiple, the Airbridge Overview Dashboard ensures you get swift insights all on one screen. Moreover, Metric Widgets provide a quick overview of an app’s ad performance, showcasing the rate of increase or decrease compared to the previous period. Customize the Metric Widgets with the key metrics you frequently monitor, making it convenient to track daily updates effortlessly.

Discover more about the detailed settings by clicking on the User Guide linked below. Whether you’re keen on monitoring a single app’s ad performance or comparing multiple apps’ ad performance, the Airbridge Overview Dashboard can help you gain valuable insights and maximize your marketing performance!


Ready to transform your mobile growth?
Learn how Airbridge helps leading brands measure and optimize every touchpoint.