What Should You Track Before Spending More on App Marketing

You launched ads. Installs are coming in. But when someone asks "is it working?" you open a dashboard, stare at a line going up, and realize you have no idea what "working" actually means. If you have ever wondered what metrics to track for app ads, you are not alone. Install count tells you people downloaded your app. It does not tell you whether those people will ever pay you a dollar.
Most growth teams start scaling ad spend based on installs and CPI alone. That is like judging a restaurant by how many people walk through the door, ignoring whether anyone orders food. The gap between downloading and paying is where your budget either compounds or evaporates. In most subscription apps, fewer than 3% of installs ever become paying subscribers. If you cannot see where in the funnel users drop off, you cannot fix the leak.
If you cannot see those numbers broken down by channel, by campaign, by week, you are spending blind.
Key Takeaways
-
Seven metrics in funnel order give you full visibility. CPI, install-to-trial rate, cost per trial, trial-to-paid rate, cost per subscription, LTV, and ROAS. Track them together, not in isolation.
-
Installs are an exposure metric, not a success metric. A campaign with 1,000 installs and zero trials is worse than one with 200 installs and 40 trials.
-
No single metric tells the truth alone. CPI without post-install conversion data is noise. Always compare cost per subscription against lifetime value.
-
Scaling before you have enough conversion data is the most expensive mistake. You need at least 50 conversion events per campaign before making spend decisions.
Why Install Count Alone Will Mislead You
1. What Installs Actually Measure
An install tells you one thing: someone tapped "Get" or "Install." It confirms that your ad creative caught attention and your App Store listing did not scare them off. That is it.
Installs do not tell you whether the user opened the app, started a trial, hit your paywall, or subscribed. They are an upper-funnel metric that measures distribution, not monetization.
Growth teams optimize for CPI because it is the first number they see. But a $2 CPI campaign that generates zero trials costs you infinitely more per subscriber than a $6 CPI campaign where 15% start a trial.
2. The Real Gap Between Downloading and Paying
Here is what the funnel actually looks like for a typical subscription app:
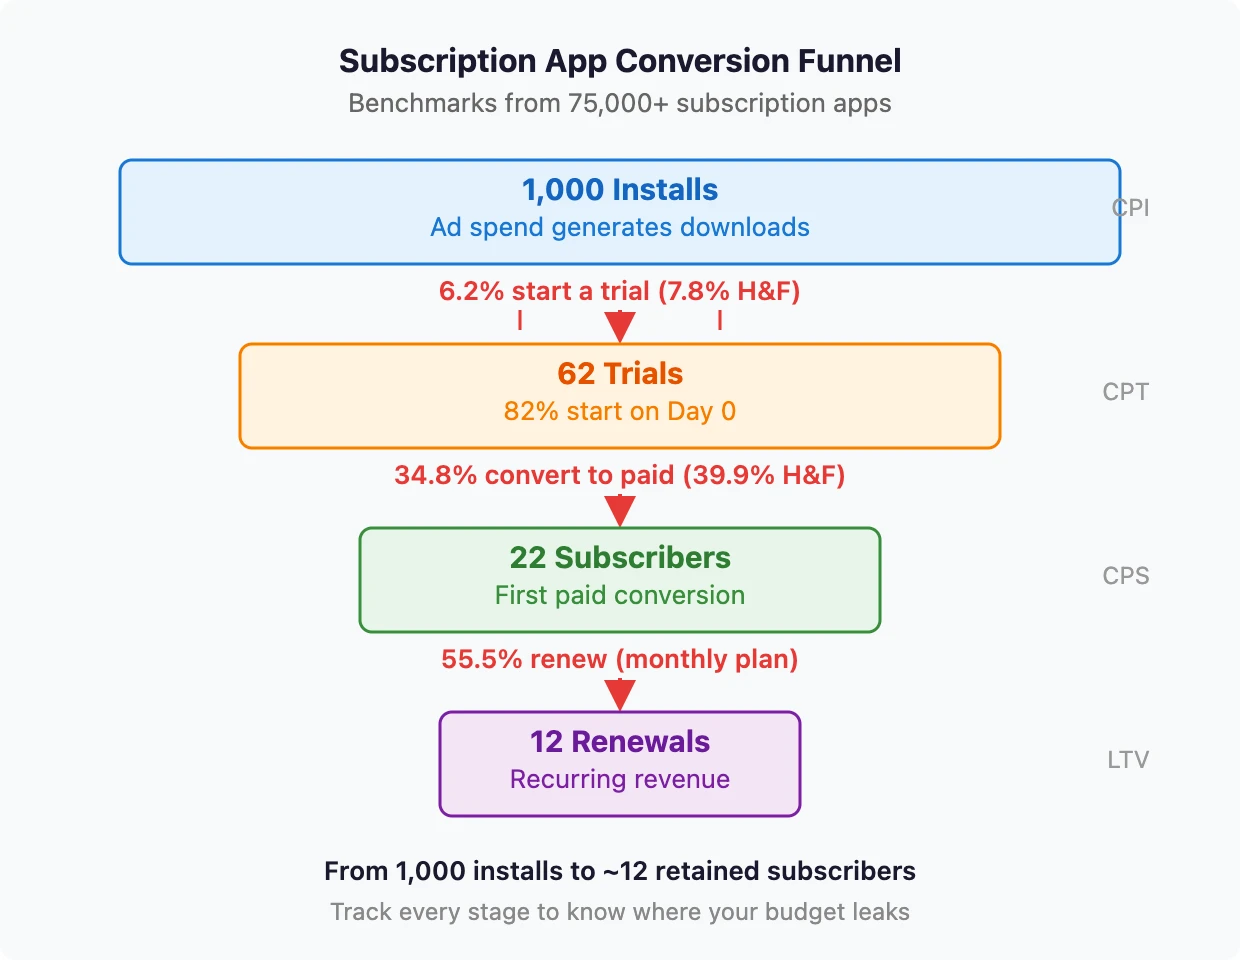
The median install-to-trial rate across 75,000+ subscription apps is 6.2%. Health & fitness apps perform better at 7.8%, but that still means over 92% of installs never start a trial.
Of those who do start a trial, 34.8% convert to paid (39.9% in health & fitness). And 82% of trials start on Day 0. If a user does not start your trial the day they install, they probably never will.
This is why tracking in-app events matters more than counting installs. The install is the beginning of the story, not the end.
The 7 App Marketing Metrics That Actually Matter
These seven metrics follow your user from ad click to recurring revenue. Each one answers a different question about your paid UA performance.
1. Cost per Install (CPI)
What it is: Total ad spend divided by total installs.
Formula: Ad Spend / Installs
Benchmark: iOS health & fitness averages $5.78. Business apps run higher at $14.08. iOS CPI runs roughly 3x Android across categories.
What it tells you: How efficiently you are generating downloads. But CPI alone is a vanity metric. A low CPI with poor post-install conversion is a money pit.
2. Install-to-Trial Rate
What it is: The percentage of users who install and then start a free trial.
Formula: Trial Starts / Installs
Benchmark: Median 6.2% across all subscription apps. Health & fitness: 7.8%. The global average across 16,000+ apps is 10.9%, so beating that figure puts you in strong territory.
What it tells you: Whether your onboarding and paywall are working. If this number is below 5%, fix your app experience before spending more on ads.
3. Cost per Trial (CPT)
What it is: How much you spend to get one user to start a trial.
Formula: Ad Spend / Trial Starts (or CPI / Install-to-Trial Rate)
Benchmark: A healthy blended CPT for subscription apps is $20-$40. If you are paying $5.78 CPI with a 7.8% trial rate, your CPT is $74. That is expensive.
What it tells you: The real cost of acquiring an engaged user. CPT is the first meaningful cost metric in your funnel because it filters out dead installs.
4. Trial-to-Paid Rate
What it is: The percentage of trial users who convert to paid subscribers.
Formula: Paid Conversions / Trial Starts
Benchmark: Median 34.8% across subscription apps. Health & fitness: 39.9%. Education: 42%. Longer trial periods (17-32 days) convert at 45.7% versus 26.8% for short trials of 3-7 days.
What it tells you: Whether your trial experience delivers enough value to justify the price. If this is below 30%, your trial length, onboarding, or pricing needs work. Consider reading about freemium vs. free trial models if you are still deciding on your monetization approach.
5. Cost per Subscription (CPS)
What it is: How much you spend to acquire one paying subscriber.
Formula: Ad Spend / Paid Subscribers (or CPT / Trial-to-Paid Rate)
Benchmark: CPS typically runs 4-5x your CPI. If your CPI is $5.78, expect CPS in the $23-$29 range under good conditions. Many apps see CPS above $50.
What it tells you: The actual cost of acquiring revenue. This is the number you compare against LTV to know if your ads are profitable.
6. Lifetime Value (LTV)
What it is: Total revenue a subscriber generates over their lifetime.
Formula: ARPU x Average Subscriber Lifespan (or Revenue / Total Subscribers for a simpler version)
Benchmark: Median Year 1 LTV per payer is $16.27 across subscription apps (P90: $60.68). Health & fitness: $27.21 Year 1. High-priced apps generate 3-7x the LTV of low-priced ones, depending on category and pricing tier.
What it tells you: The ceiling on what you can afford to spend acquiring a subscriber. If your LTV is $27 and your CPS is $35, you are losing money on every conversion.
7. Return on Ad Spend (ROAS)
What it is: Revenue generated per dollar of ad spend.
Formula: Revenue from Acquired Users / Ad Spend
Benchmark: Cross-industry medians show Google Ads averaging around 3.31x, Meta around 2.19x, TikTok around 1.41x. These are blended averages across industries, not subscription-app-specific.
What it tells you: Whether your ad spend is generating positive returns. ROAS is the single summary metric that combines everything above. A ROAS below 1.0 means you are losing money.
Here is how all seven metrics compare at a glance:
| Metric | Formula | Benchmark (Subscription Apps) | What to Watch For |
|---|---|---|---|
| CPI | Spend / Installs | $5.78 iOS H&F | Low CPI with low trial rate = wasted spend |
| Install-to-Trial | Trials / Installs | 6.2% median, 7.8% H&F | Below 5% = fix onboarding before scaling |
| CPT | Spend / Trials | $20-$40 blended | Above $50 = check CPI and trial rate |
| Trial-to-Paid | Paid / Trials | 34.8% median, 39.9% H&F | Below 30% = trial or pricing problem |
| CPS | Spend / Paid Subs | 4-5x CPI | Must be less than LTV |
| LTV | Revenue / Subscribers | $16.27 median Y1 | Compare against CPS by channel |
| ROAS | Revenue / Spend | 2-3x healthy | Below 1.0 = unprofitable |
Start measuring what matters — for free
Airbridge Core Plan gives growing teams real attribution, deep linking, and audience tools at no cost.
Get Started Free →When One Metric Looks Good but the Math Does Not Add Up
Individual metrics without context lead to bad decisions. Here is how to connect them.
1. The Golden Rule: LTV Must Exceed CPS
This sounds obvious but most teams violate it without knowing. If your median Year 1 LTV is $27.21 (the health & fitness benchmark) and your blended CPS is $30, you are underwater. And that assumes a full year of retention.
The math gets worse with short payback windows. If you are on a monthly plan and your first-renewal retention is 55.5%, nearly half your subscribers churn before Month 2. Your effective LTV on Day 30 is far lower than your annualized projection.
The target: CPS should be no more than 30-50% of projected Year 1 LTV. This aligns with the widely cited 3:1 LTV-to-CAC benchmark and gives you margin for churn, seasonality, and measurement error.
2. Why You Should Compare Channels by CPS, Not CPI
A $3 CPI on Meta looks cheaper than a $6 CPI on Apple Search Ads. But if Meta's install-to-trial rate is 4% and ASA's is 12%, the math flips:
-
Meta: $3 CPI / 4% trial rate = $75 CPT
-
ASA: $6 CPI / 12% trial rate = $50 CPT
Now apply trial-to-paid rates. If Meta converts trials at 30% and ASA at 40%:
-
Meta: $75 / 30% = $250 CPS
-
ASA: $50 / 40% = $125 CPS
The "expensive" channel delivers subscribers at half the cost. This is why CPI comparisons across channels are unreliable without funnel data.
3. Use Cohorts to See What Averages Hide
Averages hide the truth. A D30 ROAS of 1.5x looks good until you realize one cohort from a seasonal spike is pulling it up.
Break your data by:
-
Time cohort: Weekly install groups. Did the March 15 cohort convert better than March 22?
-
Channel cohort: Same week, different channels. Which one has a higher trial-to-paid rate?
-
Segment cohort: iOS vs. Android, country, campaign type.
Revenue per install at D60 is $0.31 median across subscription apps. If your D60 revenue per install is above that, your funnel is working. If it is below, find out which cohort is dragging the number down.
5 Metrics Mistakes That Burn Through Ad Budget
1. Chasing Cheap Installs That Never Convert
This is the most common trap. You find a campaign with a $1.50 CPI and pour budget into it. Installs flood in. Trials do not. Your CPT is $75 and your CPS is $200+.
The fix: set a CPT ceiling, not a CPI target. If your LTV is $27, your CPS needs to stay below $14 to hit a 2x LTV-to-CPS ratio. Work backward from there.
2. Treating All Channels as if They Do the Same Job
ASA captures high-intent users already searching for your category. Meta introduces your app to people who were not looking for it. TikTok reaches users in a discovery mindset. Each channel plays a different role in your funnel, and expecting the same CPI or conversion rate from all of them leads to wrong conclusions about which ones work.
3. Scaling a Campaign With Too Few Conversion Events
Ad platforms need conversion data to optimize. The minimum threshold is roughly 50 conversion events per week per campaign. If you are optimizing for "trial started" and only getting 8 trials per week, the algorithm is guessing.
Budget should be at least 10x your target CPA. If your target CPT is $30, spend at least $300/day on that campaign before evaluating performance. Scaling before this threshold means you are reading noise, not signal.
4. Looking at Averages Instead of Segments
Your blended trial-to-paid rate might be 35%. But when you split by OS, iOS converts at 42% and Android at 18%. When you split by creative, video ads convert at 38% and static at 25%.
Averages kill profitable segments. Break every metric by channel, OS, creative type, and campaign before making budget decisions.
5. Ignoring the Payback Period
A $50 CPS with a $100 LTV looks profitable. But if your average subscriber takes 9 months to pay back that $50, and you are spending $20K/month on ads, you need $180K in working capital before you break even. High LTV means nothing if cash runs out before the payback period closes.
Track monthly revenue per cohort. Know exactly which month each cohort turns profitable.
How to Wire Up Tracking for All 7 Metrics
Knowing what to track is half the problem. The other half is actually collecting the data.
1. Events You Need to Fire From Your App
Your app needs to send events at each funnel stage. At minimum:
-
app_open: confirms the install led to an active session
-
trial_started: user initiated a free trial
-
trial_converted: trial user became a paid subscriber
-
subscription_renewed: paid user renewed (weekly, monthly, or annually)
-
subscription_cancelled: user cancelled before next renewal
Without these events, you cannot calculate anything beyond CPI. Most analytics platforms and ad networks accept server-side event streams. Map your subscription events to your measurement stack early, before you scale spend.
2. Connecting Ad Spend Data to In-App Events
This is where most setups break. You have ad spend data in Meta, Google, and ASA dashboards. You have in-app event data in your analytics tool. Connecting the two requires a measurement layer that links the ad click to downstream events.
If you are starting your first campaigns with a small budget, you can do this manually by pulling reports and matching dates. But once you run multiple channels simultaneously, you need an automated connection between ad spend and subscription events.
Airbridge Core Plan connects your ad channels to in-app subscription events in a single dashboard, with 15,000 monthly installs included free. If your current setup cannot show you cost per trial by channel in one screen, it is worth starting free before you increase spend.
3. Building Your First Metrics Dashboard
Your dashboard needs three views:
Daily view: CPI, CPT, and install volume by channel. This catches sudden changes.
Weekly view: Trial-to-paid rate, CPS, and ROAS by channel cohort. This is your decision-making view.
Monthly view: LTV progression by cohort, payback period, and blended ROAS. This tells you whether your unit economics are improving.
Start with a spreadsheet if needed. The format does not matter. What matters is looking at these numbers weekly and making budget decisions based on CPS and ROAS, not CPI and install volume.

FAQ
What is a good ROAS for a subscription app?
It depends on your payback window. For subscription apps with monthly billing, a D30 ROAS of 0.5-0.8x is common because most revenue comes in over months, not days. A D90 ROAS above 1.0x is the minimum target. Annual plans front-load revenue, so D30 ROAS can hit 1.5-2.0x. Cross-industry averages (Google 3.31x, Meta 2.19x) include e-commerce and lead gen, which monetize faster than subscriptions. Do not benchmark against those numbers.
How long should I wait before judging a campaign?
At minimum, 14 days after the campaign exits its learning phase. For most platforms, that means 21+ days total. For subscription apps specifically, add the length of your trial period on top of that because trial-to-paid conversions happen days or weeks after install. A 7-day trial app needs at least 28 days of data. A 14-day trial app needs 35+. Judge based on CPS and ROAS at the end of that window, not CPI on Day 3.
Do I need different metrics for iOS and Android?
Yes, and the differences are significant. iOS CPI runs roughly 3x higher than Android. But iOS users convert to paid at higher rates and have higher LTV. Your CPS on iOS might actually be lower than Android despite the higher CPI. 12-month retention also differs: yearly subscribers retain at 44.1% versus monthly at 17.5%. Always split your metrics by OS. A blended view hides these differences and leads to bad allocation decisions.
Start With These 7 Numbers Before You Spend Another Dollar
You do not need 50 metrics. You need seven. And you need to look at them in funnel order, by channel, every week.
The goal is simple: know your CPS by channel and compare it against your LTV. Everything else is a supporting detail. If you can answer "which channel delivers paying subscribers at the lowest cost, and is that cost less than what those subscribers are worth?" you have enough data to make smart scaling decisions.
If you cannot answer that question today, do not increase your ad budget. Set up your event tracking, collect two weeks of conversion data, and then decide where to put your next dollar.


Ready to see what Core Plan can do?
Free attribution, deep linking, and audience tools — built for teams that are ready to grow.