5 App Marketing Shifts After Apple's Privacy Changes (2026)

Privacy changes didn't just make tracking harder. They changed who wins. App Tracking Transparency (ATT), launched with iOS 14.5 in April 2021, cut off automatic access to device-level identifiers. ATT opt-in rates fell to a global low of 13.85% in mid-2024, down 16% in Q1 alone and another 12.5% in Q2. The platforms adapted. The attribution frameworks changed. And the gap between marketers who understand exactly what shifted, and those who are still guessing, keeps widening.
This article covers the five changes that are actually affecting your numbers, what they mean in practice, and what to do differently right now.
Key Takeaways
-
ATT didn't kill targeting; it changed who has signal. Opt-in users now carry far more value per impression, and your bidding strategy should reflect that asymmetry.
-
SKAN replaced user-level attribution with aggregated, delayed postbacks. Campaign measurement now happens at the cohort level, not the individual level.
-
Creative is doing the targeting work that audience data used to do. Hook rate and hold rate are the new optimization levers.
-
Android crossed the majority threshold for paid installs. Android now accounts for more than half of global paid app installs, while North America UA spend fell -40% YoY.
-
Incrementality testing replaced last-click attribution as the standard. If you are not running holdout tests, you are likely crediting your best channels incorrectly.
Below are the five major app marketing shifts shaping growth strategies after Apple's privacy changes.
ATT Wiped Out User-Level Targeting
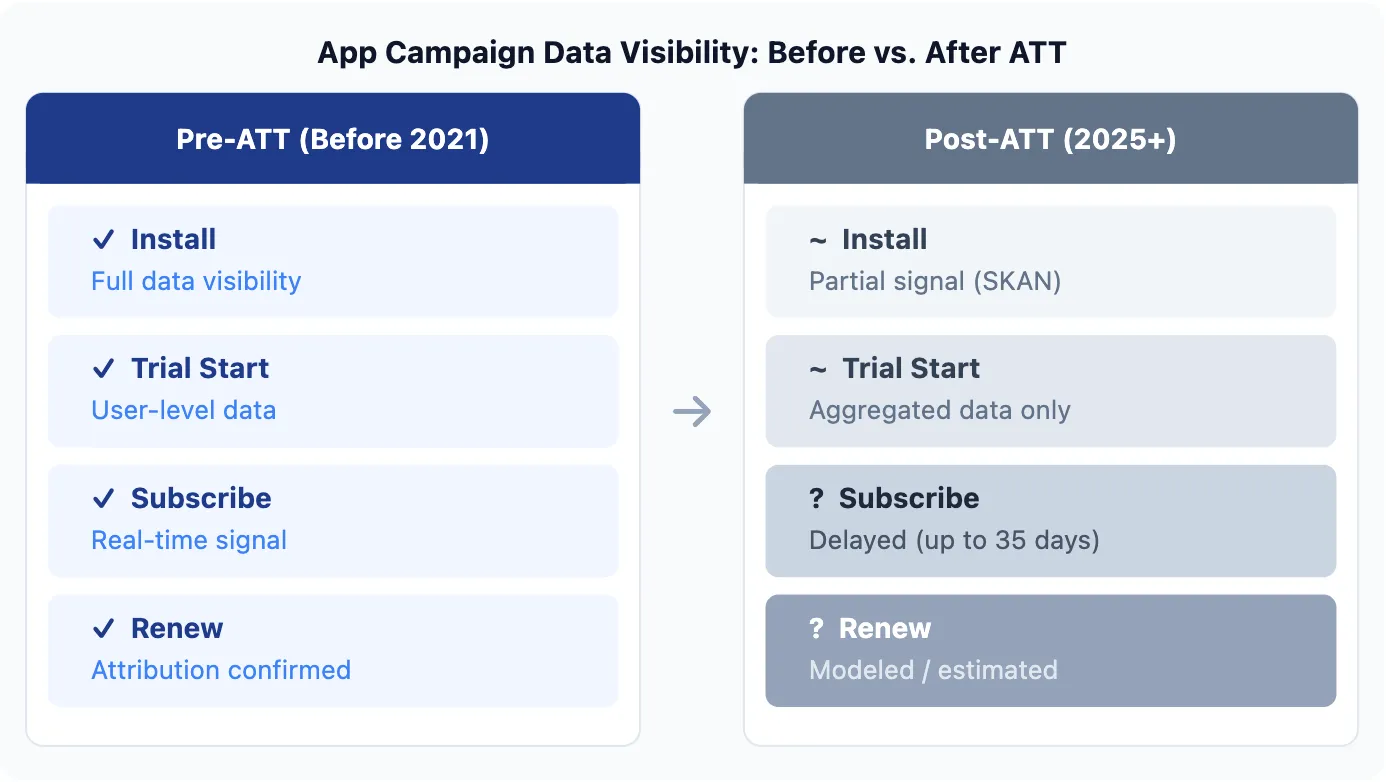
App Tracking Transparency requires apps to explicitly ask users for permission to track them across other companies' apps and websites. When users say no, the Identifier for Advertisers (IDFA) is unavailable. Ad networks operate without individual user-level signals.
ATT opt-in rates vary by measurement methodology. Singular's Q2 2024 report placed the global average at 13.85% in mid-2024. For non-gaming apps, the rate was lower still: 11.92%, versus 18.58% for games. The platforms were not designed to function at this consent rate. Meta, Google, and TikTok are now running campaigns on probabilistic and modeled signals rather than deterministic user data.
The platform response was to centralize optimization into their own systems. Advantage+ Campaigns (Meta) and Performance Max (Google) handle targeting internally using first-party data the platform owns. You give up manual control over audience selection in exchange for algorithmic reach. Teams that resist this shift, trying to preserve granular campaign structures from 2019, find CPMs rising and performance declining.
The consent rate itself is something you can influence. Apps that show the ATT prompt after a user completes a meaningful action, such as signing up or reaching a paywall moment, consistently see better opt-in results than apps that prompt on first launch (Purchasely, 2025). The timing of the consent request is now a media buying decision, not an afterthought.
SKAN Replaced Real-Time Attribution
SKAdNetwork (SKAN) is Apple's privacy-preserving attribution framework, designed to give advertisers campaign-level data without exposing individual user identities. SKAN 4.0, now the industry standard, delivers up to three postbacks spread over 35 days post-install rather than real-time user-level signals (Aarki, 2025). The data is aggregated and tiered: campaigns that reach volume thresholds receive more granular postback data; those that do not receive suppressed or null values.
| Measurement Model | Data Type | Timing | Granularity |
|---|---|---|---|
| Pre-ATT (IDFA) | User-level | Real-time | Full funnel |
| SKAN 4.0 | Aggregated | Up to 35 days | Campaign-level |
| Modeled attribution | Probabilistic | Real-time (estimated) | Mixed |
The practical implication: you can no longer optimize campaigns on Day 2 subscription data the way you once did. Mapping your SKAN conversion schema to the early event that best predicts long-term subscription value is the most important technical move for iOS measurement. For most subscription apps, that event is "Start Trial" within the first 24-48 hours.
Apple's next evolution, AdAttributionKit (AAK), builds on SKAN and expands attribution to additional surfaces including Safari. AAK is not replacing SKAN immediately, but teams who ignore it now will face another migration unprepared.
Self-Attributing Networks (SANs), including Meta, Google, TikTok, and Apple Search Ads, report their own attribution numbers separately from what any measurement platform sees. Post-ATT, the discrepancies between platform-reported and independently-measured data are larger than before. Focus on directional trends rather than demanding perfect reconciliation between sources.
Want to see how Apple privacy works with your data?
Get hands-on with Airbridge and see real results.
Try It Free →Creative Became the Primary Targeting Tool
Before ATT, layering audience targeting on top of average creative still converted. Post-ATT, that safety net is gone. With iOS audience signal mostly unavailable, what self-selects the right audience is the ad itself.
The first second of a video ad now determines whether your campaign gets algorithmic amplification. By the 3-second mark, roughly 50% of viewers have already scrolled past. Hook rate and hold rate are the metrics that signal to platform algorithms whether to expand delivery or throttle it.
Three implications for subscription app teams:
-
Build volume. A library of roughly 100 creative variants gives you enough test data to identify which angles and hooks resonate. Testing fewer variants means slower learning and higher cost per subscriber.
-
Format is platform-specific. Creative that performs on Meta does not automatically work on TikTok. TikTok requires content that matches TikTok culture. Run each platform on its own creative system.
-
Meta ad group structure changed. Meta's algorithm prioritizes 1-2 creatives per ad group regardless of how many you upload. New winners belong in new ad groups, not added to existing ones.
Budget discipline compounds everything. The 10x rule: set daily budget at a minimum of 10 times your target cost per acquisition (CPA). Running on too little budget starves the algorithm of the conversion volume it needs to optimize. With noisier post-ATT signals, this constraint is stricter, not looser.
Android and Emerging Markets Took the Lead
The geographic and platform picture changed substantially. The data across 1.7 billion paid installs of 2,900 subscription apps makes the shift concrete.
Android crossed the majority threshold. Android's share of paid app installs rose from 43% to 51%, crossing the majority line. iOS grew from 30% to 34%. Android is now the higher-volume platform for paid acquisition and offers more measurement flexibility because ATT does not apply.
North America is no longer the growth engine. UA ad spend in North America fell -40% YoY. Indian Subcontinent grew +423%, LATAM grew +77%, Eastern Europe grew +96%, Middle East grew +197%. Apps built entirely around US iOS audiences are over-indexed in a declining segment.
Category concentration is accelerating. Health and Fitness saw its top 5 apps go from controlling 54% of UA spend to 73% in one measurement period. In Short Drama and OTT, the top 5 apps hold 90%+ of all UA spend. Incremental ad budget alone cannot break through in saturated categories. Product differentiation has become a prerequisite for paid growth.
Incrementality Replaced Last-Click Attribution
Incrementality testing is the most important methodological shift for post-ATT measurement. Hold out a portion of your audience from seeing ads, then compare conversion rates between the exposed group and the holdout. The difference is your true incremental lift. Without this, you risk crediting campaigns for users who would have converted anyway. For a full explainer on how mobile attribution works and where it breaks down in low-signal environments, see our attribution guide.
The simplest version is a geo-based holdout: run ads in one comparable market, pause in another, compare organic conversion. This requires no specialized tooling and gives directional data on whether a campaign is actually driving subscriptions or just capturing existing intent.
-
Modeled LTV replaces D7 ROAS as the optimization target SKAN's delayed and aggregated signals make early-window revenue metrics unreliable as standalone decisions. Estimating eventual subscription value from early behavioral signals, such as session depth and feature engagement in Days 1-3, gives a more accurate picture of which campaigns are worth scaling.
-
Self-reported attribution adds qualitative signal that performance tracking routinely misses. Asking users "How did you hear about us?" during onboarding captures word-of-mouth, organic social, and influencer activity that attribution windows cannot credit. Correlating those responses with actual LTV reveals which channels your models are underweighting.
FAQs
Does ATT affect Android campaigns?
No. ATT is specific to iOS. Android uses its own evolving privacy framework (Privacy Sandbox for Android), which currently allows more user-level measurement than iOS. This is a significant reason Android paid installs grew +57% YoY globally. Android-first strategies are standard practice for subscription apps that need both measurement flexibility and scale.
Is SKAN 4.0 enough to measure subscription campaigns?
SKAN 4.0 gives more data than earlier versions, but it has real limits: postback delays up to 35 days, aggregated signals rather than user-level data, and volume thresholds before granular postbacks unlock. Most subscription app teams use SKAN as one input inside a blended measurement model that also includes incrementality testing, modeled cohort LTV, and self-reported attribution. SKAN alone is not sufficient for budget allocation decisions.
What happened to fingerprinting?
Apple explicitly prohibits fingerprinting (combining device signals to identify users without consent). Apps using it risk App Store rejection. The industry has moved to compliant methods: SKAN postbacks, modeled attribution, and first-party data collected directly from users during onboarding.
The Teams Winning Privacy-Era UA Are Already Running Differently
The shift since iOS 14.5 is not a single change you adapt to once. It is a structural reset in how mobile performance marketing works. The teams doing well are testing more creative variants at higher volume, measuring in cohorts and holdouts rather than individual attribution, expanding into Android-first markets, and treating their ATT consent flow as a media buying decision.
The fundamentals of subscription app marketing did not change. Strong onboarding, a paywall that appears at the right moment, and ad spend mapped to LTV rather than installs still define who builds a sustainable business. What changed is how clearly you can see those results, and how quickly you can act on what you see.
Without a measurement layer that connects these fragmented signals, you end up comparing dashboards where every network claims credit for the same install. That gap between what each platform reports and what actually drove the subscription is where budget gets wasted.
For subscription apps that want to connect ad spend to subscription revenue across channels, start free with Airbridge Core Plan — 15K attributed installs included.
Ready to transform your mobile growth?
Learn how Airbridge helps leading brands measure and optimize every touchpoint.