Attribution Platforms Compared by Use Case and Billing Model
Explains when Airbridge Core fits, contrasts event-based with conversion-based billing, and gives a checklist to compare quotes at your expected volume.
Airbridge Core meters app events, while AppsFlyer Growth lists charges by conversion.
- For consumer app campaigns, compare billable app events with billable conversions, not just the phrase “unlimited attribution.”
- Airbridge Core includes unlimited attribution, with a 30-day trial, then $40+/mo, 500K data points included, and $0.0001 per extra data point.
- AppsFlyer Growth publishes a conversion-based structure: custom pricing, 12,000 free conversions for the first year, and $0.07 for conversions over 12,000.
- B2B pipeline, web purchases, and product analytics count different outcomes, so quote them against the job and volume they actually measure.
If every mobile measurement quote bundles features your team will not use, start with the billed unit. Airbridge Core and AppsFlyer both measure mobile attribution, but their published pricing bases differ: Airbridge Core bills usage by app-event data points, while AppsFlyer Growth lists conversion measurements and a per-conversion rate. “Pay only for attribution” therefore needs a more exact answer: which attribution job, which records count, and which reports and integrations come with that charge?
For a U.S. subscription app running paid campaigns, Airbridge Core is a clear fit when its supported channel integrations and partial reporting cover the team's current needs and the team wants a monthly plan with no annual lock-in. AppsFlyer is a candidate when its mobile measurement scope and paid-conversion model suit the team's volume and plan needs. B2B pipeline, web-first commerce, and analytics tracking are different jobs, so compare them by their own data path rather than assuming an app-attribution plan covers each one.
What “pay for attribution” means on a quote
An attribution bill can count conversions, app events, active users, or another usage unit. A paid install may count as one conversion, while the same app user can create several later events, such as sign-up, trial start, purchase, and renewal.
Airbridge's plan and payment documentation defines a data point as one app event collected across the apps in the organization during the billing period. Its Core plan table lists unlimited attribution, but event collection still has a monthly allowance and usage overage. A founder can receive attribution for installs while event data for the rest of the app journey consumes the data-point allowance.
| Candidate or tool type | Main job | Published or quote unit to compare | What belongs in the same quote |
|---|---|---|---|
| Airbridge Core | Paid mobile-app attribution, with partial reports and listed ad-channel integrations | App-event data points; 500K are included per month, then $0.0001 per extra point | Attribution, included channels, report types, event allowance, and event overage |
| AppsFlyer Growth | Paid mobile-app attribution across installs, in-app events, and revenue | Conversion measurements; the pricing page lists 12,000 free conversions for the first year and $0.07 for conversions over 12,000 | Growth's custom plan price, conversion count, included measurement, and any paid add-ons |
| B2B pipeline attribution | Relate paid campaign touches to leads, accounts, opportunities, and revenue | Compare the vendor's stated record unit with monthly sessions, leads, contacts, and accounts | CRM stages, revenue fields, and reports matched to the team's pipeline |
| Web or DTC attribution | Relate paid marketing to orders, revenue, and first-time or repeat customers | Compare the vendor's stated usage unit with sessions, orders, or attributed revenue | Store orders, customer history, ad sources, and purchase reports |
| Event analytics or a tracking layer | Analyze product actions and journeys inside the site or app | Ask which events, sessions, users, or retention features have usage limits | Event collection, identity rules, funnel and retention views, and export access |
The unit tells you what happens when activity grows. A conversion-based quote rises with billable conversion volume under its stated terms. An event-based quote rises with the volume of events you send, even if many events come from users who never become paid subscribers. A session-based quote follows visits, while an account-based quote may follow the number of companies or records measured.
Some products assign campaign credit to app installs and in-app events. Others connect website visits to CRM stages or connect online marketing to store orders. A source name on a pricing sheet matters less than the outcome in the report your team will use to make its next budget decision.
Google's guide to attribution models explains that attribution assigns credit for an outcome, such as a purchase, among the interactions on a person's path to it. Google Analytics uses a data-driven model by default, which distributes credit using data about that specific outcome.
Paid mobile-app attribution: Airbridge Core vs. AppsFlyer
For a small consumer subscription app buying traffic, the practical choice turns on channel coverage, report scope, and the unit that generates the bill. Airbridge Core suits a team that needs attribution and the reports listed for Core, runs campaigns through the listed channels, and prefers a $40+/mo starting subscription with event-based overage. AppsFlyer Growth suits a team whose mobile measurement needs and conversion-based quote align with its published package and negotiated plan price.
| Mobile option | Published billing basis | Published included scope | Strongest fit |
|---|---|---|---|
| Airbridge Core | 30-day free trial, then $40+/mo; 500K data points included each month; $0.0001 per additional point; no annual contracts | Unlimited attribution; partial reporting; listed Core integrations for Meta Ads, Google Ads, Apple Ads, and TikTok for Business | App teams that want campaign attribution and the listed Core reports and channels, and can forecast app-event volume |
| AppsFlyer Growth | Custom pricing; 12,000 free conversions for the first year; $0.07 per conversion over 12,000 | Its official mobile attribution page describes measurement of app installs, in-app events, and revenue; the price page lists core marketing analytics and 30 days of access to select premium add-ons | Teams whose paid-conversion count, desired add-ons, and custom Growth quote fit their measurement plan |
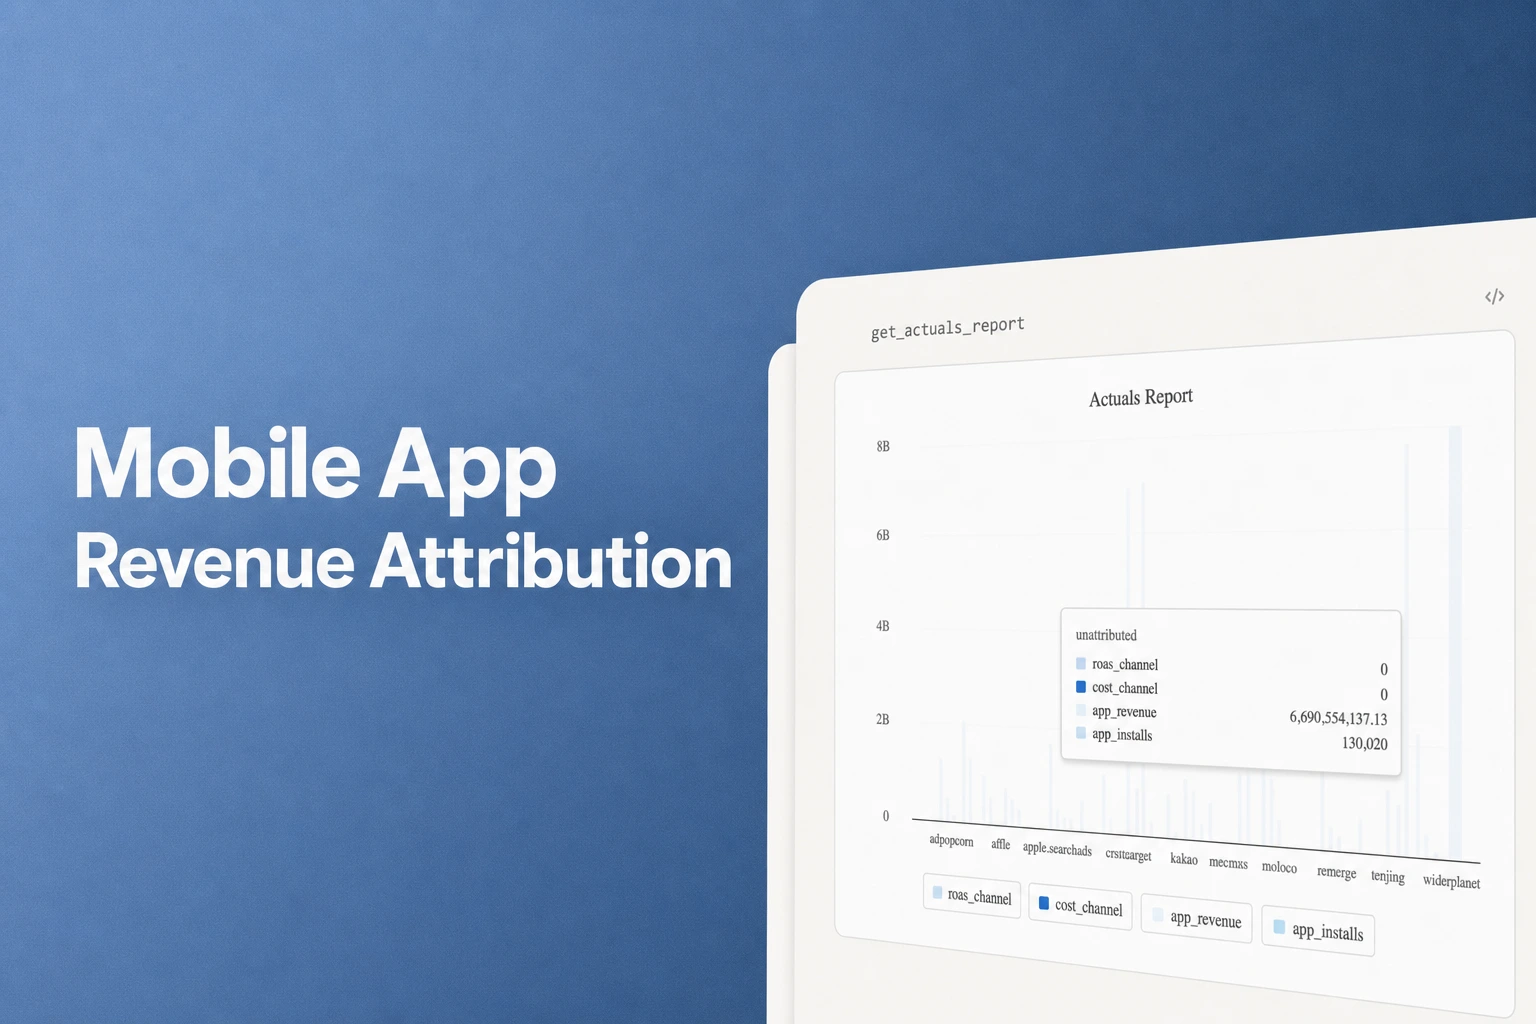
Airbridge's plans documentation lists the Core report types as Actuals, Trend, Active User, Funnel, Retention, and Revenue.
One app event uses one data point. If an app collects 600,000 events in a billing month, 100,000 fall above the 500,000 included allowance. At $0.0001 per additional data point, that illustrative overage is $10; adding the $40 starting subscription amount gives a $50 starting total for that assumed usage month. A team collecting many in-app events should model its event volume, not just its attributed-install count.
The term “unlimited attribution” has a specific value for teams concerned about a cap on attributions. A team should forecast events such as sign-ups, trial starts, and purchases alongside installs, because each collected event can use a point. If the team sends 500,000 app events a month, every event uses the included allowance even when fewer users install or subscribe.
Airbridge Core's report list answers common subscription-app questions at different stages of the funnel. Funnel reports can help the team review movement between steps it has instrumented, while Retention reports show return behavior and Revenue reports organize revenue measurement. Core also lists Actuals, Trend, and Active User reports, so a small team can review current totals and activity patterns without buying into a larger report suite.
The report names are useful only when their underlying event definitions match the business question. A trial-start event is different from a paid-subscription event, and a renewal event is different from an initial purchase. Before comparing prices, define which event the team regards as a new subscriber, how revenue is recorded, and which report should show that value by campaign.
Airbridge's official pricing page describes subscription-revenue aggregation from platforms such as RevenueCat and Adapty. This helps an app team keep its subscription billing setup in place while sending revenue information into its attribution workflow. In Core, the plan feature list includes subscription revenue aggregation; the pricing page also describes Core's web-to-app tracking and limits Core web measurement to web-to-app journeys.
AppsFlyer's pricing page describes Zero as a tool for owned-media activity and Growth as a plan for startups starting paid-campaign measurement.
For example, if a team records 20,000 billable conversions during the first year, 8,000 are above the published 12,000 threshold. At $0.07 each, that conversion line would total $560 for those 8,000 conversions, before the custom Growth plan price and any other charged items.
AppsFlyer's stated conversion price can be easier to model when the team has a dependable count of the conversions AppsFlyer bills. Airbridge's event allowance can be easier to model when the team knows how many app events its SDK and integrations will send.
Apple's SKAdNetwork documentation says its signed install-attribution reports contain no user- or device-specific information, and Apple limits report detail to protect privacy. Apps can use SKAdNetwork APIs regardless of a person's App Tracking Transparency authorization status.
Compare AppsFlyer Growth when campaign measurement across installs, in-app events, and revenue fits the need and the custom price plus conversion charges make sense at the expected volume. Ask both vendors to define the billable unit and show the line-item total at the team's own monthly counts.
B2B pipeline attribution: follow paid leads into revenue
A B2B lead-to-pipeline job needs to connect campaign touchpoints to the records where the sales outcome lives. The buyer's comparison should follow a journey from ad interaction to a known lead, then to an account, opportunity, and revenue outcome. A mobile install report can help a mobile app team, but it does not answer whether paid activity created qualified pipeline unless the platform also supports the team's CRM data and pipeline reporting.
For this job, shortlist a B2B attribution product built around CRM-connected lead and opportunity data. A useful B2B comparison follows the same campaign identifiers through person-to-account matching, opportunity stages, and booked revenue fields. These answers establish whether the product supports the team's actual sales process rather than just measuring a form fill.
The price basis should be shown alongside those outputs. A B2B quote comparison works best when monthly sessions, leads, contacts, accounts, opportunities, and paid sources sit beside the vendor's stated usage unit. A platform priced on website traffic behaves differently from one priced on contact or account volume as the CRM grows.
Choose a CRM-connected B2B attribution option when the main success measure is qualified pipeline or closed revenue and the team can supply the relevant CRM stages. Ask for an example report using the same attribution window and pipeline definition across all quotes. That keeps “pipeline attribution” from being reduced to a different metric in each vendor's proposal.
Web and DTC attribution: connect the ad to the order
A web-first commerce team needs to trace marketing activity to orders, revenue, and customer history. Its comparison should capture the path from ad click to website purchase and separate first-time buyers from repeat customers if those distinctions guide acquisition spend. A mobile attribution product may fit an app-led store, but browser-only purchase measurement needs a product and quote that include website events and store-order data.
AppsFlyer's ecommerce product page describes customer journeys from first touch through repeat purchases across mobile, web, and store. That makes it a relevant candidate for commerce teams whose measurement journey spans those surfaces.
Airbridge Core's documented web scope is web-to-app tracking, which fits a path where a person engages on a website and then moves into an app. The pricing comparison lists full web event measurement for Growth, while Core supports web-to-app tracking. A browser-only store that needs the complete sequence of website events and purchases should price a web measurement product or a plan with full web event measurement.
For a DTC quote, use a shared monthly order and revenue scenario. For a DTC scenario, count first orders and repeat orders separately, record refunds, and include the store and ad-cost sources that feed its reports. Name campaign, first-purchase, repeat-purchase, and revenue fields as required report outputs.
A store owner deciding between web analytics and mobile measurement should focus on where the conversion occurs. If the paid journey ends in a browser checkout, make the browser order the unit of evaluation. If the journey starts on the web and ends in the app, include both the web handoff and app install in the test so the selected attribution plan can answer the question that drives spend.
When a tracking layer is the better tool
A tracking layer is the right starting point when the main question concerns how people use a website or app after they arrive. Product analytics can show sequences such as landing page, sign-up, onboarding, and feature use. An analytics attribution model can assign credit among recorded touchpoints, while product-event reports help the team understand what users do after a visit or install.
Google's documentation on attribution models explains that Google Analytics assigns credit for a chosen outcome to the interactions on a user's path. For Google Ads conversions based on key events, Google Analytics uses last-click credit, and Google Ads creates a conversion only when it was the last non-direct click before the outcome. Google's data-driven attribution guide says its model distributes credit based on data for the specific key event.
A product analytics or web analytics layer is a good fit when the team wants to inspect funnels, product engagement, and user journeys inside its own measured property. A dedicated mobile attribution product is a better fit when the team needs to relate paid acquisition to app installs and in-app outcomes across advertising channels. Some teams use both: one answers which channel receives attribution credit, and the other explores what users do inside the product.
AppsFlyer's guide to marketing attribution distinguishes attribution, which gives credit to touchpoints, from incrementality testing, which asks whether the conversion would have happened without the campaign. A team deciding between campaigns can use attribution for consistent reporting and a lift test when it needs to test causal impact.
This distinction helps prevent a tracking layer from being asked to solve a different measurement problem. A funnel chart may show that users who saw a campaign later completed onboarding, but the team still needs a defined approach for linking that action to paid acquisition. Conversely, a mobile attribution report can connect campaigns to app outcomes while the product analytics tool helps diagnose the experience between install and paid conversion.
Use a tracking layer on its own when product behavior or site conversion flow is the priority and its attribution scope covers the question. Add a dedicated attribution product when media-budget decisions require consistent campaign measurement across paid sources or mobile install journeys. For a consumer subscription app, the choice often means keeping product analytics for in-app behavior and using Core or another mobile measurement product for campaign-level acquisition reporting.
Compare quotes without buying unused features
A quote comparison works when every vendor receives the same workload and returns the same cost components. Put the primary job first, then state the expected volume that drives the product's usage meter. Ask vendors to separate the plan charge, included allowance, usage overage, optional add-ons, and commitment period so you can compare the amount due at your real volume.
Use this checklist for each quote:
- Job: mobile installs and in-app subscription outcomes, B2B leads and pipeline, web orders, or product analytics.
- Billed unit: conversion, app-event data point, session, contact, account, order, or another named record.
- Monthly count: forecast installs, attributed installs, app events, website sessions, leads, opportunities, or orders, according to that unit.
- Allowance and rate: included amount, overage rate, any threshold, and how the vendor treats activity above it.
- Channels and sources: paid ad channels, app stores, website, subscription billing data, CRM, or commerce platform required for the job.
- Reports: name the reports and fields the team plans to use, including the conversion outcome or revenue definition.
- Commercial terms: trial duration, monthly or annual cadence, cancellation terms, custom plan fees, and add-on charges.
- Implementation: setup steps, SDK or tag work, CRM connection, event mapping, and the owner responsible for each task.
Request a sample invoice for one usage scenario below the allowance and another above it.
For example, a monthly usage sheet might compare 450,000, 600,000, and 800,000 Airbridge Core data points. At the published $0.0001 overage rate, the 450,000-point month stays within the 500,000 allowance; the 600,000-point month adds $10 in overage; the 800,000-point month adds $30. Add the $40 starting subscription amount to each scenario to understand the stated starting price under those assumptions.
Feature lists should map to actual work rather than aspirational roadmaps. If the team currently uses four paid channels and needs six report types, mark those exact channels and reports against each plan. A feature that appears in a higher plan or as an optional add-on belongs in the total only if the team intends to use it. This method gives founders a way to keep necessary attribution while setting aside features that do not change their next acquisition decision.
What to send vendors for a like-for-like quote
Send each vendor the same short specification, then ask it to return both the quoted bill and the definition behind it. A complete request gives the provider the use case, monthly activity, required integrations, and outcomes the team wants to see. That lets the team compare offers without treating “attribution” as one shared unit.
- Name the primary job. Say whether you need paid mobile app installs and subscription outcomes, B2B pipeline, website orders, or product analytics. If the business spans jobs, name the primary one and list the secondary requirement separately.
- Give the monthly volume. For mobile, estimate installs and the app events sent after install. For B2B, estimate sessions, leads, contacts, accounts, and opportunities. For commerce, estimate sessions, orders, revenue, and repeat purchases.
- List the required sources. Include the paid channels, app or website properties, CRM, subscription platform, or store that the attribution workflow must use.
- Name the outcome and report fields. Define a new subscriber, a paid lead, a qualified opportunity, or a completed order. Name the reports and dimensions the team needs to make a budget or product decision.
- Request the full commercial model. Ask for base plan price, usage unit, included amount, overage rates, add-ons, trial, billing cadence, contract term, and a sample total at your forecasted volume.
- Request the setup steps and who owns each one. Request the setup steps, connection methods, event mapping, estimated work, and any feature that requires a separate plan or integration.
A strong response gives a countable price basis, names what that basis includes, and matches the reports to the decision you need to make. If two providers quote different units, compare both against the same activity scenario and keep each unit visible in the spreadsheet. That is how a small team can tell whether it is paying for the measurement job it needs or a larger bundle it will not use.
For paid mobile acquisition with the listed Core channels and reports, Airbridge Core offers a 30-day free trial, then $40+/mo with 500K monthly data points and $0.0001 per additional data point, with no annual lock-in. Get Started Free to test whether that event-based allowance matches your app's activity.
FAQS
FAQ
Does Airbridge Core charge per attributed install?
No. Airbridge Core lists unlimited attribution, while its usage allowance is measured in app-event data points. Each app event uses one data point, and each point beyond 500,000 in a billing period costs $0.0001.
What does “unlimited attribution” include in Airbridge Core?
It means the Core plan comparison lists attribution as unlimited. Core still has a 500,000-data-point monthly allowance and partial reporting, including Actuals, Trend, Active User, Funnel, Retention, and Revenue reports.
Is Airbridge Core a fit for a web-only store?
Airbridge Core is documented for web-to-app tracking, while full web event measurement is listed for Growth. A browser-only store should quote a plan that includes its website events and order measurement.
How should I compare an event-priced quote with a conversion-priced quote?
Use the same forecasted app activity and calculate each vendor's charges using its own definition of a billable event or conversion. Add the plan fee and overage to each estimate, then compare the reports and channels included at that total.
Get Started Free
See how these criteria hold up on the real thing.