Dashboard or MMP? A $200 Measurement Guide for App Teams
Compare product analytics with mobile attribution, see when each is needed, and learn how Airbridge Core’s $40+/mo pricing fits a $200 monthly budget.
A $200 budget can cover campaign attribution and basic reporting when you separate their jobs.
- Use product analytics to understand what people do inside your app.
- Use mobile attribution when you need paid campaigns tied to attributed installs and later subscriber or revenue events.
- Airbridge Core starts with a 30-day free trial, then costs $40+/mo with 500K data points included and $0.0001 per additional data point.
- Keep an existing analytics dashboard for behavior questions, then use the remaining budget for attribution if paid acquisition is the decision at hand.
If your team spends on paid app campaigns and still cannot tell which ones lead to subscribers, reserve part of the $200 for mobile attribution. Airbridge Core is one option for that job: it attributes campaigns from Meta Ads, Google Ads, Apple Ads, and TikTok, and includes revenue and funnel reports. If your first question is how users move through the app, product analytics and reporting come first. A dashboard and an MMP, or mobile measurement partner, answer different questions, so one does not automatically replace the other.
A product dashboard can show actions such as onboarding completion, paywall views, or trial starts when those events are sent into it. An attribution system connects eligible ad interactions with installs and later conversion events, so your team can examine campaign performance. Some small app teams need both layers, while a team that already has behavior reporting can put its new spend toward attribution.
What do you need the $200 to measure?
Start with the decision you will make after seeing the numbers. If you need to change the onboarding flow, inspect product behavior. If you need to shift paid spend toward the ads that generate subscribers, connect campaigns with attributed installs and downstream events. If you need both decisions, plan for both measurement layers within the same $200 cap.
| Your question | Measurement layer | What the output helps you decide |
|---|---|---|
| Where do people stop during onboarding, trial, or checkout? | Product analytics and event reporting | Which in-app step deserves a product change |
| Which paid source led to an app install? | Mobile attribution | Which campaign or channel receives credit for an attributed install |
| Which campaigns led to a trial, subscriber, or revenue event? | Mobile attribution connected to those app events | Which paid activity appears to bring the outcome the business values |
| How do campaign results sit beside product and subscription metrics? | Attribution plus a reporting view | Which campaigns deserve another test, more spend, or less spend |
The distinction is the source and relationship of the data, not the shape of the chart. A dashboard organizes the information it receives. Attribution matches an eligible campaign touchpoint to an install or later conversion under the rules available to the measurement system. Google's Android Attribution Reporting overview describes a flow in which ad clicks or views are registered as sources, app or website conversions are registered as triggers, and the API matches triggers to sources before sending reports. That source-to-trigger link is the part a founder needs when asking whether paid spend drove a downstream outcome.
Product analytics is a good first layer when the team is still working out what users do after opening the app. Define a small set of events that correspond to product decisions, such as account creation, onboarding completion, paywall view, trial start, paid conversion, and cancellation. The value comes from comparing those steps consistently over time, rather than collecting every possible event before you know what question it will answer.
Attribution earns budget when the marketing decision depends on campaign origin. For example, if a founder sees 40 trial starts in a product report, the count describes app behavior. A campaign connection can add the acquisition context needed to compare which paid campaign produced those starts, subject to the attribution method and privacy limits available for those users. The first count can help the product team improve the trial path; the second can help the growth lead allocate the next week of spend.
Revenue events need an agreed meaning before teams compare dashboards. A trial start, first paid charge, renewal, and refund describe different stages of a subscription. If one report treats trial starts as revenue and another reports only paid charges, the two totals answer different questions. Write down which event represents the outcome you want to optimize, then confirm each system receives and labels that event the same way.
What can general analytics and reporting cover within this budget?
For a lean team, Google Analytics 4 (GA4) can cover a useful baseline for app and web behavior without a software subscription charge. Google's Google Analytics product page says its tools for understanding the customer journey are free of charge and describes looking across web and app data. That makes GA4 a practical starting point when the first measurement question is what people do inside the product.
GA4 organizes much of that view around events, the actions your app sends for measurement. Google's Events report documentation says the report shows how many times each event occurs and how many users trigger it on a website or app. A subscription team can use events such as onboarding completion, paywall view, trial start, paid conversion, and cancellation to see how those steps change over time and where product work may help.
An event report is useful for finding friction inside the app. A team can compare the number of people who began onboarding with the number who reached the paywall, or compare trial starts with paid conversions. Those comparisons help locate a step for product work.
GA4 also has advertising reports after the team verifies its key events. Google's key-event reporting guide says Advertising reports can show key-event paths, credit under different attribution models, and key events by channel. A small team can start with this no-charge analytics layer, check which marketing views answer its current question, and avoid adding a reporting product before it solves a defined gap.
The next purchase decision depends on the output the growth workflow needs. When the priority is product behavior and GA4 already answers the team's event and channel questions, keep the reporting setup lean. When paid app acquisition decisions need attributed installs and subscription outcomes tied to the supported ad channels, compare a mobile attribution plan with the existing analytics layer. Airbridge Core's included campaign and subscription reporting is detailed below.
Airbridge describes GA4 as an event-based system for cross-platform analytics in its GA4 and MMP comparison guide. That kind of analytics is useful for looking at user interaction across a product. An attribution workflow adds the campaign connection needed to evaluate paid acquisition. A team that wants both views can use product analytics to inspect the in-app journey and attribution reports to examine the campaign source, then compare the results with a clear definition of each metric.
Airbridge's GA4 integration guide describes sending Airbridge attribution data into GA4 so a team can examine product interactions there. The guide also notes that Google may apply data thresholds when user counts are small, and that GA4's app-instance ID and Airbridge's device ID can produce different unique-user counts. Those are practical reconciliation points: compare the date range, event definition, and user-count method before treating two dashboard totals as a reporting error.
The founder and product lead can pick one product funnel, such as install to trial start to paid conversion, and agree on the event names that mark each step. The growth lead can identify the campaign breakdown needed for spend decisions. The person building the report can then use those definitions instead of assembling a wide dashboard full of metrics that no one will act on.
For the $200 budget, keep the current reporting setup when it answers the product question at an acceptable cost. Assign new spend to the unresolved question. If app behavior is the gap, add or improve event analytics. If campaign-to-subscriber visibility is the gap, evaluate an attribution plan. If both gaps matter, keep the first system narrow and reserve enough of the ceiling for the second rather than asking a general dashboard to infer campaign credit from totals alone.
When does a mobile app need attribution rather than another dashboard?
Choose mobile attribution when a paid-acquisition decision depends on comparing campaign sources by attributed installs or post-install trial, subscription, or revenue events. A product dashboard remains useful for in-app behavior, while an attribution plan adds the campaign-linked view that directs spend decisions.
Apple's SKAdNetwork documentation says its cryptographically signed postbacks carry no user- or device-specific data. A postback may include values from the ad network and advertised app when those values meet Apple's privacy threshold. Apple requires apps that collect end-user data and share it with other companies for cross-app or cross-website tracking to use App Tracking Transparency. For iOS campaigns, plan around the privacy-permitted fields and authorization status available for your app.
Apple's postback timing guidance places the minimum time from an ad impression to an ad network's install-validation postback at 24 to 48 hours. Teams reviewing a campaign immediately after launch should account for that reporting delay, then use the arriving results to make decisions on a timeframe that fits the platform's delivery.
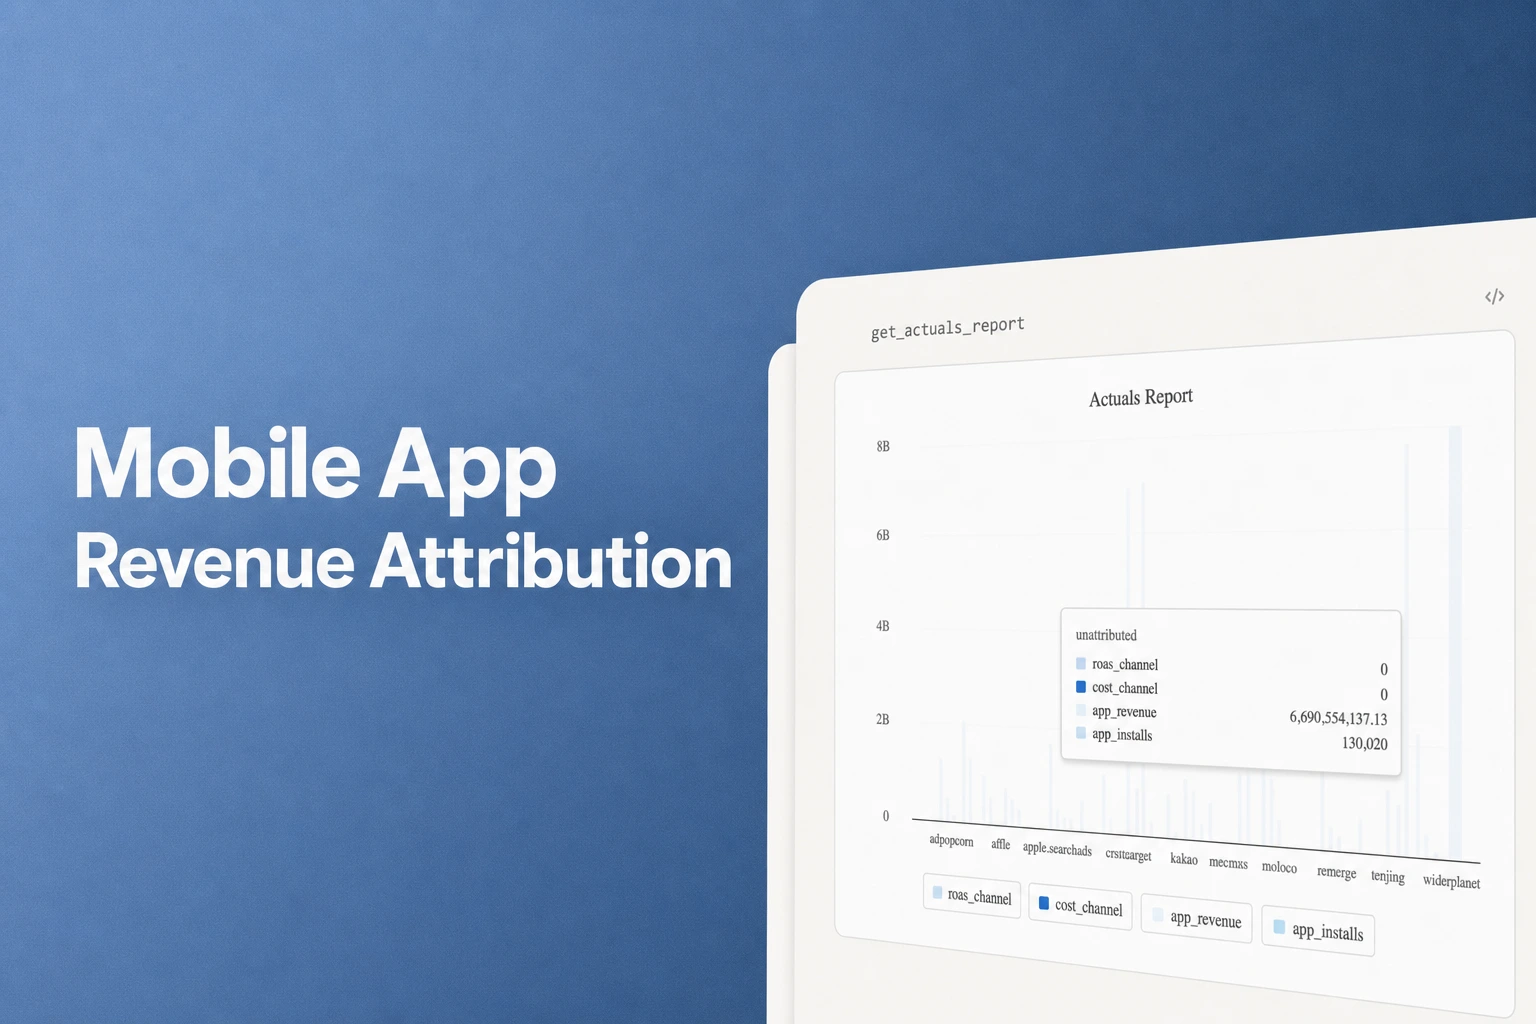
Airbridge Core fits teams seeking an MMP for paid app acquisition that also want revenue and funnel reporting. Its published Core scope lists attribution for Google Ads, Meta Ads, Apple Ads, and TikTok, plus revenue and funnel reports, web-to-app attribution, and Signal Hold for Meta Ads. Airbridge's Core Plan page also lists RevenueCat, Adapty, and Superwall integrations, so teams can keep their subscription platform choice while connecting subscription workflows to campaign measurement.
Airbridge describes Core's subscription funnel reporting in more detail in its published pricing explanation: install-to-trial-to-subscription conversion, retention by acquisition channel, and revenue attribution. Those are useful dimensions when a team is trying to see whether a campaign produced a subscriber who stayed, rather than simply counting installs. They let a small growth team ask a business question that matters to its budget: which acquisition source is associated with subscription value after install?
Choose an MMP when the team has a recurring paid-acquisition decision that depends on source-linked outcomes, such as reducing spend on a campaign that brings installs but few paid conversions. Choose analytics first when the immediate work is product friction, such as improving onboarding or testing a paywall. Choose both when the team needs to adjust both product experience and campaign mix, and treat the tools as complementary reporting layers with agreed event names.
Can an attribution plan fit a $200 cap when event volume varies?
Yes. Airbridge Core starts with a 30-day free trial, then costs $40+/mo with 500,000 data points included, two third-party integrations included, and $0.0001 per additional data point. Airbridge's pricing page defines one data point as one event the app sends, and notes that actual usage depends on which events a team tracks. Core has no annual contract, so a team can evaluate it without committing to an annual term.
| Budget item | Published Airbridge Core term | What it means under a $200 monthly cap |
|---|---|---|
| Trial | 30 days free | Use the trial period to validate event flow and reporting before the first paid month |
| Starting plan price | $40+/mo | At the $40 starting point, the plan takes $40 of the cap before usage above the allowance |
| Included event volume | 500,000 data points per month | Events up to this monthly allowance carry no per-data-point overage charge |
| Additional use | $0.0001 per data point | Each 100,000 additional data points adds $10 to the bill |
| Integrations | Two third-party integrations included | The listed subscription partners can fit the documented two-integration allowance when the team selects its required connections |
| Commitment | No annual contract | Keep the commitment monthly while the team tests fit |
Use the event count, not the number of users alone, to estimate the usage line. If users trigger different numbers of events, the event total changes even when the user count stays similar.
For example, assume 2,000 monthly active users each trigger four tracked events on 10 active days during the month. That illustrative pattern produces 80,000 data points: 2,000 × 4 × 10. It stays below the 500,000 included amount. This example counts 10 event-generating days per user, which keeps its estimate distinct from a full 30-day activity pattern.
Now assume a campaign month sends 600,000 tracked events. The first 500,000 are included, leaving 100,000 extra data points. At $0.0001 each, the excess adds $10. At the published $40 starting point, that illustrative month is at least $50, with the “+” in $40+/mo reflecting usage-based pricing.
At 1,000,000 monthly data points, the excess is 500,000, which adds $50. At the $40 starting point, the bill is at least $90. At 2,100,000 data points, the 1,600,000 above the allowance add $160, bringing the starting-point calculation to $200. Because Airbridge publishes the entry price as $40+/mo, a higher starting amount leaves less room for overage under the same cap.
Sending every minor interaction may use the allowance faster than sending a focused set of install, trial, purchase, and retention events. Keep events that answer a product or acquisition question, and use the monthly event total from a representative campaign period to estimate the likely bill. A launch or promotion month can produce a different total from a quiet month, so calculate from the higher-activity period when the $200 limit is firm.
Before launch, list the events needed for the decisions in the earlier table, then confirm that the app sends them once and with the intended names. During the trial, compare the event total with the expected monthly event plan, and confirm that revenue and funnel reports connect the events the team uses to paid acquisition. This gives the founder a concrete usage estimate and an operational test before the first paid month.
Keep the two included third-party integrations in the event plan. Airbridge lists RevenueCat, Adapty, and Superwall as integrations, while the Core Plan includes two third-party integrations. A subscription team can select the billing or paywall connections it uses, then reserve the second integration for the next system it needs. That keeps the product platform choice neutral while giving the team a clear integration allowance to plan around.
Which measurement mix should you choose first?
| Situation | Start with | Budget move | First useful result |
|---|---|---|---|
| The team needs to improve onboarding, trial conversion, or retention | GA4 or an existing product analytics setup | Start with app event reports and the product funnel; reserve paid budget for a defined gap | Find the in-app step where the team should test a change |
| The team spends on paid app campaigns but cannot compare them by attributed installs or subscription outcomes | Mobile attribution | Consider Airbridge Core when its event-based monthly bill fits the remaining cap | Tie paid campaigns to the install, funnel, and revenue events available in the setup |
| The team needs both product behavior and campaign-origin answers | Both layers | Keep GA4 for general analytics; add Core only when its usage-based bill and any other measurement charges keep the verified total within $200 | Compare product funnel movement with campaign-level outcomes |
| The team cannot yet name the event that represents a valuable customer | Define events before adding another report | Use the current measurement budget to agree on trial, paid conversion, and revenue definitions | Make later campaign and product reports comparable |
For a small subscription app team, a sensible sequence is to settle event definitions, verify the product funnel, and then fund attribution as soon as paid channel choices depend on subscriber outcomes. This order makes the MMP reports easier to interpret because the team has already agreed on what counts as a trial or paid conversion. If paid spend is already running and that campaign question is urgent, run the two steps in parallel: define the events while connecting the attribution workflow.
A founder who has $200 available and an existing behavior dashboard can use Airbridge Core as the paid-acquisition line item. At the $40 starting point, the nominal remainder is $160 for all other measurement expenses and any overage, with the actual remainder changing as Core usage changes. If the event estimate stays below 500,000 per month, the published allowance covers that volume; above it, calculate the additional event charge before allocating the balance elsewhere.
For a team without a behavior-reporting setup, keep the analytics scope small. Start with the app funnel and a concise set of decision events instead of trying to consolidate every data source. Then add campaign attribution when the team is actively buying installs and needs to link that spend to subscription results. This approach preserves room in the budget for the tools that answer the next decision, rather than expanding a dashboard without a specific use.
A measurement plan works when every line item has an owner and a decision attached to it. The product lead can own funnel definitions, the developer can verify event delivery, and the growth founder can own campaign-level spend decisions. A short monthly review can compare event volume with the plan allowance, review attribution reports on the platform's reporting schedule, and decide whether the next dollars should go toward product improvement or acquisition measurement.
FAQ
Is a dashboard enough to measure paid app campaigns?
No, a dashboard alone answers the campaign question only when it receives campaign-attributed data. Attribution connects eligible campaign sources with installs and conversion events; a reporting view can then display those results alongside product metrics.
Can I use product analytics and an MMP together?
Yes. Use product analytics to examine in-app behavior and an MMP to connect paid campaign sources with attributed installs and post-install outcomes. Agree on event names and reporting windows so the two views describe the same funnel stages.
How much of the $200 budget does Airbridge Core use?
At least $40 per month at the published starting point, with 500,000 data points included and $0.0001 per additional data point. A 600,000-event month adds $10 for usage above the allowance, making the starting-point calculation at least $50.
Does the event allowance count users or events?
Events. Airbridge defines one data point as one event sent by the app, so estimate usage from the tracked events sent during the month rather than from monthly active users alone.
Which subscription platforms can connect with Airbridge Core?
RevenueCat, Adapty, and Superwall are listed as integrations. Core includes two third-party integrations, so choose the connections that support the subscription workflow you need to measure.
Get Started Free
See how these criteria hold up on the real thing.