UGC Handbook / Lesson 12 of 14 / Chapter IV: Measure & scale
Follow every video to subscription revenue
Two videos. Same creator, same week, roughly the same views and the same number of installs.
One sends people who start a trial and pay. The other sends people who cancel within the hour. If your tracking stops at installs, those two videos look identical, and you pay and boost them the same.
RevenueCat's data says cancellations come fast: 55.4% of all 3-day trial cancellations happen on Day 0. Whether a video made money is decided after the install, so that is where the measurement has to reach.
Installs are not the finish line
Most UGC dashboards end at "downloads."
RevenueCat's State of Subscription Apps 2026 (over 115,000 apps, more than $16 billion in revenue) shows how much is decided after the install. Apps with a hard paywall (no free use, the trial or purchase gate comes first) convert trials to paid at a median of 10.7% by Day 35. Freemium apps (a free tier with a paid upgrade) convert at 2.1%, roughly a 5x gap, and revenue per install at Day 60 is $3.09 for hard paywall apps against $0.38 for freemium.
Same install, up to 8x difference in what it is worth. Install counts tell you almost nothing about revenue.
Cheap trials are a trap of their own. A RevenueCat blog post on creative testing warns that if your campaign optimizes for trial start, some creatives will show a low cost per acquisition (CPA) but "very poor conversion to paid subscription afterward." The post's explanation is that algorithms over-deliver to 18 to 24 year olds, who are "curious enough to try the app but rarely subscribe."
A creative can win on installs, win on trials, and lose on revenue.
The decision happens fast. One RevenueCat author, mapping conversion windows for an app by hand in 2018, found that "over 80% of all subscriptions happened within two minutes of download." One app, in 2018, measuring time to subscribe rather than trial-to-paid, so read it narrowly: people decide to start paying fast, but the paid verdict on a video still has to wait for its trials to end.
Wire three events, then stop touching them
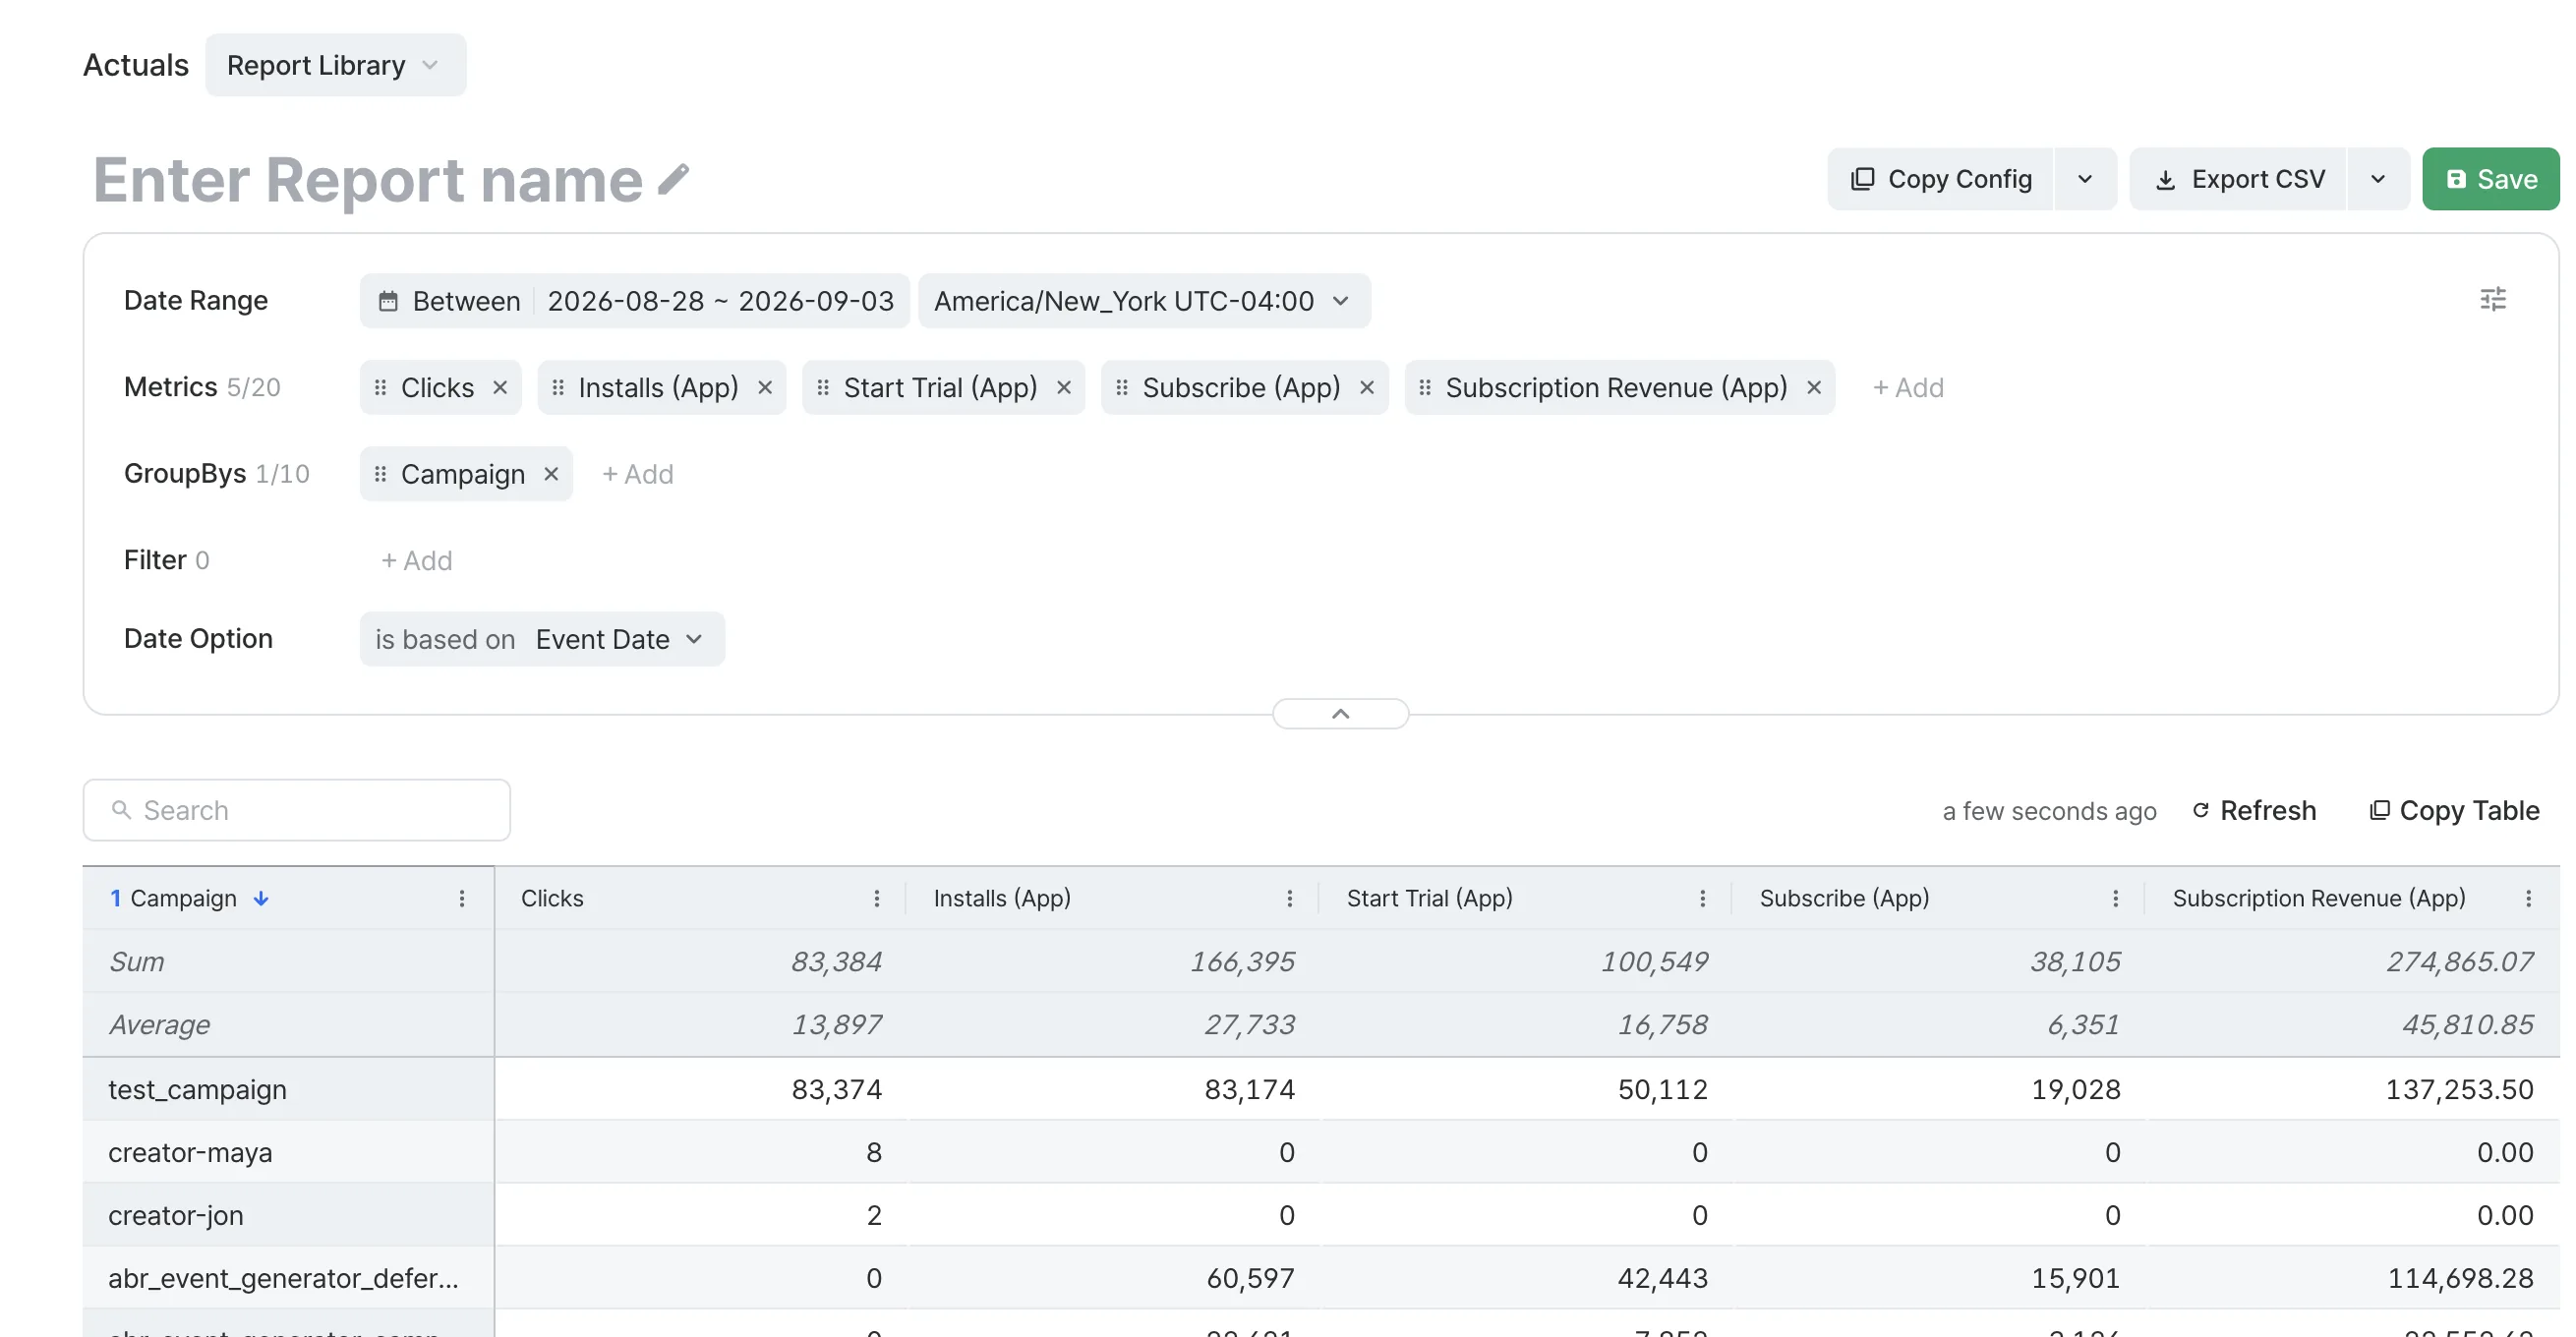
Airbridge tracks subscriptions with three standard events, and on the Core Plan you don't get to invent a fourth: Start Trial, Subscribe, and Unsubscribe. Revenue rides on Subscribe: the event carries a value and a currency, is marked as revenue, and the report sums it.
Two ways to send them, and pick one, not both, or you count each purchase twice.
Path A: your app's SDK. Your app fires Start Trial when a trial begins and Subscribe when a purchase, a trial conversion, or a renewal goes through, with the amount and currency attached and the event marked as revenue. Unsubscribe fires on cancellation.
Path B: the RevenueCat integration. If RevenueCat handles your subscriptions, connect it and the mapping is fixed: RevenueCat's trial started becomes Start Trial, initial purchase / trial converted / renewal become Subscribe, and cancellation becomes Unsubscribe. The condition: the same user ID and device ID reach both systems, so the event lands on the install the tracking link brought in.
One limit: this covers in-app purchases. Subscriptions sold on a web checkout page are outside what this setup measures.
Read every creative against a benchmark
A number alone is not a verdict. "Creator Maya's videos convert 6% of trials" is good or terrible depending on the comparison, so put a benchmark in the next column.
External benchmarks, with their qualifiers. From the same RevenueCat report:
- Trial-to-paid by Day 35: median 10.7% for hard paywall apps, 2.1% for freemium.
- Trial length matters to the rate: trials of 17 to 32 days convert at a median of 42.5%, trials under 4 days at 25.5%. A short-trial app should not measure itself against the long-trial number.
- These two are different cuts of the data (by paywall model, by trial length), so pick the one family that matches your setup and do not combine them.
- Day 0: 55.4% of 3-day trial cancellations happen on the first day, and 84% between Day 0 and Day 1.
- Annual plans: the first month accounts for 35% of all annual cancellations. Revenue from a video is not safe the day it is booked.
Your internal benchmark beats all of these. The comparison that decides budget is video against video, inside your own account: if your average trial-to-paid is 8% and one creative sits at 14% with a real sample behind it, that creative is your winner regardless of what any report says.
What a full scorecard looks like. Mojo, whose team wrote up its AI ad experiments on the RevenueCat blog, built a video from a custom AI avatar and then dubbed it with ElevenLabs for Brazil. Their Brazil line for that one creative: click-through rate (CTR) 4.5%, conversion rate 3.1%, CPA $8 (31% below the human control), return on ad spend (ROAS) 2.1x. That is the shape to copy, one line per creative from click to return, and per market, since the same stack "failed" in France and Germany.
Creator cost is your number, not the tool's. Airbridge has no record of what you paid a creator for an organic post, so customer acquisition cost (CAC) for organic creators is a manual division: your creator spend ÷ paid subscribers from Airbridge for that Campaign. If you boost a video and connect the ad account you boost from, that spend flows in automatically and CAC and ROAS appear for the boosted videos.
Real example. Planfit, a fitness app with 1.5M+ users, tested creator-led UGC against in-house and routine-based creatives, then used Airbridge to find which in-app event predicted paid conversion best. Free trial start won, they optimized toward it instead of installs, and CAC fell 40%. The full funnel view came from connecting Airbridge with RevenueCat and Amplitude. Read the Planfit case study.
Then write down your comparison:
Do this before the next creator posts
- Decide your benchmark pair. Pick the external rate that matches your setup from the list above, and write your own current trial-to-paid rate next to it.
- Wire the events once. SDK or RevenueCat integration, not both. Confirm Start Trial and Subscribe appear in the Actuals metric list before any UGC goes live.
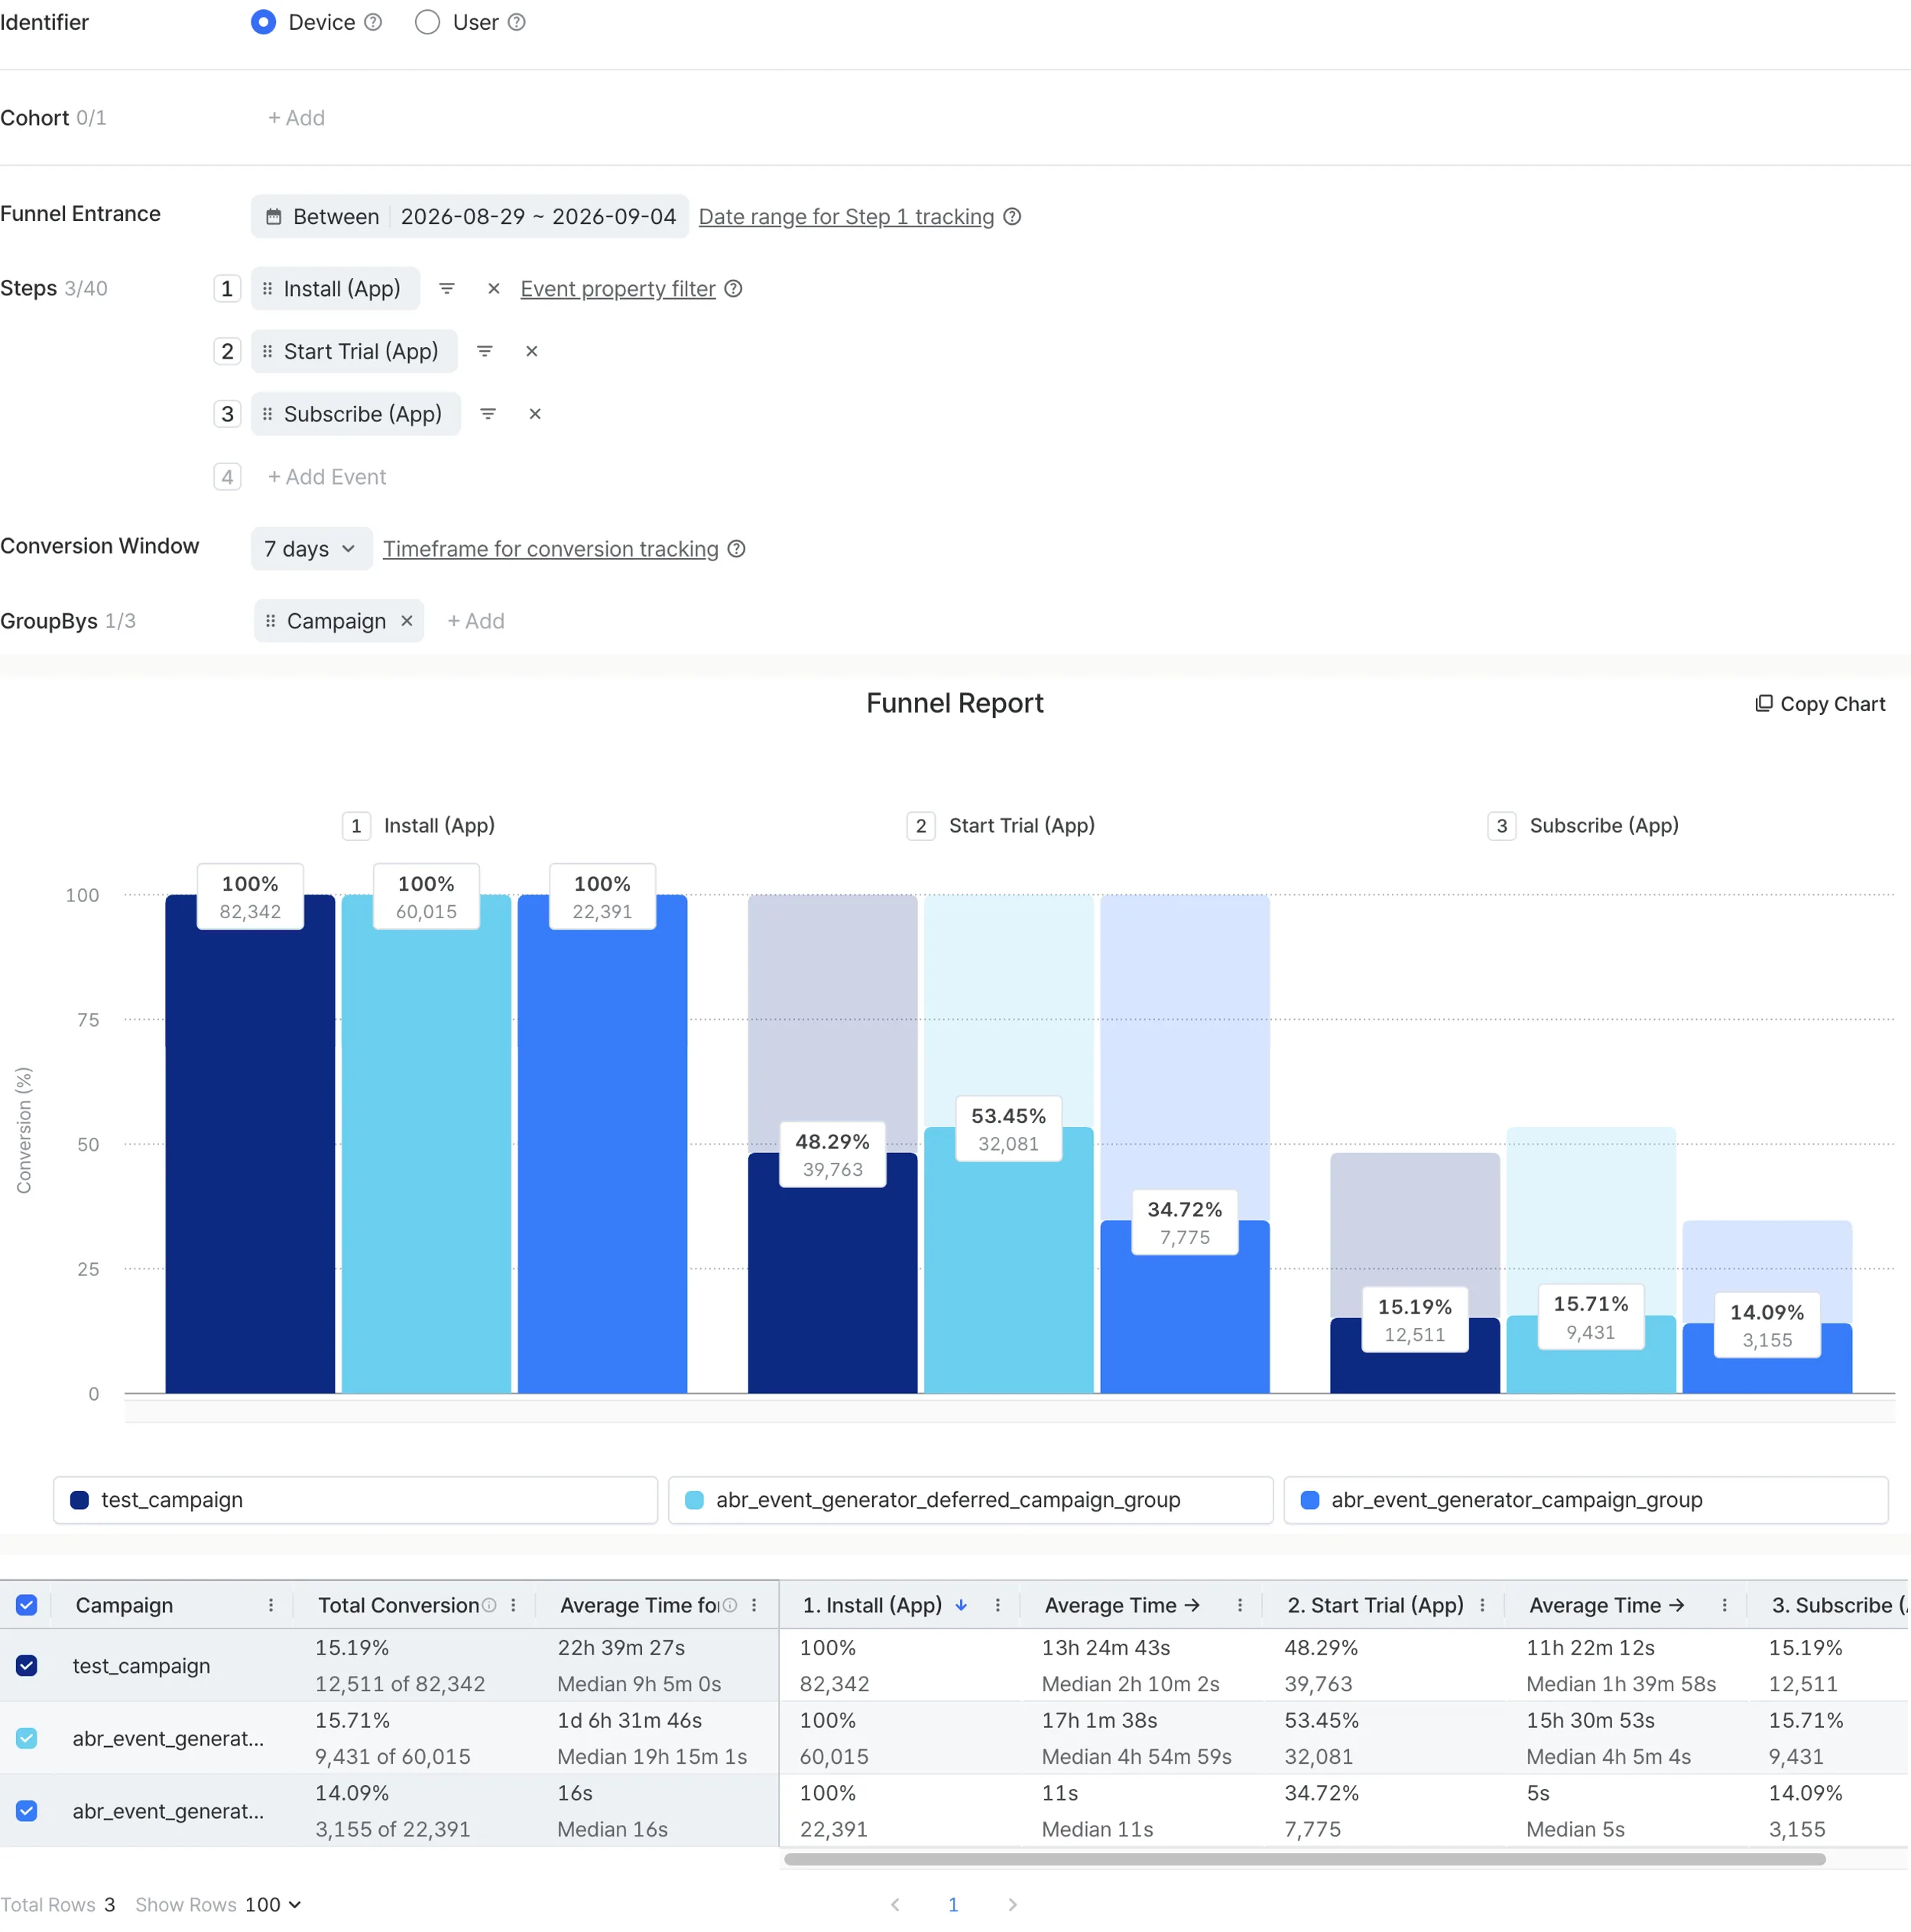
- Build the sheet below with one row per Ad Creative. Fill clicks, installs, Start Trial, Subscribe, First Subscribe, and Revenue from Airbridge weekly. Fill creator spend from your own records.
- Compute two ratios per row: trial-to-paid (First Subscribe ÷ Start Trial) and creator CAC (spend ÷ First Subscribe). Airbridge ships First Subscribe (App) as its own metric next to Subscribe (App), which is the one you want here: plain Subscribe fires again on every renewal, and First Subscribe counts only the first Subscribe event per device. Flag any creative whose trial-to-paid sits below your internal average despite good installs.
- Wait for the sample. A creative with 3 trials has no rate yet. Set a minimum trial count before you judge, and mark rows below it as Watch, not Kill.
- Re-read Unsubscribe after 30 days. A creator whose subscribers stay is worth more than one whose subscribers spike.
WorksheetPer-Creative Revenue Sheet
One row per video. (A) = Reports → Actuals grouped by Campaign / Ad Group / Ad Creative. (you) = your own records or arithmetic.
| Campaign (creator) | Ad Group (angle) | Ad Creative (video) | Clicks (A) | Installs (A) | Start Trial (A) | Subscribe (A) | First Subscribe (A) | Revenue (A) | Creator spend (you) | Trial→paid % (First Subscribe ÷ Start Trial) | Creator CAC (spend ÷ First Subscribe) | Benchmark % | Decision |
|---|---|---|---|---|---|---|---|---|---|---|---|---|---|
| creator- | angle- | hook-__ | $ | % | $ | % | Scale / Iterate / Watch / Kill | ||||||
| creator- | angle- | hook-__ | $ | % | $ | % | Scale / Iterate / Watch / Kill | ||||||
| creator- | angle- | hook-__ | $ | % | $ | % | Scale / Iterate / Watch / Kill |
Minimum trials before a row gets a Decision other than Watch: .
First Subscribe (App) is a metric in the Actuals list, sitting beside Subscribe (App). Use it for both ratios: Subscribe counts every renewal, First Subscribe counts only the first Subscribe event per device, so renewals are not in it.
In short
- A video can win on installs and lose on revenue. Follow each creative through Start Trial → Subscribe → Revenue, or you are paying for the wrong ones.
- Wire the three standard events once (SDK or RevenueCat integration), then read one funnel row per video in Reports → Actuals.
- Put a benchmark in the next column: 10.7% Day-35 trial-to-paid for hard paywall apps, 2.1% for freemium, and your own account average above both.
Ready to see which of your videos actually pays?
Start a 30-day free trial → No sales call.