How to Track Cost per Install Across Ad Channels
Track channel CPI with matched spend, attributed installs and attribution rules, then compare trials, paid subscriptions and retention before shifting budget.
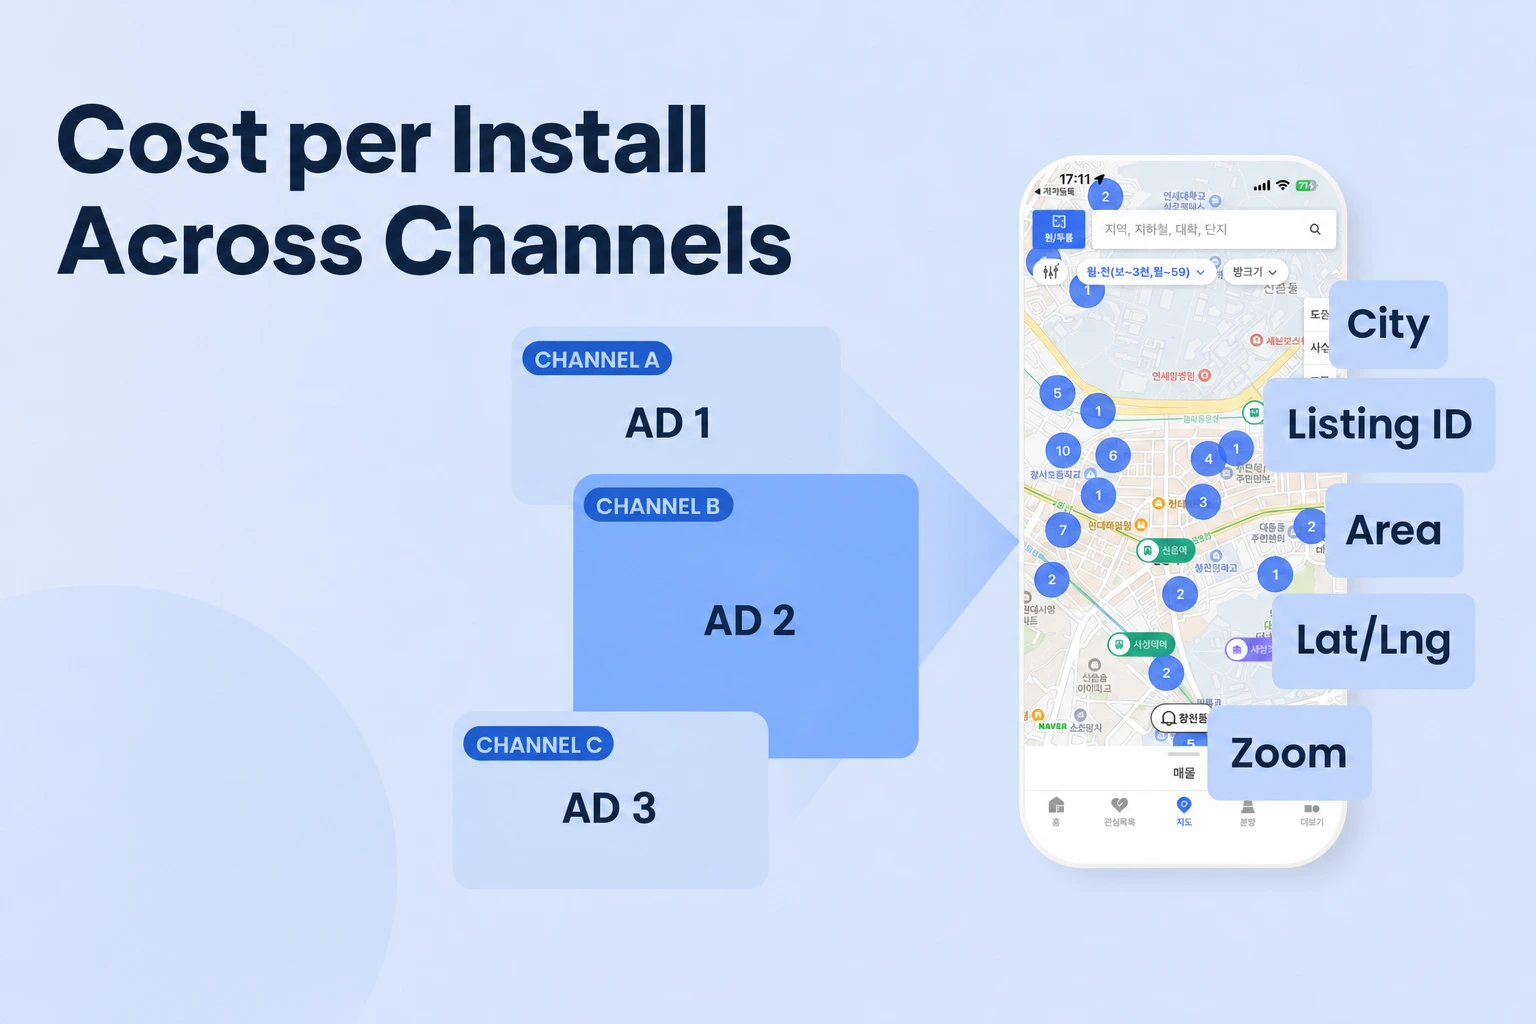
Compare channel CPI with one consistent install definition.
- Divide each channel’s spend by its attributed installs for the same period.
- Match time zone, attribution windows, click and view rules, and reinstall treatment.
- Read CPI beside trial starts, paid subscribers, and retention before shifting budget.
- Airbridge Core fits teams using its Google, Meta, TikTok, and Apple integrations, with cost and ad-spend aggregation included.
When paid ads bring installs but no new subscribers, compare each channel’s cost per attributed install and then follow those cohorts through trials and paid subscriptions. This guide gives you a repeatable way to connect campaign spend with credited installs, reconcile different reports, and decide whether a lower CPI deserves more budget.
For a lean subscription-app team buying on Google, Meta, TikTok, and Apple, Airbridge Core pairs attribution with included cost and ad-spend aggregation.
1. Define CPI by its denominator
CPI is the amount spent to acquire one install. For channel comparisons, calculate it as that channel’s campaign spend divided by the number of installs attributed to that channel during the same reporting period. “Attributed installs” means installs credited to the channel under the attribution settings in the measurement report you selected.
AppsFlyer’s dashboard metric definition calls eCPI an average effective cost per install and gives the formula as cost divided by attributions. That is a useful model for a cross-channel scorecard: state the cost source and attributed-install report beside the value, so “$5 CPI” means something specific rather than a number detached from its measurement rules.
CPI can also refer to a payment model. Adjust’s cost-model glossary describes a CPI model in which an advertiser pays when a user clicks an ad and then installs the advertised app. That describes when the advertiser pays. An effective CPI is a result calculated after spend and installs are counted, whether the campaign was bought on a cost-per-install basis, cost per click, or another pricing arrangement.
Use attributed installs for the denominator when the goal is to compare paid channels. Store downloads, clicks, and total app installs answer different questions. A download total can include organic installs, and clicks can occur without an install, so neither gives the same denominator as campaign-attributed installs.
Before opening a report, choose the actual business question:
- Trial acquisition cost: channel spend divided by trial starts credited to the channel.
- Paid-subscriber acquisition cost: channel spend divided by new paid subscribers credited to the channel.
CPI answers the first question only. If you need to know which campaigns bring paying subscribers, calculate a cost per paid subscriber using the same spend basis and an agreed period for users to start paying. Keep CPI in the report because it explains install economics, and add the downstream measure because subscriptions pay the bills.
AppsFlyer’s iOS Single Source of Truth guide calculates Campaign eCPI as cost divided by all non-organic installs. In that guide, the non-organic total adds non-organic AppsFlyer installs to unique installs reported through Apple’s SKAdNetwork when AppsFlyer’s af_attribution_flag is false.
2. Align the rules before comparing channels
Two channel CPI values are comparable when they use the same app, market, period, spend basis, install definition, and attribution rules. Decide these settings before looking for the lowest number, then preserve them in the report or exported scorecard.
| Comparison setting | What to align | Why it changes the decision |
|---|---|---|
| App and platform | The same app, iOS or Android, and relevant market | Different store, platform, or market mixes can change campaign costs and audience behavior. |
| Reporting period | Start and end dates, plus the reporting time zone | A boundary at midnight can place the same event in different days across reports. |
| Spend basis | The source of the spend figure and the cost types included | A network cost total and an MMP-imported cost total may cover different records or dates. |
| Attribution window | Click and impression lookback windows for each source | Longer eligibility windows can credit more touchpoints and change attributed-install counts. |
| Attribution method | Click-through and view-through treatment | A click and an impression follow different matching rules and can credit different channels. |
| Reinstall treatment | Whether a returning user counts as a new install, reattribution, or another event | Mixed reinstall rules can put returning users in one channel’s denominator but not another’s. |
| Campaign mapping | Stable campaign names or IDs across cost and install data | Consistent identifiers let you compare spend and installs at the same level. |
| Privacy reporting | Which iOS install details a postback includes | AppsFlyer’s SKAdNetwork guide says Apple privacy tiers can withhold conversion values, the source app ID, or the complete source identifier from a postback. |
Set the reporting time zone once for the app. Airbridge’s time-zone guide states that attribution data uses the time zone registered for the app in Airbridge. Airbridge says the app time zone is selected during registration and cannot be changed after the app is registered, so set it before creating your comparison, as its time-zone guide explains.
Set attribution windows with the same care. Adjust’s app-level attribution settings guide recommends using the same attribution windows across app platforms and ad networks to reduce data discrepancies within Adjust. Airbridge’s attribution-window guide explains that its lookback and attribution windows affect channel metrics and that a global setting applies except where a channel has its own setting. Record channel-specific exceptions rather than assuming one global setting governs every row.
Keep click-through and view-through treatment explicit. Adjust’s attribution methods documentation describes deterministic attribution and probabilistic modeling for clicks and impressions, with the method depending on the conversion type and engagement quality. When the network and MMP use different eligible touchpoints or matching methods, their credited installs can differ even when both report accurately under their own rules.
Decide how to treat reinstalls before starting the comparison. Adjust’s uninstall and reinstall guide describes reattribution rules that can count an eligible return as a reattribution reinstall after inactivity, engagement, and a new session. For the CPI report, decide whether those returning users belong in new-user acquisition or a separate re-engagement view, then apply that decision to every channel.
3. Connect channel spend with attributed installs
A channel comparison needs two matched data streams: campaign cost and attributed installs. Connect or import both, confirm that each app and campaign maps to the same identifier, and verify that dates and reporting levels line up before calculating CPI.
- Select the app and platform. Use one measurement report for attributed installs, and match its app and operating system to the campaigns in the comparison. Airbridge separates the lookback window before a target event from the attribution window after it, and says both settings affect channel metrics in its attribution-window guide.
- Connect each channel’s cost data. Airbridge’s Google Ads cost guide and Meta Ads cost guide direct users to connect the relevant account and select the ad accounts; both guides specify recent campaign activity for the account. For manual spend imports, use the same date range, currency, campaign level, and identifiers as the install report.
- Match campaign names and report levels. Choose whether to compare at campaign, ad group, or channel level. Pair campaign-level cost with campaign-level attributed installs, and use the same rule for each row.
- Validate a completed period. Compare an imported cost row with its ad account and verify that the campaign identifier, app, and date range match the install report. Fix mismatched identifiers or date ranges before calculating CPI.
- Save the definitions with the result. Record the period, cost source, install definition, attribution windows, and reinstall rule in the report notes. Reuse those settings for the next weekly or monthly update, and add the new reporting period.
An MMP’s setup flow usually connects its app and the advertising account. In the AppsFlyer Google Ads integration guide, the setup starts by selecting AppsFlyer as the app analytics provider, choosing Android or iOS, selecting the app, and creating a link ID. Branch’s Google App Campaign instructions call for configuring events and attribution windows in Branch before importing app conversion data into Google Ads. These examples make the operator’s sequence clear: connect app measurement, configure conversion and attribution behavior, then connect the data used for optimization and reporting.
For a small team using Airbridge, start by matching your mix to Core’s named channel integrations: Google, Meta, TikTok, and Apple. Airbridge Core includes cost and ad-spend aggregation alongside attribution, so channel spend can sit with attributed app results in the measurement workflow. This fit is strongest when those integrations cover the paid channels you are using and the team wants a self-serve option without an annual contract.
The setup details differ by channel. Airbridge’s Google Ads cost integration guide directs an operator to Integration, Ad Channel Integration, Google Ads, and the Cost Integration tab, then to turn on the cost integration, add an account, grant access, and select the ad accounts. The guide says the account and selected ad accounts need a recent campaign-operation history. Imported Google Ads cost appears in Airbridge’s Actuals and Trend reports at campaign or ad group level.
Airbridge’s Meta cost integration guide similarly covers connecting a Meta account and importing its campaign cost, with cost available in Actuals and Trend reports at campaign or ad group level. When one connected account runs active campaigns for several apps, provide the Facebook App ID for each app in the Airbridge dashboard so the cost data maps to the intended app. That mapping step matters for a founder managing more than one app under the same ad account.
Airbridge Apple Ads cost integration requires the Campaign Management API integration. Airbridge’s Apple Ads integration guide says the API is available to Apple Ads Advanced users and cannot be used with Apple Ads Basic. When the Campaign Management API is unavailable, Airbridge directs users to upload ad spend manually. Imported Apple Ads costs appear in Actuals and Trend reports at campaign or ad group level.
4. Calculate CPI and make the result useful
For each channel, divide its spend by its attributed installs for the same reporting period and measurement setup:
CPI = channel spend ÷ attributed installs
Suppose three channels report the following spend and attributed installs for the same period.
| Illustrative channel | Spend for the period | Attributed installs | CPI calculation | CPI |
|---|---|---|---|---|
| Channel A | $1,200 | 240 | $1,200 ÷ 240 | $5.00 |
| Channel B | $980 | 280 | $980 ÷ 280 | $3.50 |
| Channel C | $1,500 | 250 | $1,500 ÷ 250 | $6.00 |
With these assumed inputs, Channel B produced more attributed installs for each dollar spent.
Build each row with the details that make the number interpretable: channel and campaign, reporting period and time zone, spend source, attributed-install definition, attributed installs, CPI, and any window or reinstall exceptions. Add one row per comparison unit, whether channel or campaign. If you include campaign-level rows, keep spend and installs at campaign level too.
A row with zero spend or zero attributed installs has no usable positive CPI from this division. Label the row “no spend” or “no attributed installs,” then verify account connection, campaign status, event timing, and campaign mapping. A blank or absent row should prompt a data check, not an assumption that CPI is zero.
Use the same source for every channel where possible. If one channel’s cost comes from an ad platform, another’s from an MMP integration, and a third’s from a manual file, label the sources and verify their cost coverage. AppsFlyer explains in its SSOT guide that its SSOT mechanism affects metrics calculated using install numbers while leaving the total reported cost unchanged. That is a useful practical distinction: changing the denominator method can change eCPI even when the spend numerator stays the same.
AppsFlyer’s SSOT analysis describes the mathematical effect of applying full campaign cost to only a partial set of install data: the smaller denominator raises eCPI. When you compare reports, match cost scope with install scope, then inspect the denominator if two CPI results diverge. A valid cost total paired with an incomplete attributed-install set can still produce a misleading comparison.
5. Diagnose why channel CPI figures differ
A channel CPI gap can come from different attribution windows or reinstall rules: Adjust recommends using the same windows across app platforms and ad networks, and its reinstall guide explains when an eligible return is recorded as a reattribution reinstall. Keep each figure labeled by report source, and reconcile one measurement setting at a time.
- Align the period and app time zone. Airbridge uses the time zone registered for the app to provide attribution data, as its time-zone guide explains; use a shared date range and record that time zone. Run both reports for the same completed period and date boundaries.
- Compare cost coverage. Use the same account, campaign set, currency, and cost-date basis in each numerator. Choose whether CPI covers ad-platform spend alone or includes other acquisition costs, such as taxes or agency charges, and apply that choice across channels.
- Use one install denominator. Choose attributed installs from one measurement report as the denominator, and label any network-native install total by its source. Use the same iOS privacy-reporting view across channel rows, and label network-postback totals by source.
- Align attribution eligibility. Adjust supports deterministic device matching and probabilistic modeling for clicks and impressions, as its attribution methods guide explains. A report that credits a longer period of eligible touchpoints can assign more installs to a channel.
- Check returning users. Adjust treats reinstalls as sessions and records reattribution when a reinstall meets the app- or link-level rules; decide whether those returning users belong in new-acquisition CPI or a separate re-engagement measure, using its reinstall guide. Separate re-engagement from first-time user acquisition when that distinction is relevant to your budget.
- Recalculate from the source values. Divide the cost value you have chosen by the install value using the same channel and period. This reveals whether the discrepancy comes from arithmetic, scope, or attribution.
AppsFlyer’s SKAdNetwork guide describes a model with a 30-day click-to-install window, a 24-hour view-to-install window, and a 60-day install-to-first-open window.
When your reconciliation still shows a gap, annotate it rather than hiding it. A note such as “MMP eCPI, app time zone, 7-day click window, view-through included, reinstalls excluded” tells a teammate what the figure represents. Keep a second note for a network-native CPI if its window or reporting method differs, and use the consistent MMP view for the channel-to-channel decision.
6. Choose channels by subscriber quality as well as CPI
The lowest CPI channel is the cheapest source of attributed installs under the selected rules. It is the right budget choice only when those installs deliver outcomes your subscription business values, such as trial starts, paid conversions, and users who remain active.
Add at least one downstream conversion measure to the CPI comparison. For a free-trial app, compare trial starts per attributed install, paid subscribers per attributed install, and spend per paid subscriber by channel. Use the same attribution period and enough time for each acquired cohort to have a fair chance to start a trial or subscription.
Consider the illustrative results below. Channel B had the lowest install CPI in the earlier example: $980 spent for 280 installs, or $3.50 per install. If 6 of those installs become paid subscribers, the illustrative cost per paid subscriber is about $163.33. If Channel A’s $1,200 produces 15 paid subscribers, its illustrative cost per paid subscriber is $80.00, despite its higher $5.00 CPI. Those assumed outcomes make Channel A the stronger paid-subscriber acquisition result in this example.
| Illustrative channel | Spend | Attributed installs | Paid subscribers | CPI | Cost per paid subscriber |
|---|---|---|---|---|---|
| Channel A | $1,200 | 240 | 15 | $5.00 | $80.00 |
| Channel B | $980 | 280 | 6 | $3.50 | $163.33 |
Compare retention by acquisition cohort: group users who installed during the same period, then measure how many return or stay active at shared points such as Day 1 and Day 7.
Use cohorts at the same age for budget decisions. A campaign launched yesterday may have an early CPI before its users have had enough time to start a trial or become paid subscribers. Compare each channel’s first seven days after install, then revisit trial starts, paid conversions, and revenue after the same follow-up period.
For subscription apps, align measurement with your billing system and events. Airbridge Core includes subscription-revenue aggregation and Predictive LTV, alongside cost and ad-spend aggregation. Its pricing information lists subscription revenue integrations such as RevenueCat and Adapty, so a team can keep its existing subscription platform while connecting revenue data to acquisition measurement. Use trial-start and paid-subscription events that match the definitions in your billing setup; record whether your cost-per-subscriber result counts an initial conversion or another milestone.
Set a practical decision rule before changing budgets. For example, keep spend stable while a cohort is immature, then shift budget toward a channel when its cost per paid subscriber and early retention meet your own payback or quality target. That target depends on your trial structure, price, refunds, and retention, so use your subscription economics instead of a universal CPI cutoff.
7. Pick a measurement scope that fits your channels
Choose the measurement setup that covers the channels you buy, imports the cost data you need, and reports the install or subscription outcomes you will use. For a small subscription app, first match channel coverage and data access to your workflow, then compare billing terms for the plans that fit.
| Option or need | Documented fit and decision point |
|---|---|
| Airbridge Core for a four-channel mix | Core names Google, Meta, TikTok, and Apple ad-channel integrations. Cost and ad-spend aggregation, ad-revenue aggregation, subscription-revenue aggregation, and Predictive LTV are included in Core. |
| Airbridge Core billing | Airbridge’s pricing page advertises a 30-day free trial followed by $40+/mo. Core includes 500,000 data points per month, charges $0.0001 for each additional data point, and has no annual contract. |
| Report sharing | Core includes report-level export to Google Sheets or CSV, which suits a team reviewing report results in a spreadsheet. |
| Raw event-data workflows | Airbridge identifies raw data export, including raw CSV, cloud export, and raw-data API access, as Growth scope. CAPI is also a Growth feature. Choose a plan that includes those features when your workflow requires raw event-level export or that server-side connection. |
| AppsFlyer | AppsFlyer defines dashboard eCPI as cost divided by attributions, and its Google Ads setup guide walks users through selecting the analytics provider, platform, and app, then creating a link ID. |
| Adjust | Adjust’s attribution-methods guide describes deterministic attribution and probabilistic modeling for clicks and impressions; its app-level settings guide recommends consistent attribution windows across app platforms and ad networks. |
| Branch | Branch’s Google App Campaign guide directs marketers to configure events and attribution windows in Branch before importing app conversion data into Google Ads. |
The 30-day Airbridge Core trial begins when the organization is created, and usage is unlimited during the trial, according to the plans and payments guide.
Distinguish report exports from raw data access when you shortlist tools. A report exported to Sheets or CSV contains the report view, while raw data export supports event-level access for a separate analysis pipeline. Teams using a lightweight scorecard can use report-level exports; teams that need raw events in a warehouse or through an API should include the Growth scope in their plan comparison.
FAQS
FAQ
Should I use the ad network’s CPI or the MMP’s CPI?
Use one consistent MMP-attributed install definition for the channel comparison, and label any network-native CPI separately. Their settings, cost inputs, and attribution rules can differ, so retaining the source label keeps each value interpretable.
Is the lowest CPI always the channel to scale?
No. The lowest CPI identifies the cheapest attributed installs, while cost per paid subscriber and cohort retention show whether those installs become valuable subscription customers.
Can Airbridge Core fit a team using an existing subscription platform?
Yes. Airbridge Core includes subscription-revenue aggregation, and Airbridge lists RevenueCat and Adapty among subscription revenue integrations. Keep your subscription platform and compare acquisition channels using mapped trial and paid-subscription events.
Does Airbridge Core include raw data export and CAPI?
No. Raw data export and CAPI are Growth features; Core includes report-level export to Sheets or CSV for report workflows.
Get Started Free
See how these criteria hold up on the real thing.