How to Compare Non-Gaming Subscription App Performance
Compare subscription apps by recurring value, plan terms, paid conversion, renewals and refunds, matching cohorts before judging campaign quality.

Compare subscription apps by recurring value, paid conversion, and renewal quality.
- Replace play volume with the user problem solved and the plan value delivered.
- Compare trial starts, first payments, and later renewals as separate stages.
- Match category, plan length, trial offer, platform, and cohort age before reading benchmarks.
- Measure the campaign behind the subscriber, then follow refunds and renewals.
If you are comparing a subscription app with a game-oriented scorecard, change the unit of success. Compare how acquisition cohorts move from attributed installs to trial starts, first payments, and later renewals; use installs and sessions to diagnose where that journey changes. For a small team buying ads, the useful question is which acquisition cohort turns into paid subscribers who keep receiving enough value to renew.
| A game-oriented measure | Subscription-app measure | What the subscription measure answers |
|---|---|---|
| Play time or sessions | Recurring user problem and usage cadence | Does the app solve a repeat need, even if that need does not arise every day? |
| In-game purchase activity | Plan price, billing period, and included access | What does a subscriber pay, how often, and what can they use? |
| Install volume | Attributed installs, trial starts, and first paid charges | Which acquisition source produces each successive step? |
| Daily engagement or return rate | Renewal, cancellation, billing failure, and refund by cohort | Does the paid relationship continue, and what kind of ending occurred? |
The framework prioritizes recurring value and paid outcomes, while installs and engagement help diagnose earlier stages. A session can explain how a subscriber uses a product; a renewal shows that a billing period continued.
1. Compare the recurring job, not the play loop
Start by writing one sentence for the job each app helps the user complete. Then record how often that job naturally occurs. A workout app may serve a daily routine, while a travel utility may be valuable mainly before and during a trip. Comparing their daily active use as if both jobs happened at the same pace would reward frequency rather than usefulness.
The useful comparison is whether users can get the promised result, how often they need that result, and whether the plan makes the value available when they need it. For example, a photo tool may see bursts of activity around editing projects, while a language-learning app may depend on repeated practice. A lower number of sessions can still fit an episodic job; an engagement decline can be a warning when the promised outcome depends on a regular routine.
Benchmark only against apps with a similar job and category. RevenueCat's State of Subscription Apps 2025 breaks reported performance out by category, platform, region, price point, and engagement strategy. Its category medians for trial-to-paid conversion also differ: Travel is reported at 48.7%, Media & Entertainment at 43.8%, and Health & Fitness at 39.9%. Those are useful context for a question such as “Is my trial conversion unusual for this kind of app?” Use these figures as benchmarks when the app's category, offer, traffic source, and subscriber mix resemble the segment being assessed.
Segment benchmarks by app category, operating system, trial offer, subscription duration, and conversion event before comparing percentages. If two apps serve different jobs, compare how well each serves its own audience first, then compare the economics of their paid cohorts on like-for-like terms.
Usage frequency helps show whether the app fits the user's natural routine or occasional task. In a U.S. transaction-data study of ten popular subscription services, researchers at the National Bureau of Economic Research examined renewal behavior and the role of consumer inattention. Their model estimates how inattention can leave subscribers paying after the service's flow benefit falls below its price. Pair renewal data with cancellations, refunds, subscriber feedback, and the product outcome the plan promises.
2. Adjust the comparison for how often the user needs the app
Compare the user’s job and its natural rhythm before comparing feature counts. Ask what triggers use, how quickly a user should see the promised result, and what continuing value arrives during a billing period. These questions work for both frequent and episodic products, but the evidence of value will look different.
A daily-use product can examine whether users return to a routine, complete its core task, and keep paying through later cycles. An episodic travel product can examine whether users activate around a trip, successfully complete the important travel task, and renew when the next period of value arrives. A photo product can measure completed edits and successful exports rather than treating time spent browsing as the goal. These are examples of product-specific leading indicators; the renewal remains a separate paid outcome.
A practical comparison separates three layers:
- The job: What progress or service does the app promise?
- The use pattern: When would a satisfied user need that progress or service?
- The paid evidence: Which events show activation, first payment, and continued payment?
If an app promises a daily habit, a decline in core-task completion before renewal can flag a retention problem worth investigating. If an app solves a task used a few times a year, low daily activity may be expected; successful task completion, repeat use at the next natural occasion, and paid retention provide a better read. The comparison should reward the outcome relevant to that product, not a universal session target.
RevenueCat's 2026 category renewal benchmarks report a metric RevenueCat labels "active renewal rate" by app category and plan duration. Check RevenueCat's definition before treating it as a cohort renewal rate: it describes the mix of renewals among active subscriptions, not the share of a cohort that renews. Its reported Health & Fitness figures are 54% for weekly, 57% for monthly, and 25% for annual plans. Media & Entertainment is reported at 45% weekly, 58% monthly, and 37% annual. Compare benchmarks within the same app category and billing period, and only against your own number computed the same way RevenueCat computes it.
Use the benchmarks to form a focused question. For example, if your app sells an annual plan, compare its annual subscriber cohort with annual category evidence, rather than using a weekly-plan percentage. When two apps have different user rhythms, judge each against a fitting category and plan segment, then compare how much paid value each cohort yields over the same elapsed time. Do not treat a weekly renewal percentage and an annual renewal percentage as equivalent events.
3. Make the plans comparable before comparing their prices
Match the access each plan provides before interpreting price differences. Record the full price, billing interval, trial length, introductory price, renewal price, included features, usage limits, and cancellation terms. Then compare what a new user can access during the offer and what the recurring charge buys after it ends.
| Plan detail | Record for each app | Why the detail changes the comparison |
|---|---|---|
| Included access | Features, content, service, and plan tier | A lower price can provide less of the recurring product value. |
| Price and billing interval | Full price and weekly, monthly, or annual charge | The amount due and the time covered must be compared together. |
| Trial or introductory offer | Eligibility, length, any charge during the offer, and next price | A trial start and a discounted purchase create different paths to payment. |
| Renewal | Regular renewal price, date or period, and automatic-renewal terms | The first checkout amount may not be the cost of staying subscribed. |
| Limits and exclusions | Usage caps, device limits, content limits, or feature restrictions | The same plan label can represent different access. |
Apple's subscription guidance says subscription information should clearly describe the name and duration, the content or services provided during the period, and the full renewal price. Apple also explains that an auto-renewable subscription renews at the end of its duration until the user cancels. These details offer a concrete checklist for comparing App Store offers: price alone does not tell the reader what the plan provides or how often the charge recurs.
Google Play's subscription offer guidance calls for a clear description of the offer's duration, pricing, and accessible content or services before enrollment. For a free trial, it says the offer should explain how long the trial lasts, when it converts to a paid subscription, the price after conversion, and how to cancel before conversion. The Google Play subscription information policy also says users should not need an extra action to review the subscription information.
For U.S. online subscriptions, the Federal Trade Commission describes the Restore Online Shoppers’ Confidence Act requirements as clear disclosure of service terms, consumer consent before charging, and a simple cancellation method. That legal baseline reinforces a fair comparison: include the renewal amount and the route to cancel, not just the signup offer.
Normalize prices only after recording the actual terms. As a simple example, suppose one plan costs $12 per month and another costs $96 per year. The annual offer averages $8 per month when its $96 price is divided by 12, but the annual customer pays the full $96 for a year of access. State both figures so the reader can compare ongoing average cost and upfront commitment. If the annual plan has fewer features or a longer trial, those differences remain part of the comparison.
A free tier, a free trial, and an introductory price are separate offers. A free tier grants some access without a paid conversion date; a free trial gives access for a set period before a paid offer may begin; and an introductory price charges a reduced amount for a set period. Put each offer in its own row or segment. Offer generosity affects trial-start rates, so compare starts separately from paid conversion after the offer ends.
4. Measure every step from the ad to the first payment
Use a funnel that keeps acquisition, activation, and payment separate. Compare each stage for the same platform, channel, offer, and acquisition period so you can see where apps diverge.
- Attributed installs: Count app installations attributed to the campaign or channel under the same attribution rules.
- Trial starts: Count users who begin a trial, divided by the eligible attributed installs in that cohort.
- Trial-to-paid conversion: Count trial starters who make the first paid charge after the trial, divided by trial starters whose trial window has finished.
- First paid transaction: Count the first successful paid subscription, including users who purchase without a trial, and distinguish that path from trial conversion.
- Later renewal: Count successful charges in later billing periods for the original paid cohort.
The denominator is part of the metric. A trial conversion rate should compare eligible trial starters with the number that reaches a paid charge, not all installs if the question is what happens after the trial. An install-to-paid rate answers a broader question about the entire acquisition journey. Track both when useful, label each clearly, and apply the same denominator to both apps.
Subscription platforms can use different event names and sequences. RevenueCat's webhook-flow documentation describes a trial signup as an INITIAL_PURCHASE event with a trial period type. If the subscriber does not cancel before the trial ends, the first paid charge is represented as a RENEWAL event. In this flow, count that RENEWAL as trial-to-paid conversion, then distinguish it from later-cycle renewals in your comparison.
Build a shared business definition above provider-specific labels. Mark trial start, first successful paid charge, next successful charge, cancellation request, expiration, billing issue, and refund as distinct outcomes. Map each platform's events to those definitions, and retain the source event and timestamp so a team can explain how a count was produced. This prevents one app's trial conversion from being compared with another app's second-month renewal.
Compare cohorts by install or trial-start period, then give each one enough time to mature. If a seven-day trial began yesterday, its users have not had seven days to convert. Keep open trials out of a completed trial-to-paid denominator, or show them separately as pending. If one app has a longer trial, compare results after each trial has ended and show elapsed days since the initial install as a second view.
Weak install-to-trial conversion points toward audience, store listing, onboarding, or offer fit. Strong trial starts paired with weak paid conversion shift the question to trial experience, price, or perceived value. Healthy first payment with weak later renewal points to ongoing product value or the renewal experience. Test those explanations against product events and user feedback before reallocating ad spend.
5. Compare renewals and refunds after the first charge
A first payment starts the paid relationship, so continue tracking what happens in later billing periods. Compare subscribers at the same cohort age, billing interval, and renewal number.
| Post-payment outcome | What to count | How it changes the interpretation |
|---|---|---|
| Successful renewal | Paid continuation at a defined cycle | Shows that another billing period began successfully. |
| Cancellation request | Subscriber turned off future renewal | Shows intent to stop, while access may continue to the paid-through date. |
| Expiration | Access or subscription ended | Shows the paid relationship has ended for the observed period. |
| Billing issue | Charge failed or needs recovery | Separates payment failure from a deliberate decision to stop. |
| Refund | A paid amount was returned under the platform's recorded event | Adjusts the economics of the original purchase and may end access. |
RevenueCat's subscription lifecycle documentation explains why these outcomes should stay separate. In its documented flow, cancellation can leave access active through the current subscription period, and a refund can immediately remove associated entitlement access. A billing issue can also be recovered, with later events depending on the grace-period setup. For measurement, a cancellation request, loss of access, failed payment, and refunded purchase describe different customer and revenue states.
Set the observation window around the renewal event and plan interval being compared. For example, compare the share of monthly subscribers with a successful first renewal after that first paid month, then separately compare the share who reach the second renewal. For annual offers, wait until a full annual renewal is observable. Record the cohort start, plan interval, platform, campaign, and renewal number beside the rate.
RevenueCat's State of Subscription Apps 2026 renewal analysis reports median annual renewal rates of 23% to 40% at the first renewal, 44% to 64% at the second, and 56% to 70% at the third across app categories. Report each renewal number separately, comparing cohorts old enough to have reached that point.
When comparing channels, include refunds and billing recovery in the cohort economics. A channel that brings many first charges but also a higher share of refunds may produce less retained revenue than its initial conversion suggests. Present gross first payments, refunds, successful later renewals, and net revenue as separate values over the same elapsed period. That lets a founder see both acquisition efficiency and the health of paid subscribers without collapsing different events into a single “subscriber” count.
6. Connect the subscriber's later value to the campaign
The channel question is not just “Which source delivered the install?” It is “Which source delivered people who began a trial, paid, and renewed?” A campaign comparison needs a consistent path from attributed install to subscription lifecycle event, with the billing platform remaining the source for subscription status and charges.
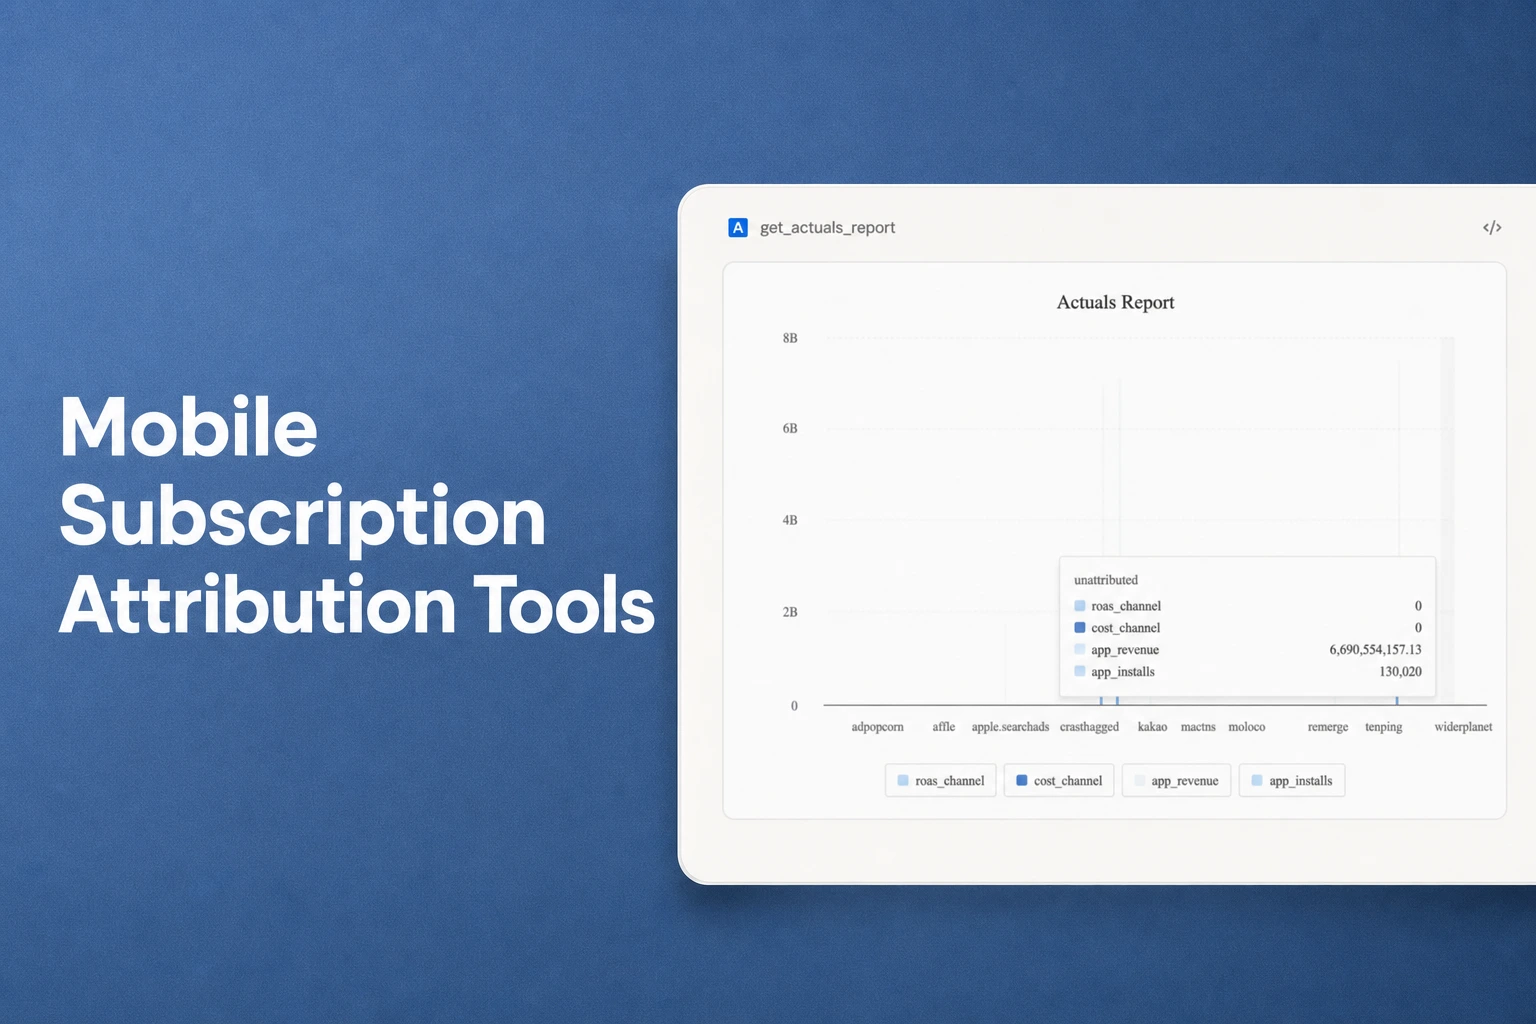
Airbridge Core links trial conversions, first payments, renewals, and refunds recorded in RevenueCat, Adapty, or Superwall to the campaign that acquired the user, when the chosen subscription platform is connected to Airbridge. That gives an advertising team a campaign-level view of supported lifecycle events across those subscription stacks. It does not change which service handles billing; choose the subscription platform that fits the app and measure events from the connected system.
The comparison criteria are concrete: can your workflow associate a trial conversion with its acquisition campaign, follow first payment and later renewals, and identify refunds against that same acquisition path? If it can report attributed installs but cannot connect a paid event to a campaign, it answers the acquisition question but leaves the revenue question open. If it connects only an initial payment, you still need later renewals and refunds to compare long-term subscriber quality.
Allow for privacy measurement and reporting delay, especially when comparing iOS acquisition. Apple's AdAttributionKit overview explains that campaign measurement is designed to verify installations without tracking an individual across apps owned by other companies. Apple's postback documentation gives a minimum elapsed time of 24–48 hours between an in-app conversion event and an ad network receiving a postback; the available detail can also depend on privacy thresholds.
For a fair channel comparison, define a reporting cutoff and compare cohorts after the same time has elapsed. Keep modeled or delayed platform reporting distinct from observed billing events. Match the campaign attribution window and event definitions across the channels being compared, then revisit the result as trial and renewal cohorts mature. A same-day campaign view can inform delivery, while mature subscription cohorts answer whether the acquired users paid and stayed.
7. Turn the criteria into a decision
Make the comparison in two passes. First establish whether the apps or cohorts are comparable. Then decide which performance outcome should carry the most weight for the current business question.
Use this short pre-decision checklist:
- Match apps by recurring job and category, or assess each within its own category-specific goal.
- Compare equivalent plan access, price, billing interval, trial and introductory offer terms, and renewal price.
- Do the rates use the same event definition and denominator?
- Give trial and renewal cohorts equal elapsed time to reach the event being measured.
- Are attributed installs, paid charges, cancellations, billing issues, refunds, and renewals distinguishable?
- Can the paid event be tied back to the campaign under the same attribution and reporting rules?
Then weight the evidence to fit the question. If you are deciding where to direct next week's acquisition spend, give more weight to recent install-to-trial and trial-to-first-payment performance, with mature paid outcomes as a check. If you are deciding whether to scale a channel over the next quarter, prioritize paid retention and net revenue by acquisition cohort. If you are comparing two subscription apps for a product partnership or investment decision, include recurring job, plan value, and cohort economics rather than relying on a single funnel rate.
Suppose Campaign A brings 100 attributed installs and 20 trial starts, while Campaign B brings 100 attributed installs and 12 trial starts. If, after all trials mature, 5 Campaign A trial starters and 6 Campaign B starters make a first paid charge, A has a 25% trial-to-paid rate and B has a 50% rate. In this example, Campaign B produces one more first paid subscriber, six versus five, despite having fewer trial starts. If a later observation finds a different renewal pattern, use that mature cohort evidence before deciding which campaign has better retained value.
Finish with a measurement-fit conclusion, not a universal winner. One app may turn more installs into trials, another may convert a greater share of trials to paid, and a third may retain more paid subscribers through a matching billing period. The sound decision names which outcome matters now, cites the matching cohort, and gives the team a next action tied to the weakest stage.
FAQS
FAQ
Should I compare daily active users between a subscription app and a game?
Only when daily use is a core part of both products' promises. Compare completion of each app's central user job and use daily activity as a diagnostic measure when the job depends on a daily routine.
Should I count trial signups as subscribers?
No. A trial signup shows that someone started an offer; a paid subscription requires a successful charge. Report trial starts, first paid charges, and later renewals as separate stages.
Can I compare monthly and annual renewal rates directly?
No. A monthly renewal and an annual renewal happen at different intervals and describe different elapsed time. Compare the same plan interval and renewal number, then use an annualized price calculation only as a separate price view.
How long should I wait before judging a cohort?
Wait until the event being measured could occur for the entire cohort. A trial-to-paid rate needs the trial window to finish; an annual renewal rate needs the first annual renewal date to pass. Keep immature subscribers visible as pending rather than counting them as failed conversions.
Which acquisition source produced subscribers who renew?
Compare mature paid cohorts by campaign, using the same attribution rules and renewal event. Airbridge Core connects supported trial conversions, first payments, renewals, and refunds from RevenueCat, Adapty, or Superwall to the acquiring campaign when that subscription platform is connected.
Get Started Free
See how these criteria hold up on the real thing.