How to Build an Install-to-Subscribe Funnel by Channel in Airbridge
See install-to-subscribe conversion rates and times by ad channel in Airbridge, check step drop-offs, and set a conversion window from 1 to 180 days.
Key Takeaway
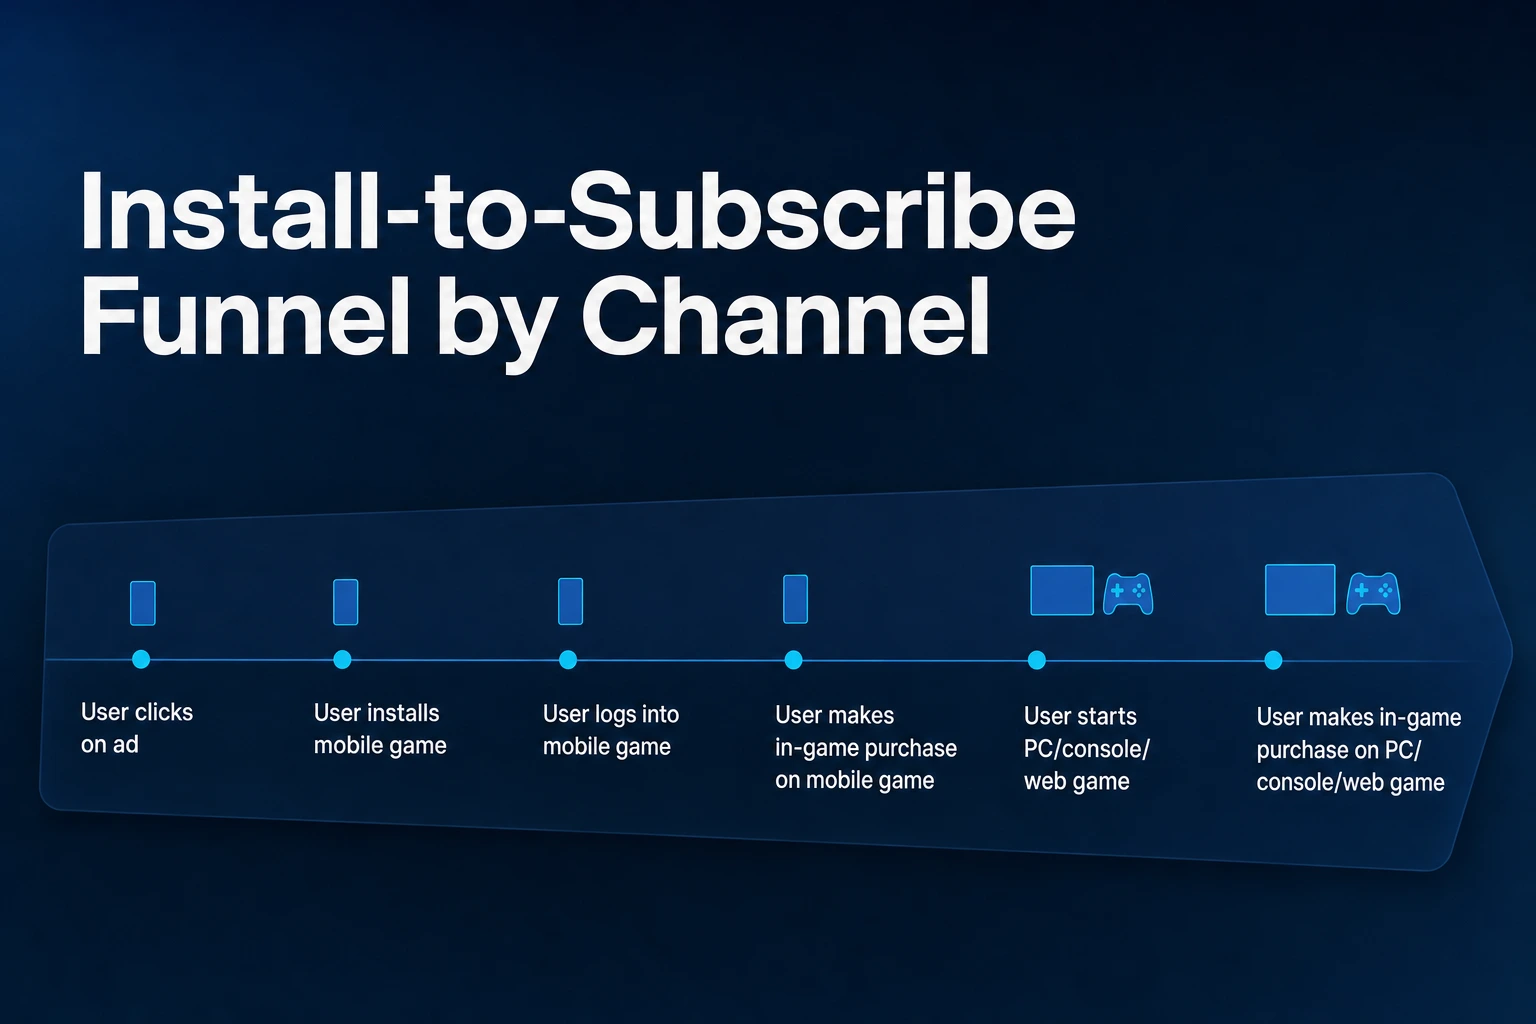
- Map your install, Start Trial, and Subscribe sequence in the Airbridge Funnel Report and set GroupBy to Channel to view conversion rates and conversion times by ad channel.
- Hover over empty bars in the report chart to check exact drop-off counts and the drop-off rate from the previous step.
- Set a conversion window between 1 and 180 days.
Paid ads might bring installs into your subscription app, yet revenue stays flat when users abandon the flow before starting a trial or converting to a paid plan. Looking at top-level install numbers or total revenue in isolation leaves a blind spot right in the middle of your onboarding and paywall experience. When you wear five hats on a small growth team, you cannot afford to guess whether a weak trial-to-paid number comes from a broken paywall or from an ad channel sending low-intent traffic. Breaking down each transition step by acquisition source shows you whether the leak happens right after install or at the end of the trial period.
Map Install to Subscribe Steps
Start by defining the exact sequence of events a user must complete. The Funnel Report visualizes the user journey in charts and tables. You configure a report using an aggregation basis, a cohort, a funnel entrance date range, your chosen steps, a conversion window, and a GroupBy.
For a subscription app on the Airbridge Core Plan, Airbridge provides 25 preconfigured standard events in total, three of which are subscription events: Start Trial, Subscribe, and Unsubscribe. You can use these standard events to set your steps in order without having to design a custom event taxonomy from scratch.
With Is First Event per Device ID = true on Step 1, the funnel includes only app install events identified as the first event by the Airbridge Device ID.
Pay close attention to how dates work when you set the funnel entrance date range. The funnel entrance date range tracks only the Step 1 event, while the conversion window is the timeframe for tracking the following steps. If you select a one-week entrance range, you are selecting the cohort of users who installed during that specific week, and the report will follow their subsequent trial starts and subscriptions across the conversion window you assign.
Read Conversion and Drop-Offs
Once your steps are in place, you need to distinguish between cumulative funnel performance and step-by-step friction. Mixing up those two rates can lead you to fix the wrong part of your app.
The Funnel Report chart displays values by step as a bar graph. Depending on where you place your cursor on the graph, you get different slices of the transition math:
-
Hovering over a filled bar shows the number of converted users, the conversion rate from the first step, and the conversion rate from the previous step.
-
Hovering over an empty bar shows the number of drop-off users and the drop-off rate from the previous step.
-
Converted users is the number of users who completed each step.
-
Total Conversion Rate is the share of users who completed the first step and also completed the given step.
-
Conversion Rate from Previous Step is the share of users who completed the previous step and also completed the given step.
-
Drop-offs is the number of users who did not complete each step.
-
Drop-off Rate from Previous Step is the share of users who completed the previous step but did not complete the given step.
When you evaluate an onboarding paywall change, look at the Conversion Rate from Previous Step between install and Start Trial. When you evaluate whether trial users find enough value to pay, look at the Drop-off Rate from Previous Step between Start Trial and Subscribe.
Break It Down by Ad Channel
An aggregate funnel hides how different traffic sources behave after the install. One ad network might drive cheap installs that rarely start a trial, while another brings fewer installs that convert to paid subscribers at a higher rate. Funnel reports can be used to compare conversion rates and conversion times by ad channel, campaign, or creative.
Selecting Channel as the GroupBy allows conversion rates and conversion times to be viewed by ad channel. Selecting Campaign as the GroupBy lets you compare the same install-to-subscribe steps across campaigns.
Keep one technical rule in mind when you combine GroupBys with step-level filters. A GroupBy groups data from all funnel steps by the selected GroupBy option. Because of how this grouping applies across the entire sequence, an event-property filter on a step after Step 1 may seem not to work when the GroupBy matches the filter item. When you want to slice your funnel by a property, decide whether it belongs in the global GroupBy or as a filter on a specific step rather than applying the same dimension to both.
Check Conversion Time Windows
Subscription apps rarely convert users from install to paid on the same day if a free trial sits in the middle.
A Funnel Report analyzes how a cohort converts through a defined sequence of events and includes the time each conversion takes. By setting up a user cohort and funnel steps, the report provides the conversion rate, the number of converted users, and the average conversion time. Checking the average conversion time tells you whether users start their trial immediately during onboarding or days after installing the app.
To make sure your paid conversions are counted, match your conversion window to your billing cycle. The conversion window is the period after a user completes the first step during which subsequent steps are aggregated, and users who complete later steps after it expires are not aggregated. You can set the window to 1, 7, 30, 60, 90, or 180 days, or to an entered number from 1 to 180.
With a 7-day conversion window, a user who completes Step 1 on Feb 8 at 9:00 PM is tracked until Feb 15 at 9:00 PM.
FAQS
FAQ
How much does it cost to access the Funnel Report on the Airbridge Core Plan?
The Airbridge Core Plan starts with a 30-day free trial, then costs $40+/mo with 500,000 data points per month included, and can be canceled anytime. Additional data points cost $0.0001 each, and the data point allowance is measured based on the events Airbridge collects for your app.
Which ad channels and reports are included in the Core Plan?
The Core Plan includes integrations for Google, Meta, Apple Ads, and TikTok, along with up to two third-party integrations. Alongside the Funnel Report, the plan includes the Actuals, Trend, Active Users, Retention, and Revenue reports, cohort analysis, Predictive LTV, subscription revenue aggregation, and cost and ad spend aggregation.
Related reading
Spot every funnel leak
Map your install to subscribe steps and compare drop-offs by channel.