How Airbridge Calculates Retention for Subscription App Cohorts
Learn how Airbridge calculates cohort retention, why Retention and Actuals install counts differ, and how date buckets and deduplication affect totals.
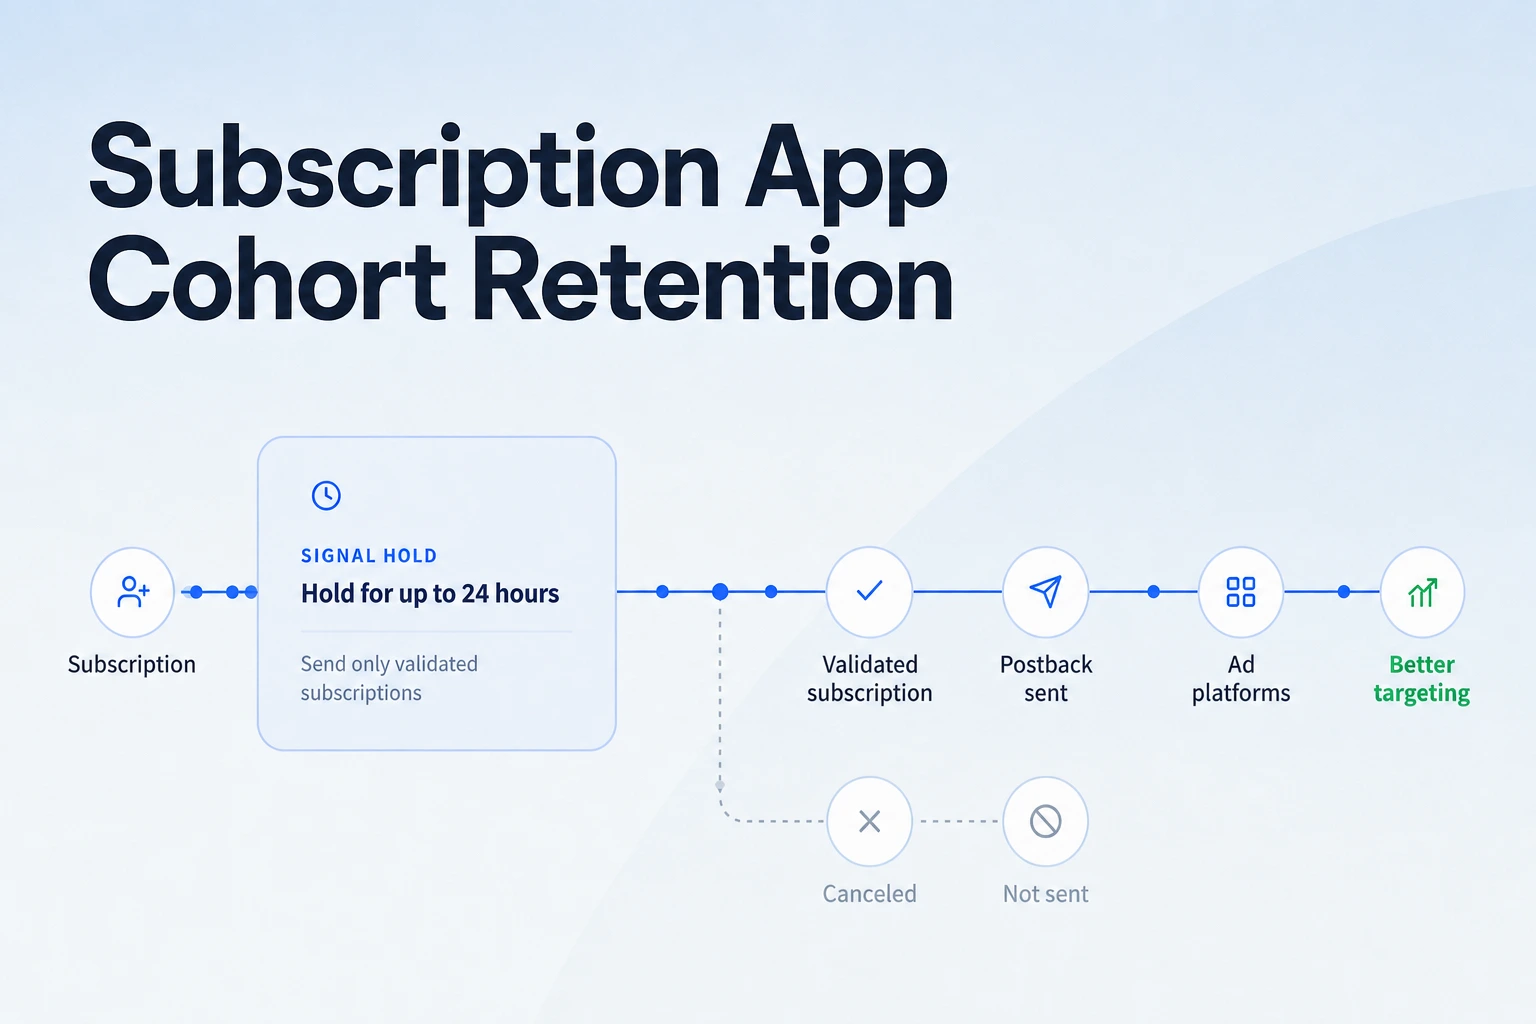
Key Takeaway
- Airbridge calculates retention rate—including Day 1, Day 7, and Day 30 retention by campaign source—as the percentage of users who perform a Return Event among those who performed the Start Event during your set date range.
- Installs in the Retention Report are usually lower than in the Actuals Report because the Retention Report excludes duplicate installs.
- When a user performs multiple Start Events in different date buckets during the set date range, the top summary row deduplicates users across the entire date range, so it can differ from the sum of individual date sub-rows.
You open your dashboard on Monday morning to check how last week's paid acquisition campaigns are holding up. You look at your install numbers in one tab, switch over to check your cohort retention in another, and notice the starting install counts do not match. When you are managing ad spend and watching every trial conversion yourself, even a small discrepancy between reports makes you pause before adjusting budgets. Checking how cohort grouping, calendar boundaries, and deduplication rules work in Airbridge explains why these numbers differ.
How Retention Rate Is Defined
Retention rate in Airbridge is the percentage of users who performed a Return Event out of the users who performed a Start Event within your chosen date range. The Start Event represents a user's initial engagement with your app during that analysis period, and the report displays retention data for user groups according to the performed event type. Because you can select the specific Start Event, you are able to view the retention rate of the exact users who performed those events.
When tracking what happens after that initial action, Airbridge provides two calculation modes depending on whether you want to follow multiple journeys or isolate one:
- In General mode, the report measures retention by aggregating Return Events based on all Start Events that occurred during the set date range.
- In Confined mode, retention is measured against a single Start Event; as soon as a new Start Event happens, measurement of the user journey from the previous Start Event stops.
When Day N Starts is set to At Midnight, Day N follows calendar dates, and each Return Event is aggregated by the date it occurred. Under this calendar-date calculation, a Return Event that happens less than 24 hours after a Start Event can still count in Day 1 if the calendar date has changed in the meantime. For example, if a user triggers a Start Event late at night and comes back the next morning, the calendar date has rolled over even though a full 24 hours have not passed. You will also see 100% in the initial period column: Day 0, Week 0, Month 0, Hour 0, and Minute 0 retention rates are 100% whenever your selected Return Events include all Start Events, since the Start Event itself is also counted as a Return Event.
Top Row vs. Sub-Row Totals
If you export a table or manually add up the user counts from each daily or weekly row in your cohort table, the sum can exceed the number shown in the top summary row when a user performs multiple Start Events in different date buckets during your set date range. This happens when the same person triggers a Start Event on more than one day during your selected period.
The top row counts unique users aggregated across the entire set date range, meaning a user with Start Events in multiple date buckets is counted only once in that top line. Each sub-row, however, counts unique users for its individual date bucket, so that same user is counted once in every bucket where they performed a Start Event; as a result, the top-row total can differ from the sum of the sub-rows. When you are evaluating how many distinct people entered your funnel over a two-week campaign window versus how many started on a specific Tuesday, looking at the top row gives you the deduplicated count of retained users across the full period.
Retention vs. Actuals Installs
Comparing your acquisition volume across reports is a common workflow, especially when reconciling ad network spend against in-app activity. If you put the Retention Report and the Actuals Report side by side for the same date range, the install figures will rarely be identical.
The Retention Report excludes duplicate installs, whereas the Actuals Report includes them, which means Installs (App) in the Retention Report is usually lower. How Airbridge identifies and removes those duplicates depends on the Identifier setting you choose in the report: it uses the Airbridge Device ID when set to Device, and the Airbridge ID when set to User. Under this rule, multiple Installs (App) recorded for the same identifier on the same date count as one, while installs occurring on different dates count separately.
Reading Channel Retention
For subscription apps, knowing raw install volume is only the starting point; you need to see which ad networks bring in users who stay past the first week and convert. The Retention Report can break down cohort retention by GroupBys such as channel and campaign. You can view Day 1, Day 7, and Day 30 retention broken down by campaign source. In addition, cohort settings allow you to create a specific user segment and examine retention for that particular user group.
If you are running acquisition on the Airbridge Core Plan, ad network attribution connects to Google, Meta, Apple Ads, and TikTok. The Core Plan preconfigures 25 standard events in total, among which Start Trial, Subscribe, and Unsubscribe are the subscription events. By checking your retention tables alongside these standard events, you can see whether a campaign source holds onto users through Day 7 and Day 30.
FAQS
FAQ
Which reports and features are included in the Airbridge Core Plan?
The Airbridge Core Plan includes the Actuals, Trend, Active Users, Funnel, Retention, and Revenue reports, as well as cohort analysis, Predictive LTV, and SKAN 4.0 reporting.
How much does the Airbridge Core Plan cost?
The Core Plan starts with a 30-day free trial and is then priced at $40+/mo, which includes 500,000 data points per month with additional data points billed at $0.0001 each, and you can cancel anytime.
What happens in the Retention Report if a user reinstalls the app on a different day?
For the same identifier, Installs (App) that occur on the same date are deduplicated and counted as one, whereas installs that happen on different dates are counted separately.
Related reading
See which cohorts stay
Compare Day 1, Day 7, and Day 30 retention by campaign source.