3 MMPs Compared: Setup and Reporting for Lean App Teams
Compare setup, verification, and weekly reporting across Airbridge, Adjust, and Kochava, with a workload test to find the least-friction fit for a lean team.
For a lean team without a data role, which MMP takes less work to run?
- Airbridge documents an ordered 30-minute route from app registration to a verified event.
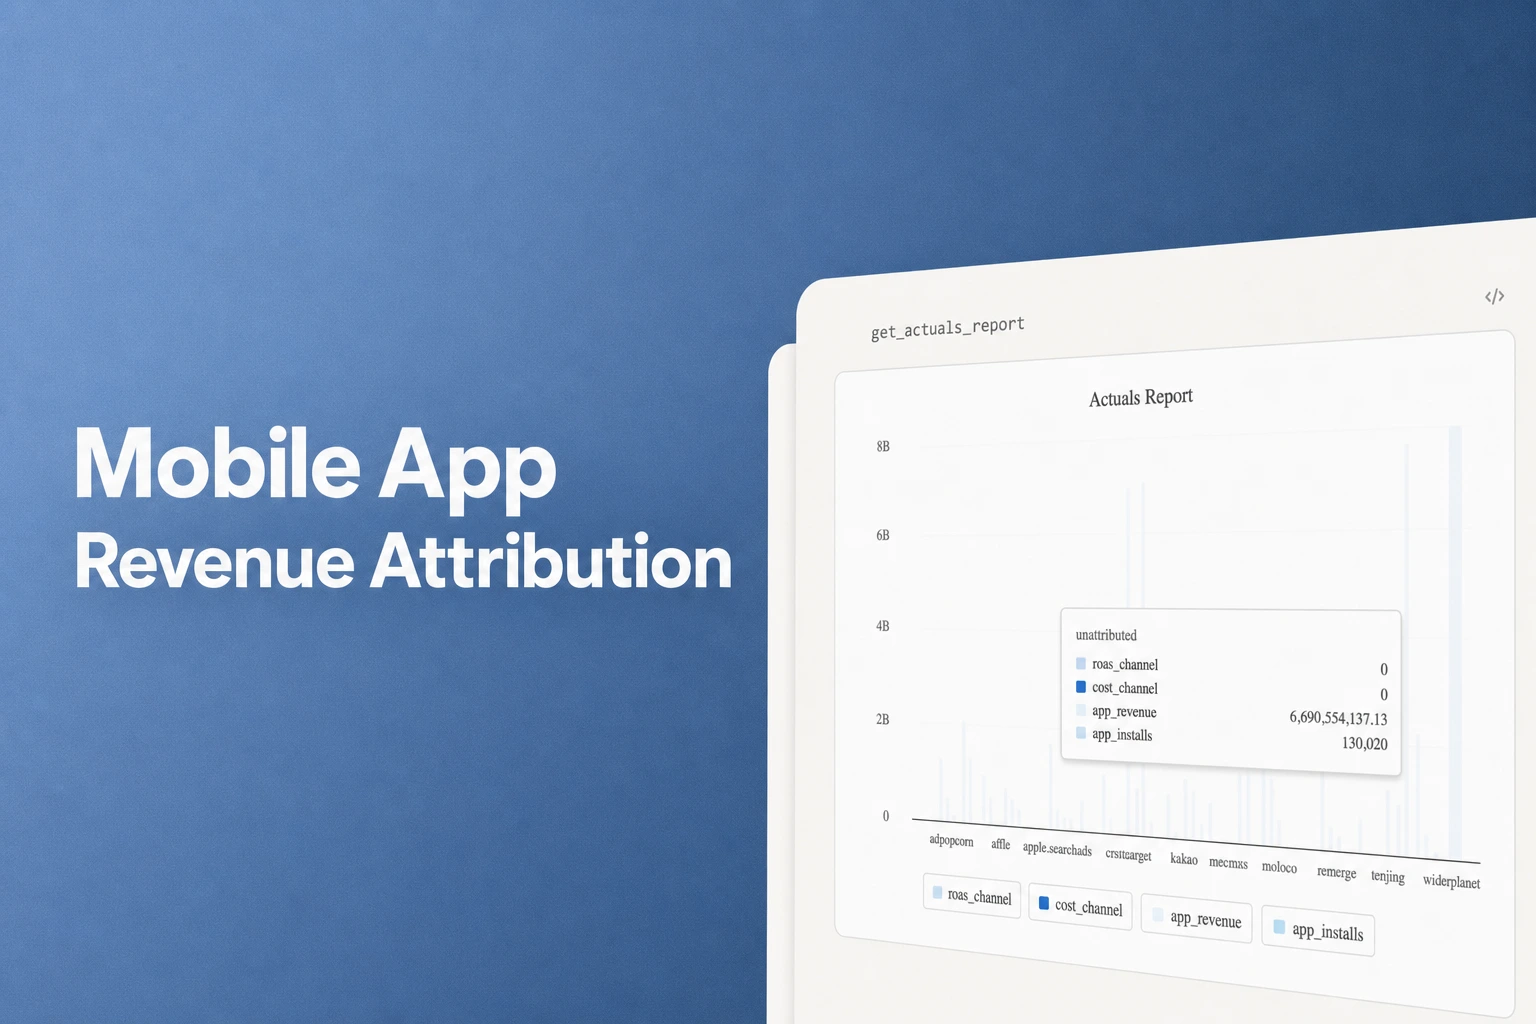
- Airbridge Core includes six built-in reports, including channel, campaign, and creative views.
- Adjust documents a setup path, SDK checks, and campaign dashboards with selectable metrics and dimensions.
- Kochava documents install and event checks in its dashboard, plus campaign summary reporting.
A mobile measurement partner (MMP) helps a mobile app team connect campaign sources with app results. When a founder is choosing ad creative, fixing onboarding, and reviewing performance, the workload includes two jobs: one-time setup of the software development kit (SDK), the code package integrated into the app, through a verified first event, and recurring campaign reporting. Airbridge is a practical first option to pilot for a lean team: its guide describes a 30-minute route from app registration to a real event, and its Core Plan includes six built-in reports. Adjust and Kochava also document in-product reporting, so compare all three with the same app, event, and campaign question.
1. Compare setup work separately from weekly reporting
A team without a data role should score two different jobs. Setup is the one-time path from creating the app record through SDK integration to confirming that an install or event arrived. Routine reporting is the repeated path from opening campaign results to answering a business question, such as which channel or campaign brought attributed installs.
Keep the first test small and consistent. Use the same app, platform, event, campaign source, and decision question for each candidate. For example, a team might ask, “Which campaign brought the most attributed installs last week?” The exact question should match what the founder actually needs to decide, rather than a report the team will never open.
Name the owner for each action and record every handoff so the score reflects who will do the work. App registration may sit with a founder, SDK changes with a mobile developer, event naming with product, and weekly reporting with the growth owner. Those handoffs are part of the workload. A platform can have a clear setup guide and still require engineering to put its SDK in the app, while an accessible dashboard can reduce the recurring effort after that initial release.
For a practical scorecard, record these items separately:
| Work area | What the team records | Why it affects the decision |
|---|---|---|
| App setup | App record fields, platform configuration, credentials, and handoffs | Shows how much information the owner must gather before development begins |
| SDK work | Developer tasks, app changes, and release dependencies | Makes the engineering portion visible rather than hiding it under “integration” |
| Verification | The install or event evidence the team can see, and where it appears | Gives the team a clear completion test |
| Routine report | Clicks and decisions required to answer the chosen campaign question | Shows whether a founder can repeat the work without an analyst |
| Report upkeep | Changes to events, dimensions, filters, or sharing that recur in the real workflow | Identifies the work created by the team’s actual reporting habits |
| Advanced data work | API, raw export, custom queries, or a warehouse path, when selected | Separates a basic marketer workflow from a technical extension |
Count a report as self-serve only when the person who owns growth can reproduce it with the available access and settings. If a developer builds an export or a custom dashboard first, record that as setup effort. If an analyst must refresh or reshape the data each week, record that under recurring effort. That distinction gives the team a cost it can act on: developer hours are spent once or during releases, while founder or analyst time is spent every reporting cycle.
The intended scope here is ordinary app-campaign work. A team asking about attributed installs, campaign performance, or a funnel can compare these candidates with the same task. A team that depends on a specialized data pipeline should add that precise work to its test instead of treating it as a required step for every user.
2. Airbridge: a defined first-event path and six built-in reports
Airbridge’s SDK setup guide describes a 30-minute path to register an app, install the SDK, and see a real event in the dashboard. The guide lists app registration, setting the app time zone and currency, copying the SDK token, adding the SDK to the project, and initializing it on launch as setup tasks.
The Airbridge SDK setup guide gives the developer and founder a tangible finish line. The developer initializes the SDK early in the app startup, then logs an event from a real user action. The team marks this task complete when the event appears in the SDK testing console, rather than when the code merely compiles. That visible check helps a founder confirm that setup has produced incoming data before relying on campaign reporting.
For recurring work, Airbridge says Core Plan includes six built-in reports and needs no custom dashboard design or data team. The Airbridge Marketing Analytics page describes campaign, trial, and retention questions the reports answer. Its Core Plan introduction names the reports and their jobs:
| Airbridge Core report | Question it is designed to answer | Useful recurring task |
|---|---|---|
| Actuals | What raw metrics appear by channel, campaign, or creative? | Compare campaign and creative results in the dimensions the growth owner reviews |
| Trend | How are key metrics changing over time? | See whether a campaign result is moving across reporting periods |
| Active User | What are daily, weekly, and monthly active-user trends? | Review activity alongside acquisition results |
| Funnel | Where do users drop off between install, trial, and subscription? | Find the step in the selected funnel where conversion changes |
| Retention | Which cohorts retain and which churn? | Compare retained users by cohort and source |
| Revenue | Which channels drive actual subscription revenue? | Relate acquisition sources to revenue when that question is part of the team’s work |
The report names and questions come from Airbridge’s Core Plan report guide; the product page states that all six are included in Core. For a team whose normal check is campaign performance, Actuals is the most direct starting point because it organizes raw metrics by channel, campaign, or creative. Trend adds a time view, while Funnel and Retention help the team look beyond the initial install when its decision calls for that context.
This built-in set matters to a lean operator because the reporting path begins with a named report instead of a blank dashboard-design task. A founder can start with the Actuals question, select the business view already represented by the report, and come back to the same kind of question during the next campaign review. The evidence supports the availability and stated purposes of those reports; the team should still use its own campaign question in the pilot to assess how naturally it can repeat the task.
Airbridge suits a lean team whose developer can integrate the SDK and whose recurring campaign questions fit the six built-in Core reports.
3. Adjust: a documented app-to-dashboard workflow
Adjust’s getting-started documentation lays out a four-part flow: add an app to the dashboard, integrate the SDK, set up data sources and campaigns, then analyze or export data. At app creation, the guide calls for an app name and reporting currency, followed by the applicable platform identifier, such as an App ID or iOS Bundle ID. Adjust says the reporting currency is permanent and recommends setting up single-platform apps, useful details for a founder who wants to prepare the app record before handing integration to a developer.
The Adjust getting-started guide says installs and sessions are recorded by default. It recommends adding in-app events based on campaign-optimization metrics the team cares about. The guide also describes basic SDK integration as available in all packages and says it enables measurement of installs, reattribution, and sessions. Those details separate the baseline install-and-session task from added event instrumentation the team chooses for its report questions.
Adjust documents a handoff workflow for integration. In its SDK integration instructions, an owner opens the app’s SDK integration tab, reviews the selected platforms and events, and sends the integration instructions to the developer by email. This provides an explicit owner-to-developer step. The getting-started guide also points to tests for install and event recording, and identifies successful recording as the key integration check.
For routine reporting, Adjust describes Datascape as a place to view metrics, measure campaign performance, and follow app-user lifecycles. It provides dedicated dashboards and a report builder for pivoting and drilling into dimensions. Its Real-time performance report documentation says the default table breaks down metrics by channel, while users can choose other metrics and dimensions. The Adjust report catalog describes Channel Overview as a snapshot for comparing installs, impressions, clicks, revenue, and cohorted revenue, and Basic Report as a way to view metrics and understand filters.
That reporting model gives a growth owner ready-made entry points and room to investigate further. A team should pilot both levels: open the standard channel view for its weekly answer, then record the additional steps if its real question requires a report builder, a custom dimension, or an export. The documentation presents dashboard reporting and data export as options in the broader workflow, so a lean team can keep the basic campaign question separate from any optional data handoff.
Adjust is a sound candidate when its dashboard structure, reporting currency setup, and event choices line up with the team’s workflow. It may suit a marketer who wants channel-level campaign metrics with the option to pivot and drill into dimensions. Its documented setup path includes app setup and developer coordination, while the team’s pilot determines how often it needs the more flexible reporting tools.
4. Kochava: explicit install and event checks with campaign reports
Kochava’s Android SDK guide asks the developer to check the App GUID, the app identifier entered in the SDK configuration.
Kochava’s integration documentation gives a developer a concrete way to validate setup. For iOS, its Apple SDK guide says to check that the correct App GUID appears in the SDK configuration, run the app for about 30 seconds under typical conditions, and then wait a minute or two before opening Install Feed Validation in the dashboard. “Integration Success!” confirms that Kochava received an install from the SDK. The Android SDK guide documents the same install-validation sequence.
Kochava documents a separate event check, which is useful because an install arriving does not itself confirm that the event the marketer wants is arriving. The developer launches the app, performs the action that should trigger the event, and gives the SDK 60 seconds to send it. After a further minute or two, the owner checks Event Manager for the tested event name. Kochava’s SDK integration testing guide also recommends enabling platform logging during integration to help confirm that an install or event was sent, then disabling logging for the production build.
For recurring campaign work, Kochava lists reports available through its Reports UI, including Click, Event, Install, Campaign Summary, Network Summary, Cost, and SKAdNetwork reports. The Kochava Reports overview describes Campaign Summary as aggregated campaign performance that can be grouped by time, geography, and other attribution variables. That gives a marketer a clear reporting option for campaign-level results and a way to add a breakdown when the weekly question needs it.
Its Analytics Performance guide says Campaign Performance displays impressions, clicks, click-through rate, installs, conversion rate, and event count by campaign over the past seven days. For a founder reviewing a recent launch, those values can show the relationship between campaign reach, response, attributed installs, and subsequent event activity in one time-bounded view.
These documents support a practical setup sequence: configure the SDK with the app’s identifier, run the app to generate an install, verify the install in Install Feed Validation, trigger a test event, and verify its name in Event Manager. The recurring-report choice is similarly concrete: start from the campaign performance or Campaign Summary view, then use time, geography, or attribution breakdowns when they answer a real question. A team that needs scheduled exports, API delivery, or custom data handling should list that as its own workflow and measure it as additional work.
Kochava fits a team that values explicit dashboard checks for both installs and event names, plus report views organized around campaigns and performance measures. The team can compare that approach directly with Airbridge’s testing-console event check and built-in report set, and with Adjust’s app handoff and channel report.
5. Side-by-side: score setup and reporting as separate jobs
| Task | Airbridge | Adjust | Kochava |
|---|---|---|---|
| App and SDK setup | Register the app, set its time zone and currency, copy the SDK token, add the SDK to the app, and initialize it on launch | Create the app, set the permanent reporting currency, enter platform IDs, select events, and send SDK instructions to the developer | Check that the SDK code uses the correct App GUID, then follow the platform SDK integration guide |
| Documented setup estimate | Setup guide describes a 30-minute path to app registration, SDK installation, and a real event in the dashboard | Getting-started documentation gives an ordered app, SDK, campaign/data-source, and analysis flow | Platform guides specify checks after integration, including about 30 seconds of app runtime for install validation under typical conditions |
| Install or event validation | Trigger a real user action and confirm the event in the SDK testing console | Test that Adjust records installs and events; the guide links to SDK testing steps | Confirm install in Install Feed Validation; trigger the desired action and confirm its event name in Event Manager |
| Standard campaign-report entry | Six Core built-in reports; Actuals compares channel, campaign, or creative metrics | Datascape dashboards; the real-time performance table breaks down metrics by channel by default | Campaign Performance reports seven-day campaign measures; Reports UI includes Campaign Summary |
| Report dimensions or range | Actuals is described by channel, campaign, or creative; Trend reviews metric change over time | Selectable metrics and dimensions; Channel Overview compares campaign metrics | Campaign Summary can group by time, geography, and other attribution variables; Campaign Performance covers the past seven days |
| Optional deeper work | Built-in reports give the standard starting point; evaluate any extra data workflow separately | Report builder supports pivoting and drill-down; the setup guide also offers analysis or export as workflow options | Campaign Summary offers grouped breakdowns; evaluate any selected API or export task as an additional workflow |
The setup rows show which person must complete the one-time app work, while the reporting rows show who can answer the recurring campaign question.
6. Which workflow should a lean team choose?
Choose by the team’s actual bottleneck: limited developer access makes setup ownership more important, while weekly reporting makes the growth owner’s recurring workflow the priority.
Adjust fits a team whose growth owner regularly needs to select dimensions and pivot or drill into campaign data in Datascape.
Kochava fits a team whose app-release process values separate dashboard checks for installs and event names.
7. Run a fair workload check before deciding
A useful pilot follows the same sequence for each candidate and records owners, elapsed time, and obstacles. Use a test build or other app environment that the developer can safely instrument. Agree on one test event that corresponds to a real user action, such as completing the app’s first meaningful screen, and keep the action the same across products.
- Prepare the test. Write down one weekly campaign question and the date range that answers it.
- Complete setup and verification. Have the assigned owners complete each product’s normal setup and its documented install or event check. Record where the result appears and who confirms it. Note each handoff or access delay.
- Record setup time. Start when the assigned owner begins setup and stop when the verification result appears. Log hands-on time separately from waiting for builds, releases, or dashboard refreshes. Track developer time separately from founder or marketer time.
- Run the same campaign report. Have the growth owner answer the chosen campaign question in each product. Record navigation, period, dimensions, and metric settings.
- Repeat without the developer. Have the person who will own reporting answer the same question again. Log the time from opening the product to saving or sharing the answer. Record whether a developer or analyst had to step in. Track any export or custom data handoff separately.
- Test one follow-up. Try a second campaign question the team expects to ask. Note whether the in-product report answers it or whether the team needs another dimension or data workflow.
- Choose in workload terms. Compare developer minutes, founder setup minutes, verification results, recurring report time, handoffs, and any optional technical work. Write down the selected workflow and one measured reason it fits the team’s needs.
A fair test holds the people and question constant, not just the app. Give the same growth owner access to each dashboard, let the same developer handle SDK steps, and use the same definition of a completed event. If one trial uses a finished SDK release and another uses a new code change, the comparison measures release timing as much as the product workflow. Keep those events in separate notes.
Use the final record to choose the workflow the team can maintain. Airbridge has a clear case when the documented first-event path and built-in reports cover the work the team repeats. Adjust or Kochava can earn the choice when the team’s measured run shows their report layout, validation process, or dimensions suit its current operating habits better. The answer is the product that lets the assigned people complete setup and repeat the relevant report with the least friction in the team’s real process.
FAQ
Does a team without an analyst need to build a custom dashboard?
No. Airbridge says Core Plan includes six built-in reports and requires no custom dashboard design or data team. Adjust documents dedicated dashboards and a report builder, while Kochava documents Campaign Performance and Campaign Summary reports; each gives a marketer a documented place to start.
What should count as successful SDK setup?
A visible install or event in the vendor’s stated verification destination counts as a useful acceptance check. Airbridge’s setup guide uses a real user action and an event in its SDK testing console; Adjust directs teams to test recorded installs and events; Kochava names Install Feed Validation and Event Manager for those checks.
Which platform gives a published setup-time estimate?
Airbridge’s setup guide describes a 30-minute path from app registration through SDK installation to seeing a real event. Use that as the guide’s stated estimate and time the same stages in your own pilot for each product.
Which report should a founder try first?
Start with the report that directly answers the next campaign decision. Airbridge Actuals is described for raw metrics by channel, campaign, or creative; Adjust Channel Overview compares campaign measures; Kochava Campaign Performance lists impressions, clicks, click-through rate, installs, conversion rate, and event count over the past seven days.
Should a team compare API or export work in the same test?
Only when that work is part of its normal reporting workflow. Record a built-in dashboard task separately from any selected export, API, or custom data handoff, then weigh the recurring tasks the team will actually own.
Get Started Free
See how these criteria hold up on the real thing.